 |
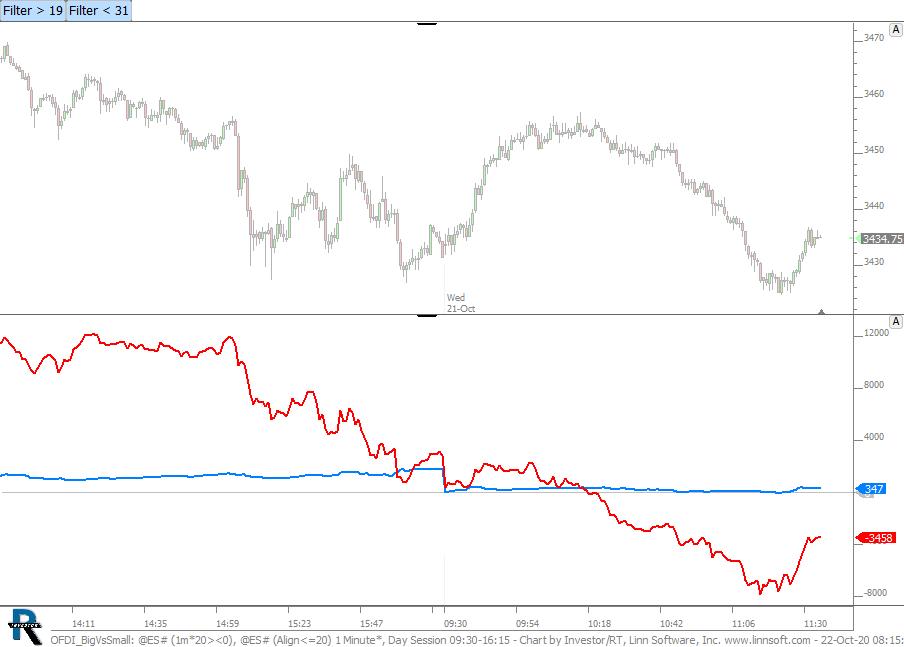
OFDI BigVsSmall (@ES#) cpayne [totalcount]
5 years 9 months ago
Cumulative Delta (Day) of big trades vs small trades. Use the button at the top to control the big vs small. |
View |
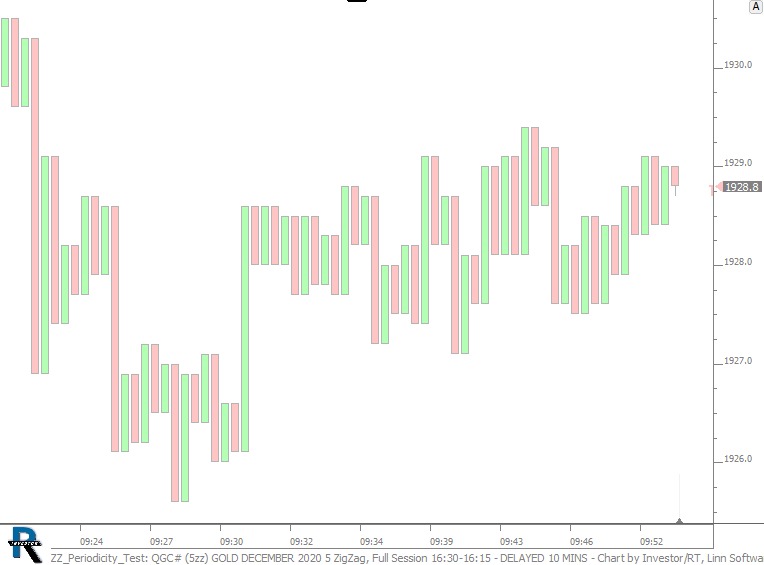 |
ZZ Periodicity Test (QGC#) cpayne [totalcount]
5 years 9 months ago
This chart was uploaded by Investor/RT 14.2.2 showing symbol: QGC#. |
View |
 |
Untitled 9 (EPZ20) Nicholas Clive [totalcount]
5 years 9 months ago
4. This chart was uploaded by Investor/RT 14.2.1 showing symbol: EPZ20. |
View |
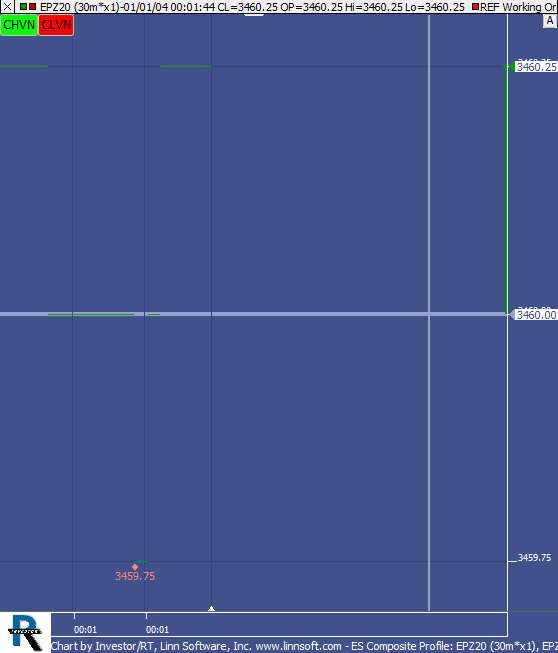 |
ES Composite Profile (EPZ20) Nicholas Clive [totalcount]
5 years 9 months ago
3. This chart was uploaded by Investor/RT 14.2.1 showing symbol: EPZ20. |
View |
 |
Nic ES1 (EPZ20) Nicholas Clive [totalcount]
5 years 9 months ago
2. This chart was uploaded by Investor/RT 14.2.1 showing symbol: EPZ20. |
View |
 |
ES 5 min main chart1 (EPZ20) Nicholas Clive [totalcount]
5 years 9 months ago
1. This chart was uploaded by Investor/RT 14.2.1 showing symbol: EPZ20. |
View |
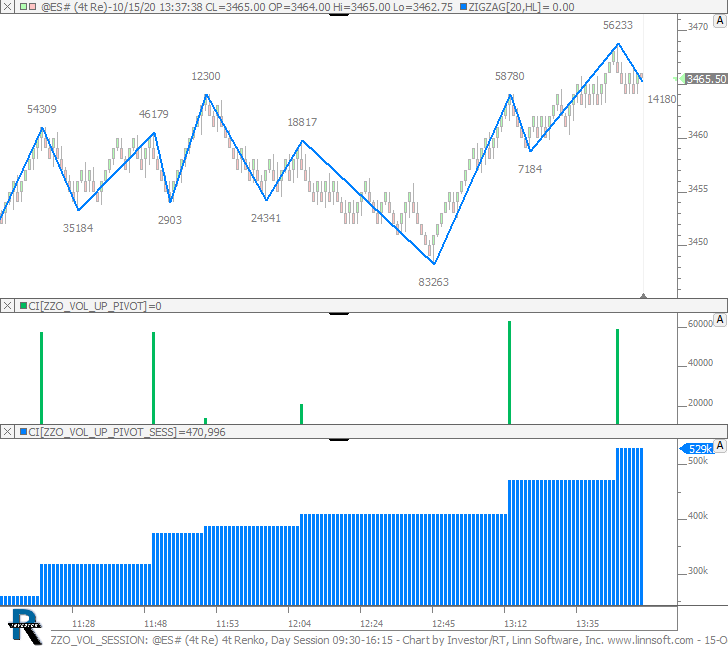 |
ZZO VOL SESSION (@ES#) cpayne [totalcount]
5 years 9 months ago
Sum the Volume of ZZ Up Rotations for the Session. This chart was uploaded by Investor/RT 14.2.2 showing symbol: @ES#. |
View |
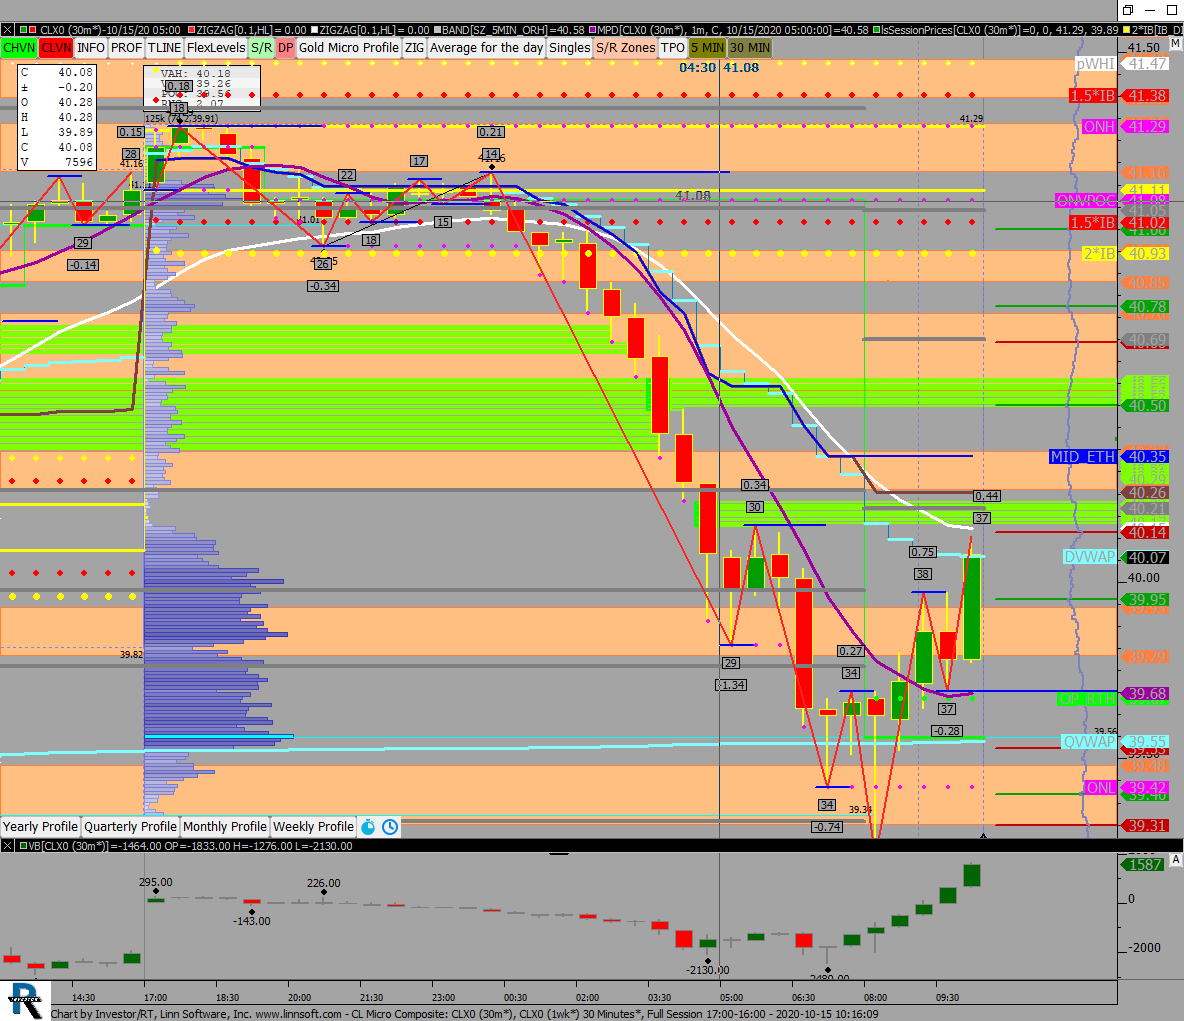 |
CL Micro Composite (CLX0) scottz46 [totalcount]
5 years 9 months ago
This chart was uploaded by Investor/RT 14.1.8 showing symbol: CLX0. |
View |
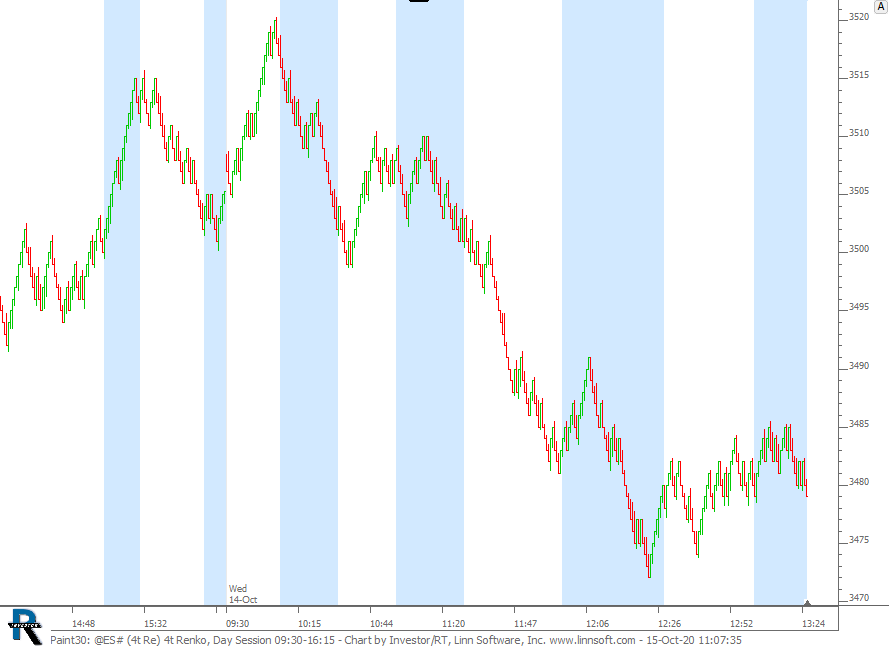 |
Paint30 (@ES#) cpayne [totalcount]
5 years 9 months ago
Paint the background of each 30 minute period with the Paint Bar indicator. This chart was uploaded by Investor/RT 14.2.1 showing symbol: @ES#. |
View |
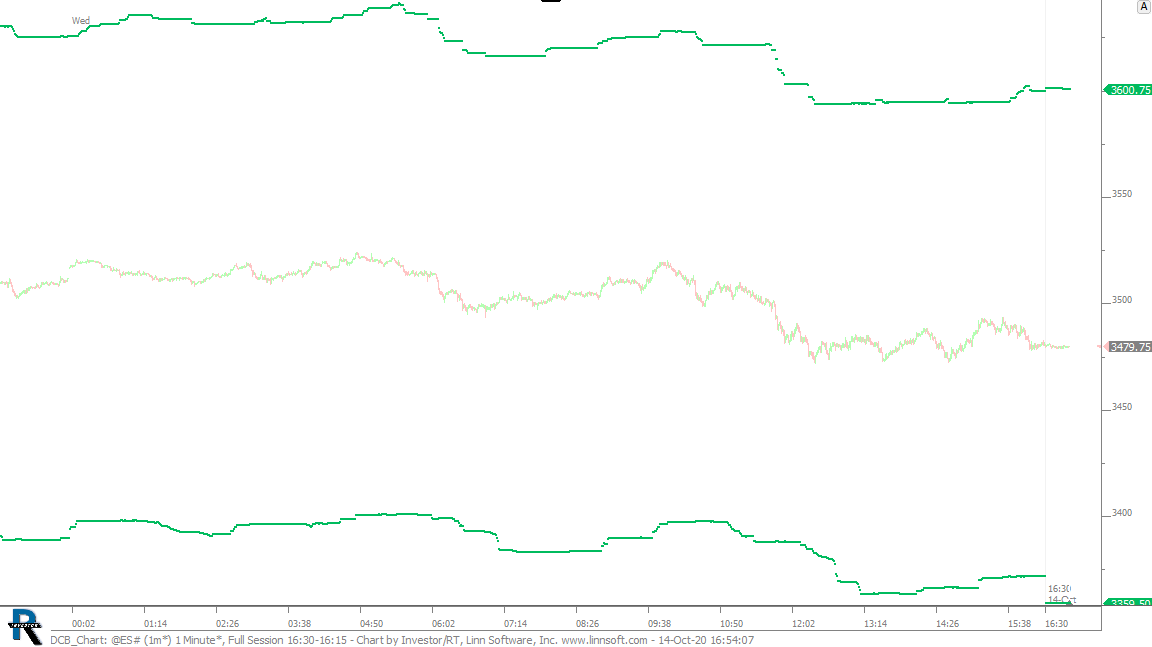 |
DCB Chart (@ES#) cpayne [totalcount]
5 years 9 months ago
This chart was uploaded by Investor/RT 14.2.1 showing symbol: @ES#. |
View |
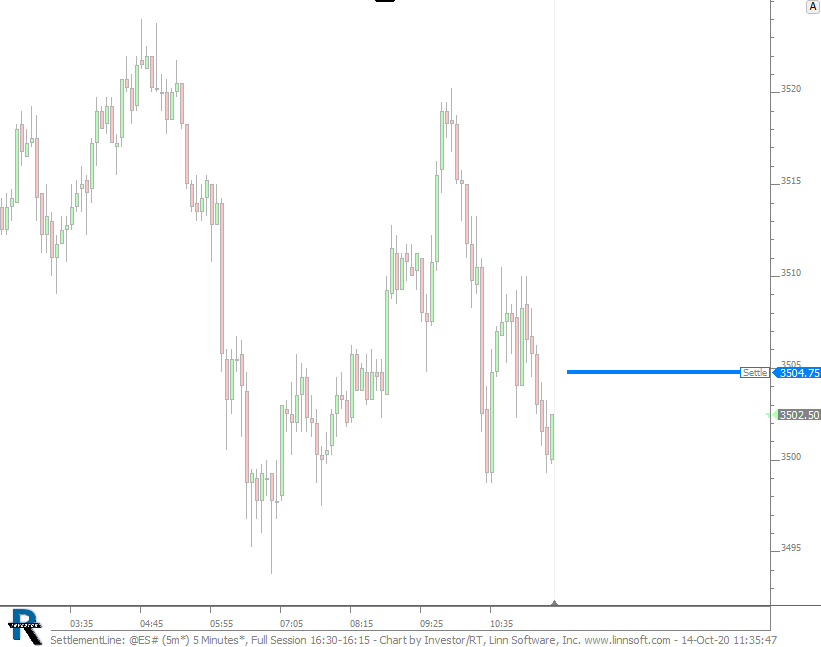 |
SettlementLine (@ES#) cpayne [totalcount]
5 years 9 months ago
Settlement Line. This chart was uploaded by Investor/RT 14.2.1 showing symbol: @ES#. |
View |
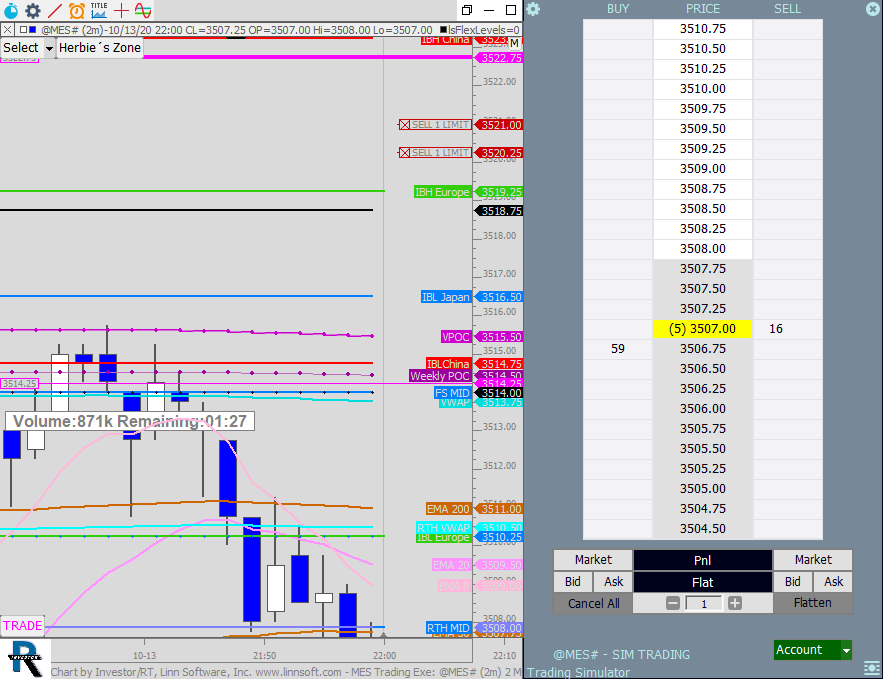 |
MES Trading Exe (@MES#) Herbert Ritsch [totalcount]
5 years 9 months ago
Hello this is the chart where I plotted the IB Europe, got this pane form FT71 best regards, herbert PS: I am sending the other chart in a seperate email. |
View |
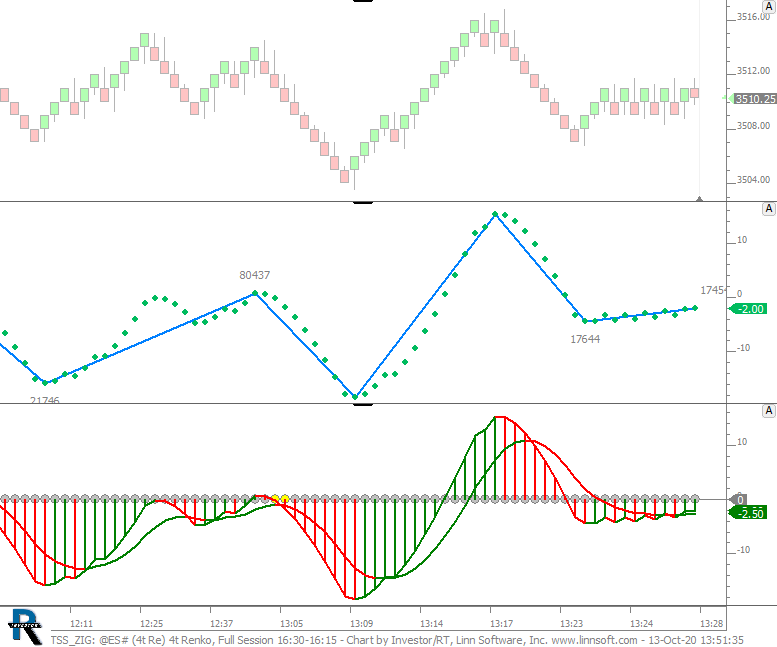 |
TSS ZIG (@ES#) cpayne [totalcount]
5 years 9 months ago
This chart was uploaded by Investor/RT 14.2.1 showing symbol: @ES#. |
View |
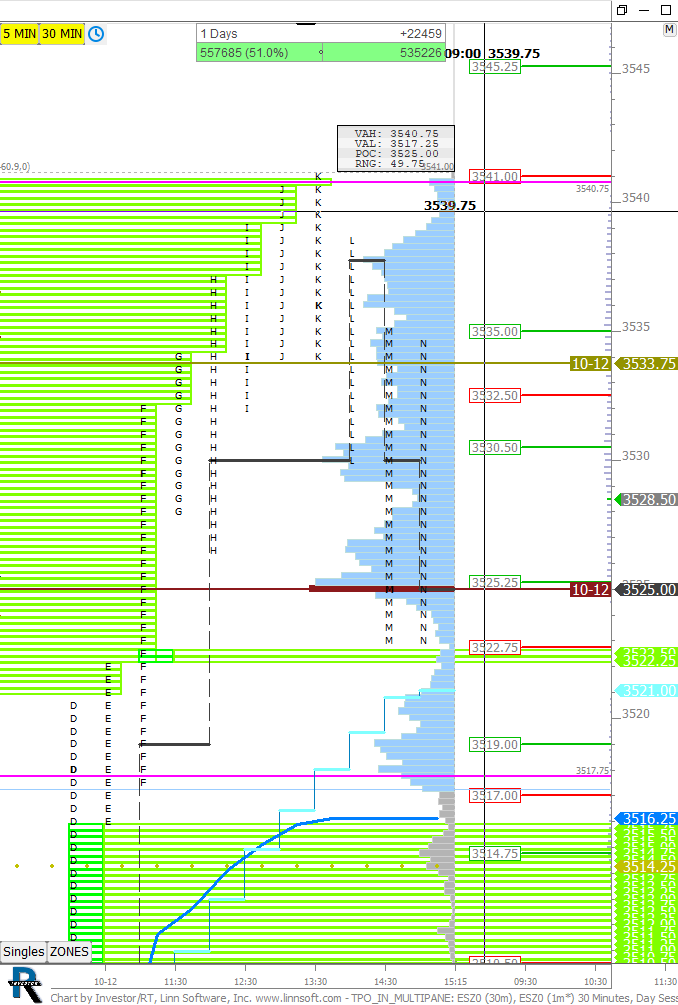 |
TPO IN MULTIPANE (ESZ0) scottz46 [totalcount]
5 years 9 months ago
This chart was uploaded by Investor/RT 14.2.1 showing symbol: ESZ0. |
View |
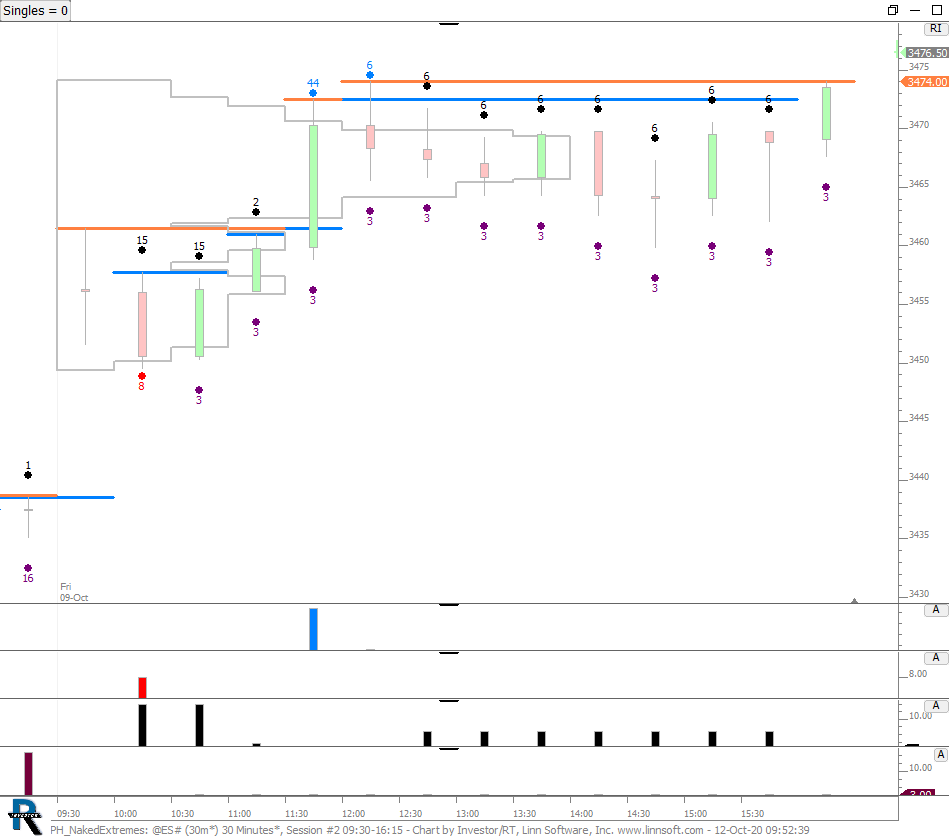 |
PH NakedExtremes (@ES#) cpayne [totalcount]
5 years 9 months ago
High Singles Alerts and Counts. This chart was uploaded by Investor/RT 14.2.1 showing symbol: @ES#. |
View |
 |
5 DAY TPO Profiles (@ES#) ES42 [totalcount]
5 years 9 months ago
Weekly Profiles, 30 min. candles. This chart was uploaded by Investor/RT 14.2.1 showing symbol: @ES#. |
View |
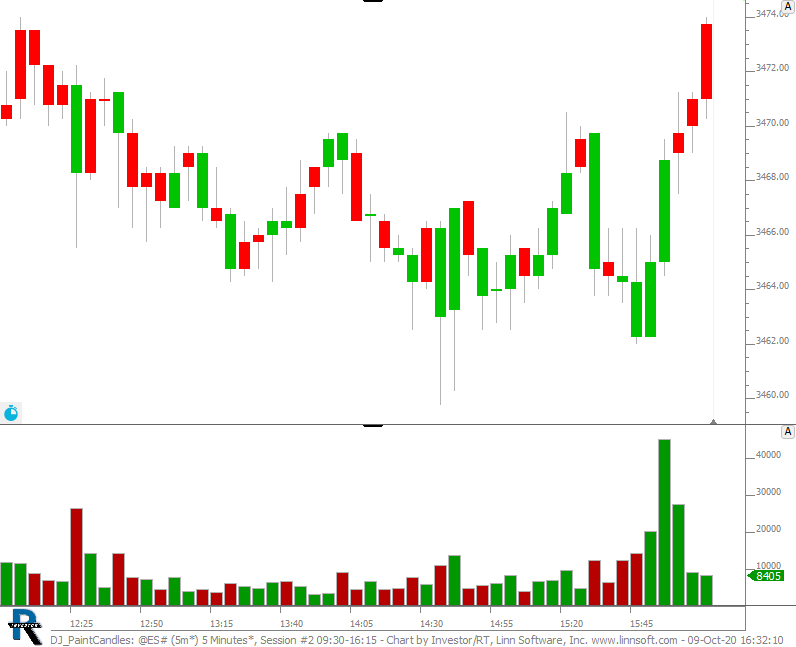 |
DJ PaintCandles (@ES#) cpayne [totalcount]
5 years 9 months ago
Volume painted based on whether the bar closed up or down. Bars pained based on whether volume is up or down. |
View |
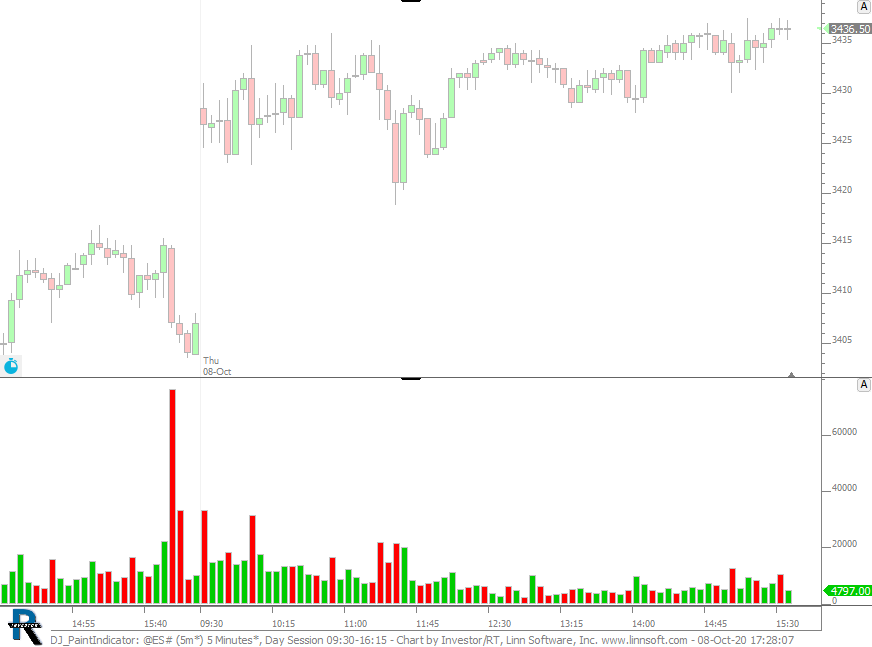 |
DJ PaintIndicator (@ES#) cpayne [totalcount]
5 years 9 months ago
Volume painted based on whether the bar closed up or down. This chart was uploaded by Investor/RT 14.2.1 showing symbol: @ES#. |
View |
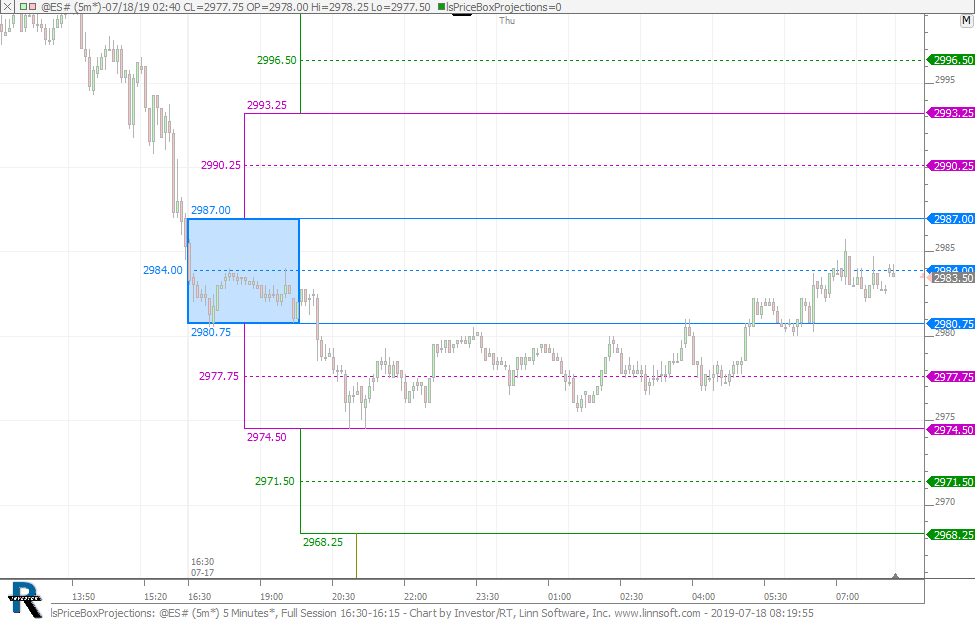 |
lsPriceBoxProjections (@ES#) cpayne [totalcount]
7 years 1 week ago
PriceBoxProjections. This chart was uploaded by Investor/RT 13.6.1 showing symbol: @ES#. |
View |
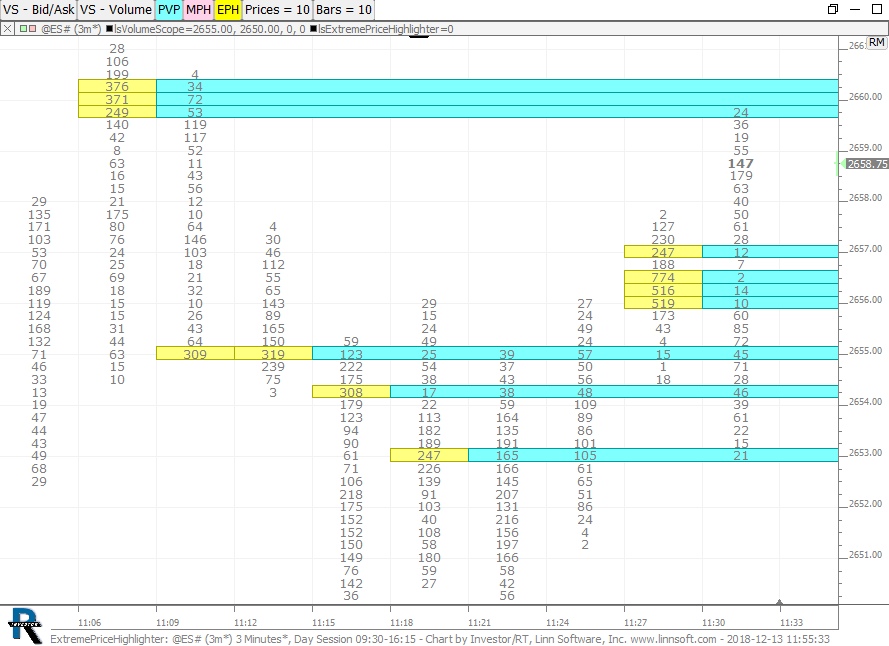 |
ExtremePriceHighlighter (@ES#) cpayne [totalcount]
7 years 7 months ago
ExtremPriceHighlighter. This chart was uploaded by Investor/RT 13.5.12 showing symbol: @ES#. |
View |
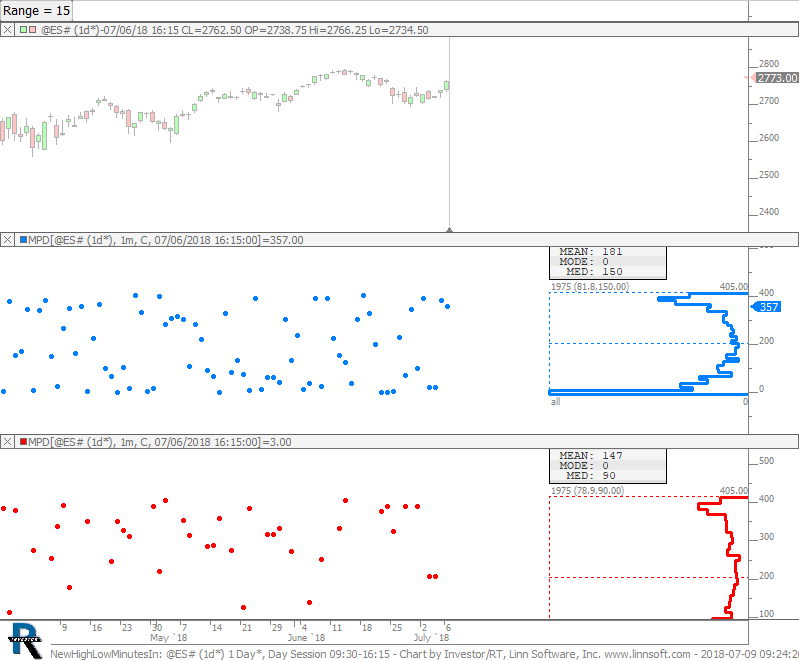 |
NewHighLowMinutesIn (@ES#) cpayne [totalcount]
8 years 3 weeks ago
Chart plots the time into session that high and low of day was made and then profiles those results to get Mode, Median, and Mean. |
View |
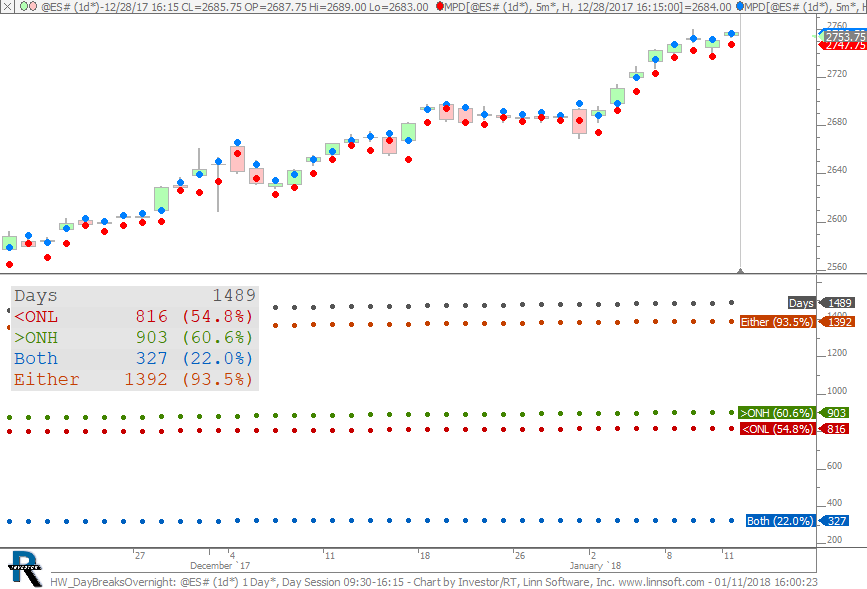 |
HW DayBreaksOvernight (@ES#) cpayne [totalcount]
8 years 6 months ago
How often is overnight high or low broken during day session. |
View |
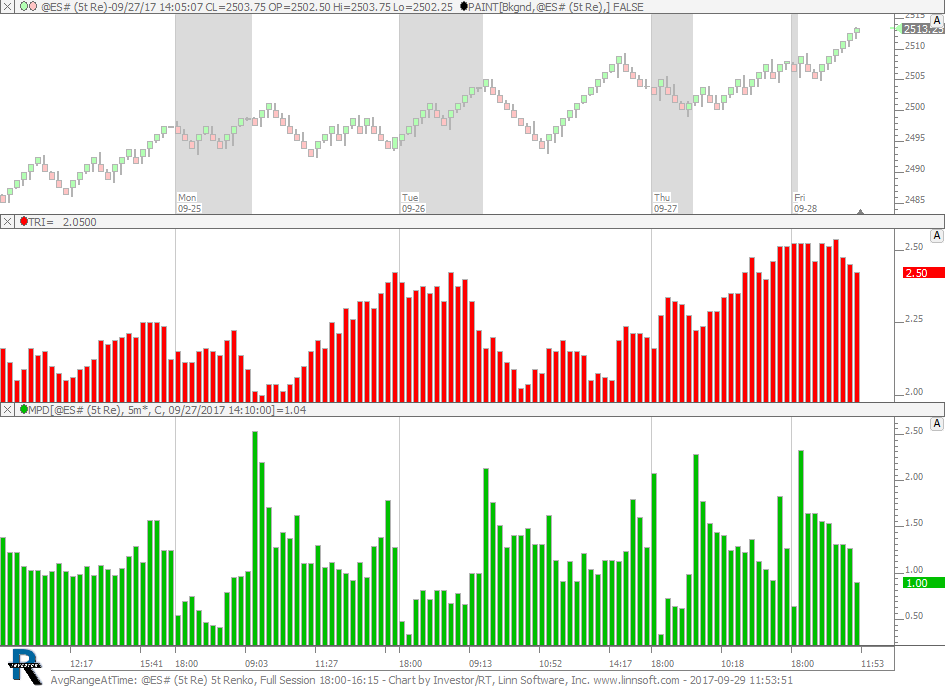 |
AvgRangeAtTime (@ES#) cpayne [totalcount]
8 years 10 months ago
Average Range at Time of Day. This chart is explained in the video Better Volatility. |
View |
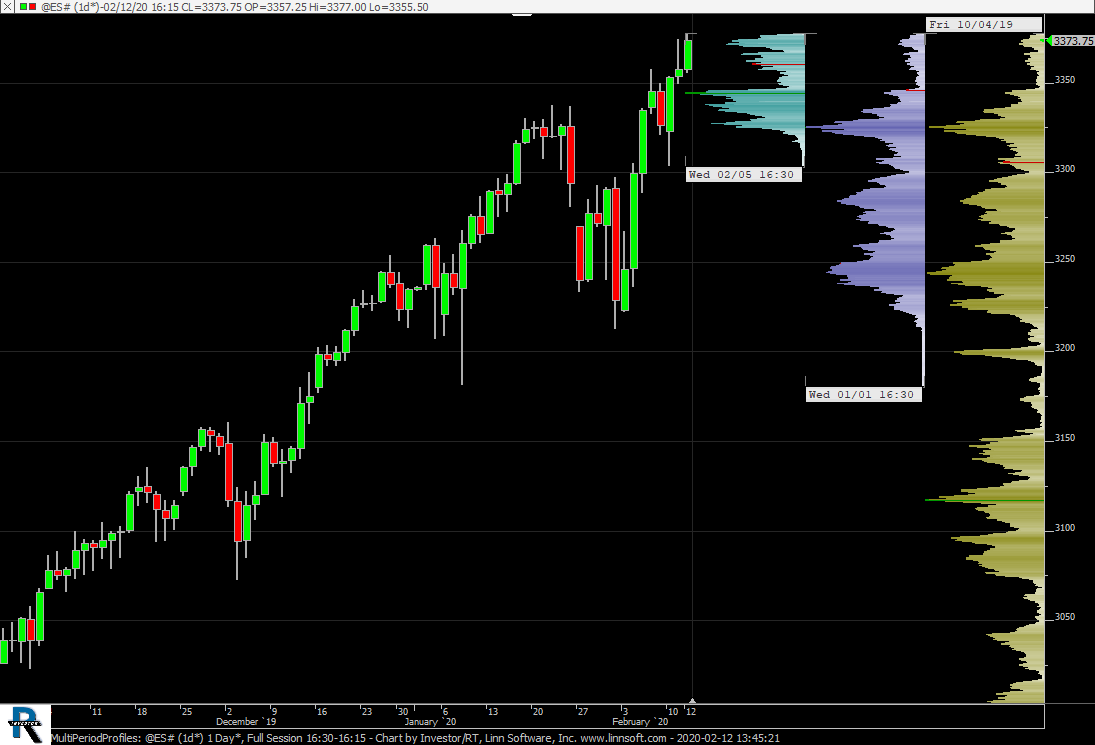 |
MultiPeriodProfiles (@ES#) cpayne [totalcount]
6 years 5 months ago
Multiple Period Overlapping Profiles. This chart is explained in the video Multiple Period Overlapping Profiles. |
View |
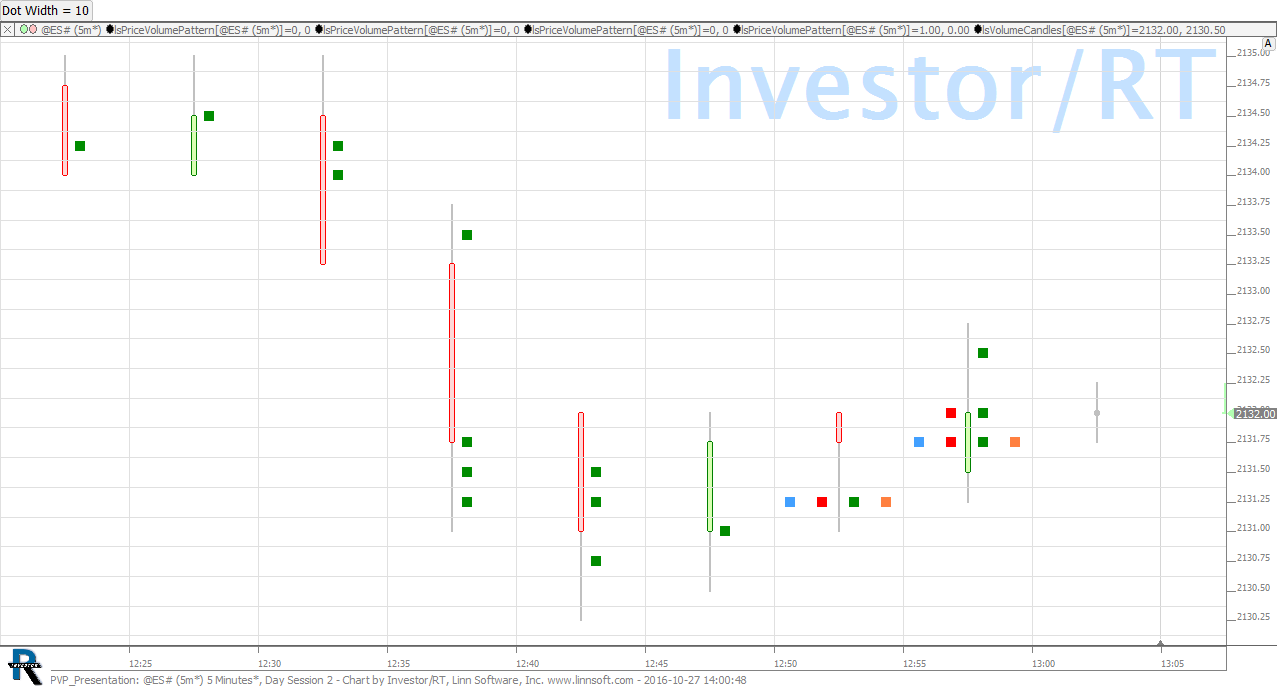 |
PVP Presentation (@ES#) cpayne [totalcount]
9 years 9 months ago
PVP Presenting New Drawing Options. |
View |