 |
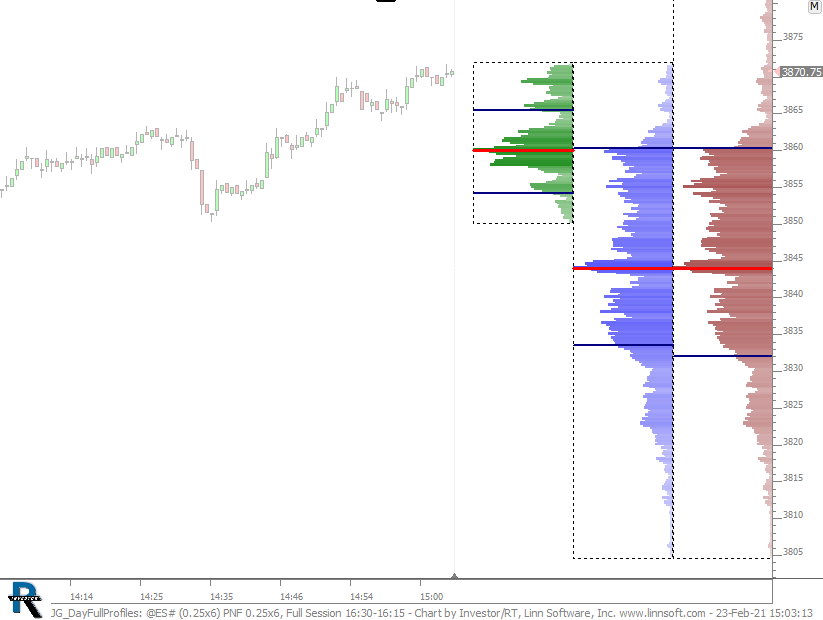
JG DayFullProfiles (@ES#) cpayne [totalcount]
5 years 5 months ago
Day and Full Session Profiles. This chart was uploaded by Investor/RT 14.2.6 showing symbol: @ES#. |
View |
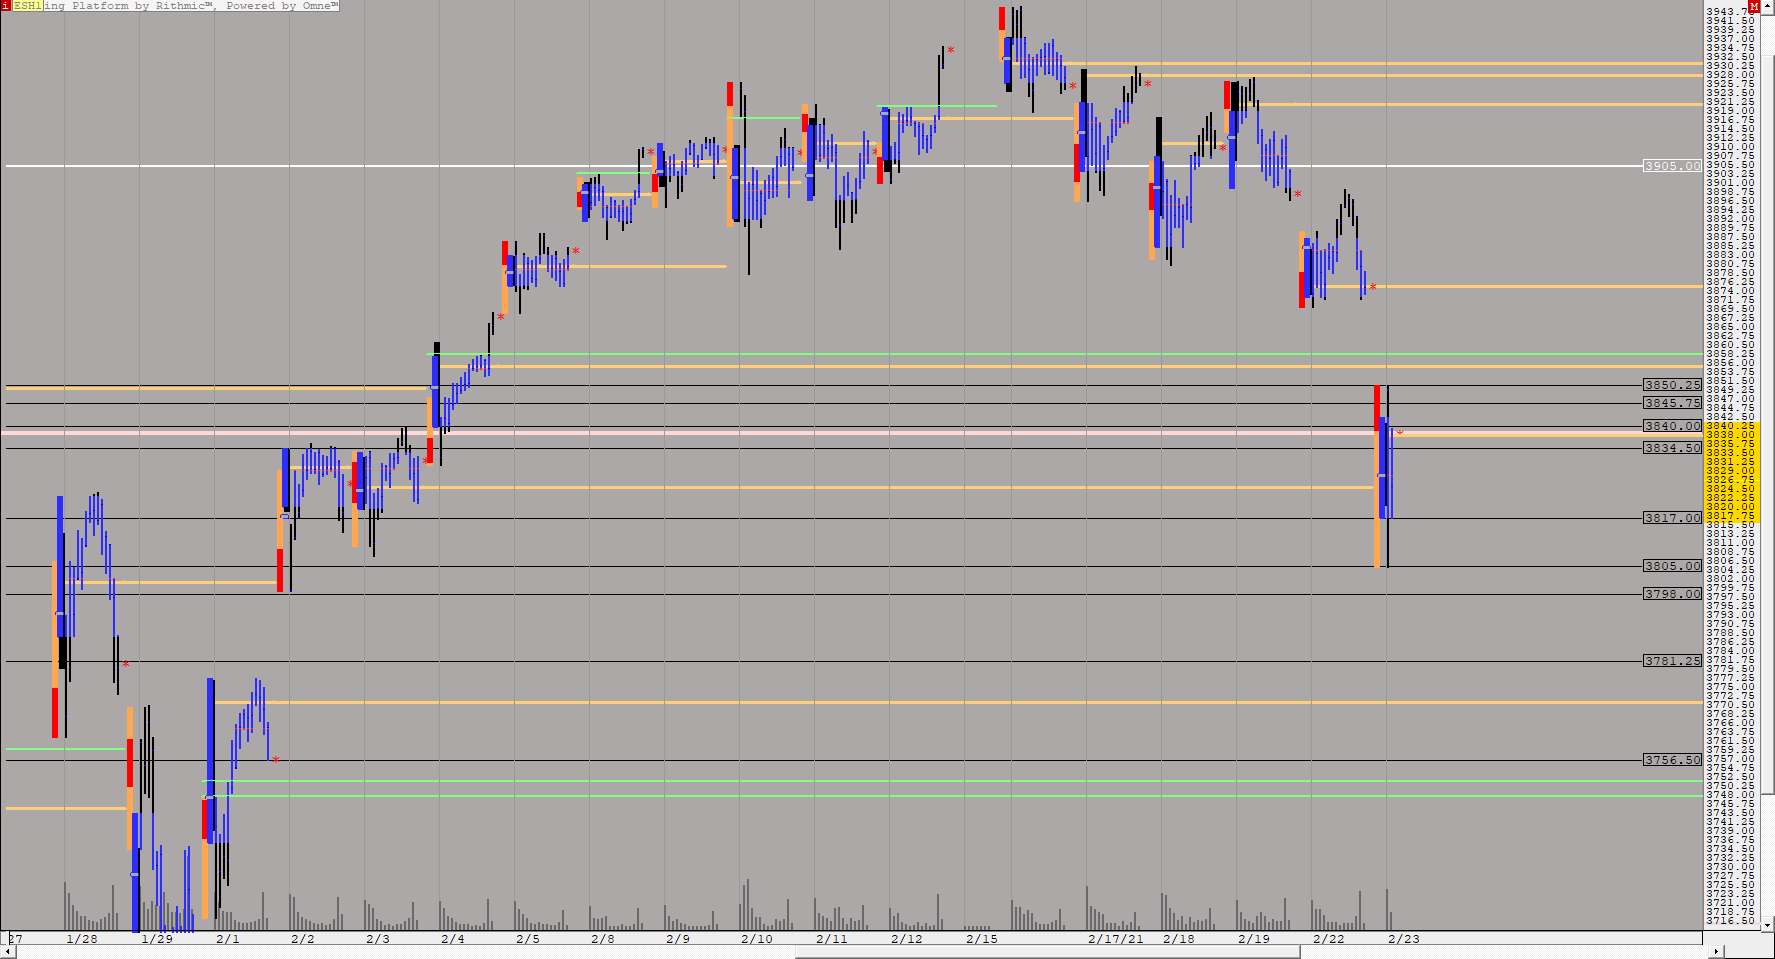 |
ESTPORTH (ESH1) ES42 [totalcount]
5 years 5 months ago
DAILY TPO, 30 MIN Candles. This chart was uploaded by Investor/RT 14.2.5 showing symbol: ESH1. |
View |
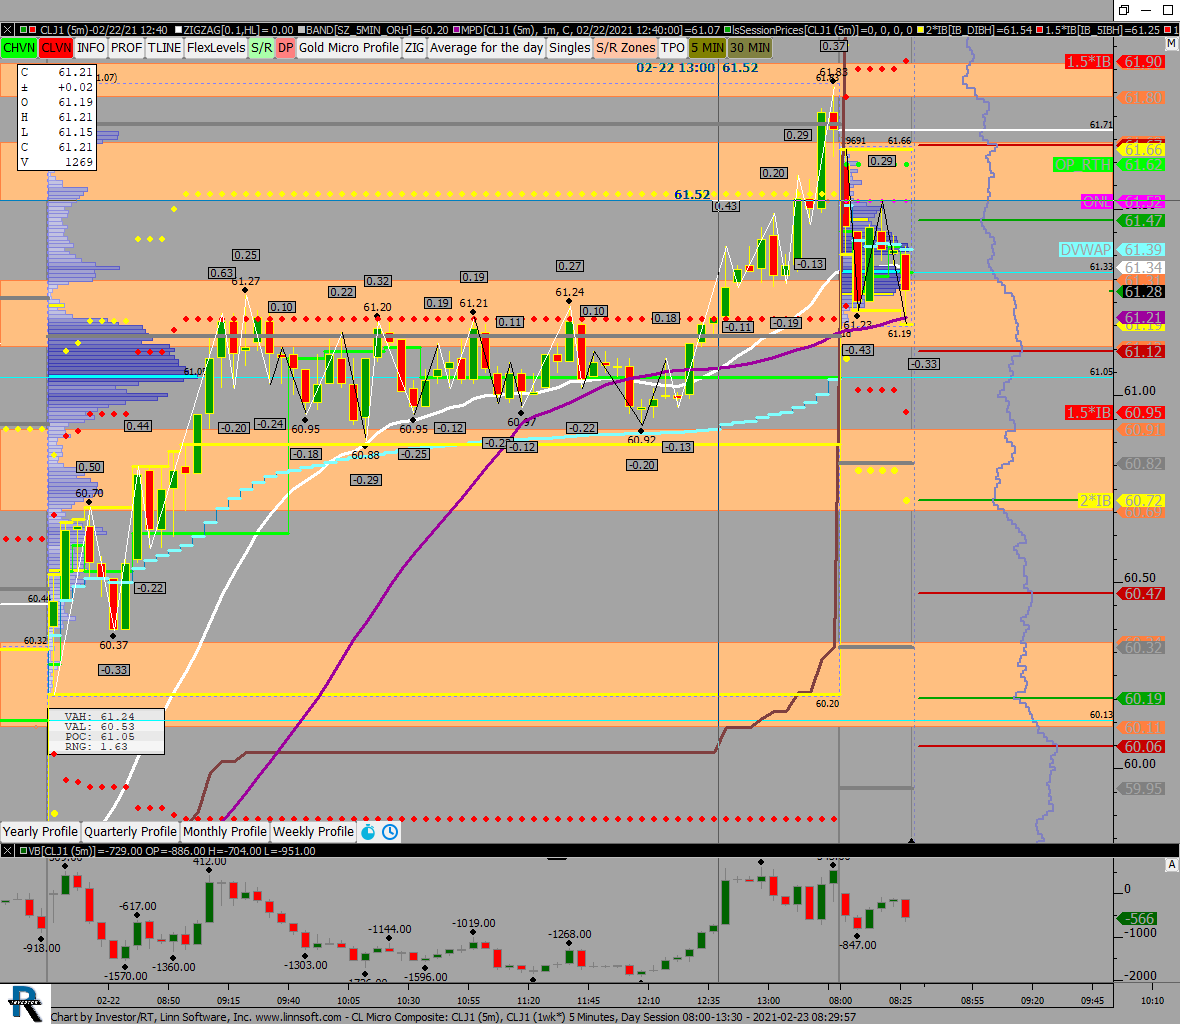 |
CL Micro Composite (CLJ1) scottz46 [totalcount]
5 years 5 months ago
This chart was uploaded by Investor/RT 14.2.5 showing symbol: CLJ1. |
View |
 |
CLTPO (CLJ1) ES42 [totalcount]
5 years 5 months ago
MONTHLY TPO, 60 MIN Cancles. This chart was uploaded by Investor/RT 14.2.5 showing symbol: CLJ1. |
View |
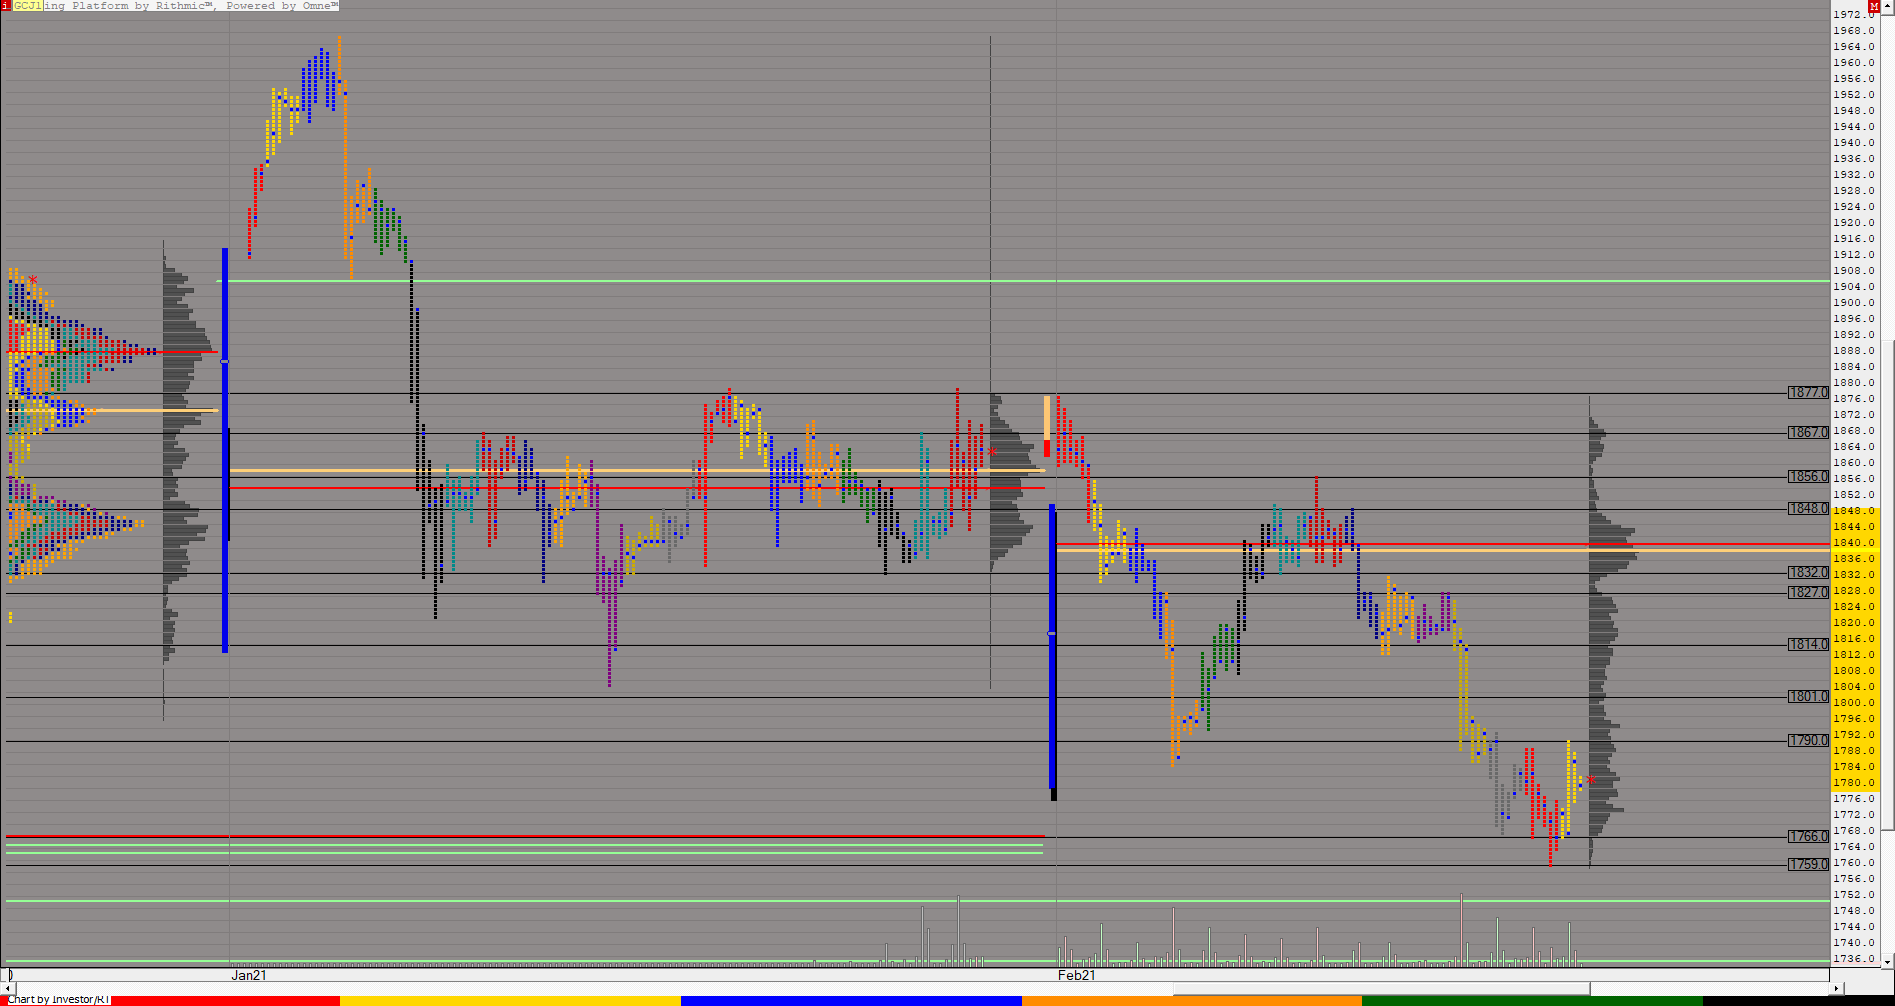 |
GCTPO MONYHLY (GCJ1) ES42 [totalcount]
5 years 5 months ago
MONTHLY TPO, 240 MIN Cancles. This chart was uploaded by Investor/RT 14.2.5 showing symbol: GCJ1. |
View |
 |
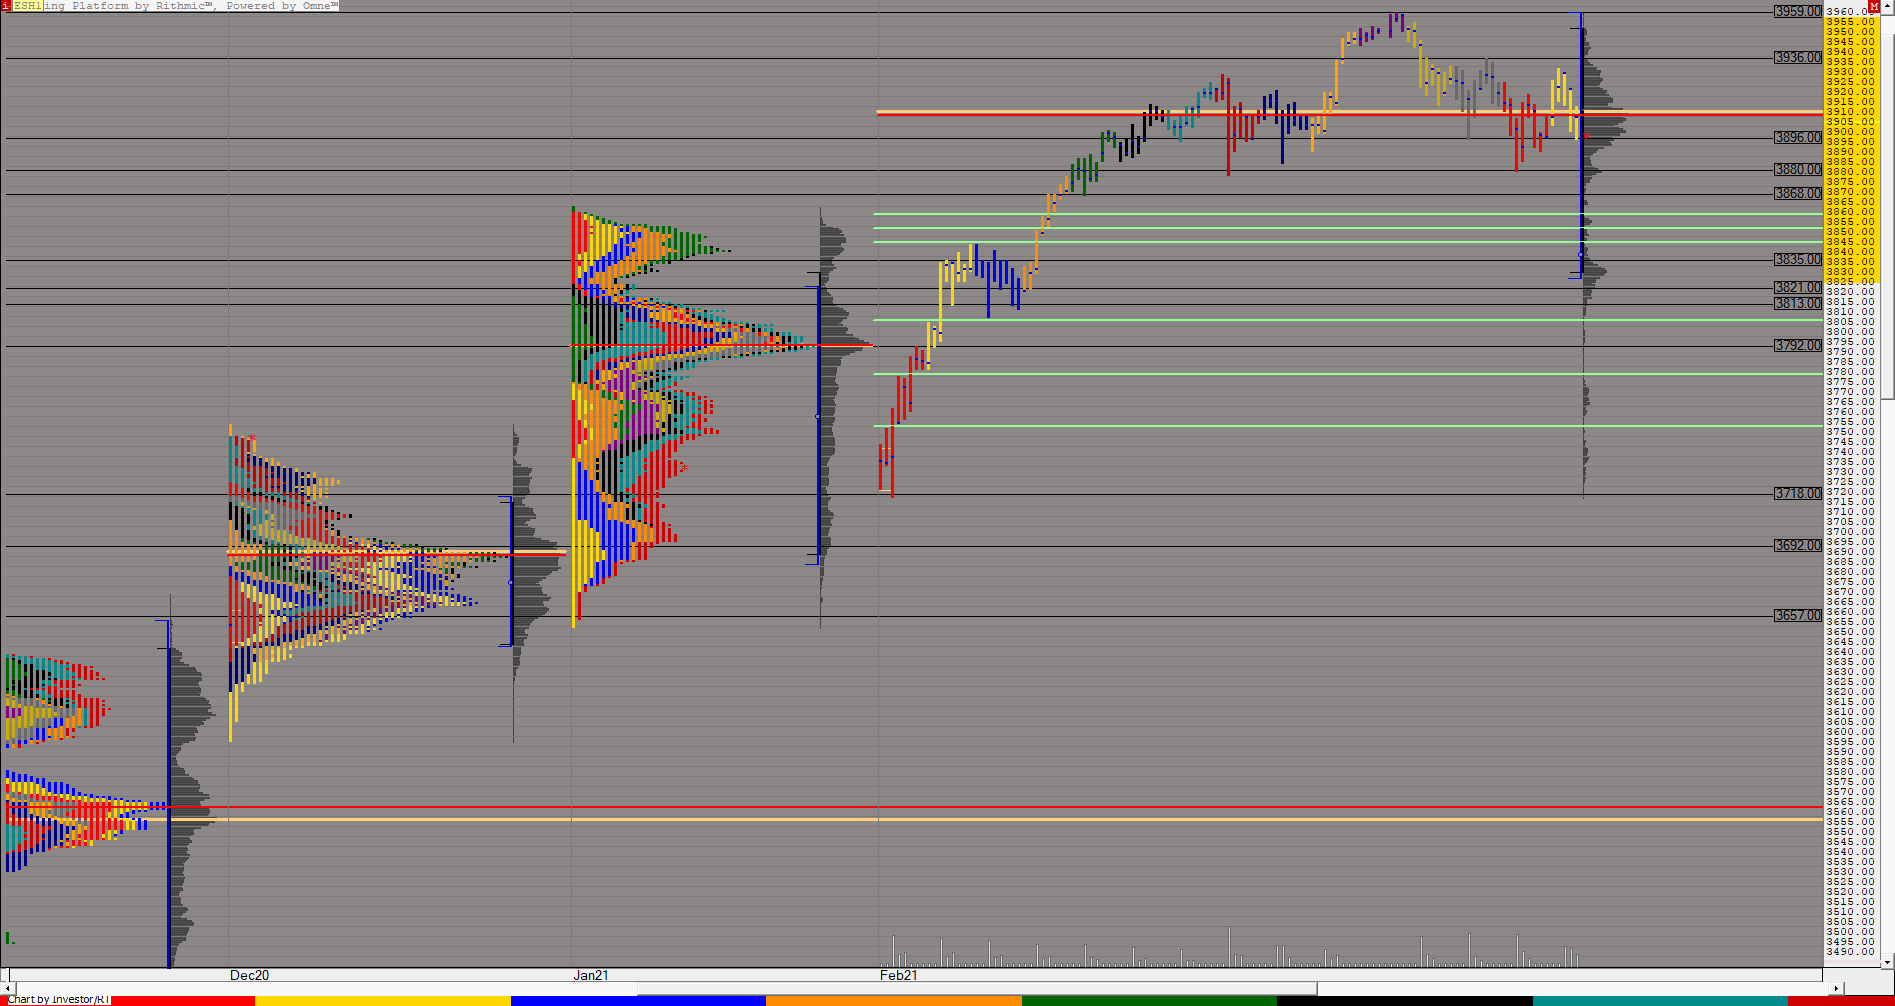
ESTPOWEEKLY (ESH1) ES42 [totalcount]
5 years 5 months ago
This chart was uploaded by Investor/RT 14.2.5 showing symbol: ESH1. |
View |
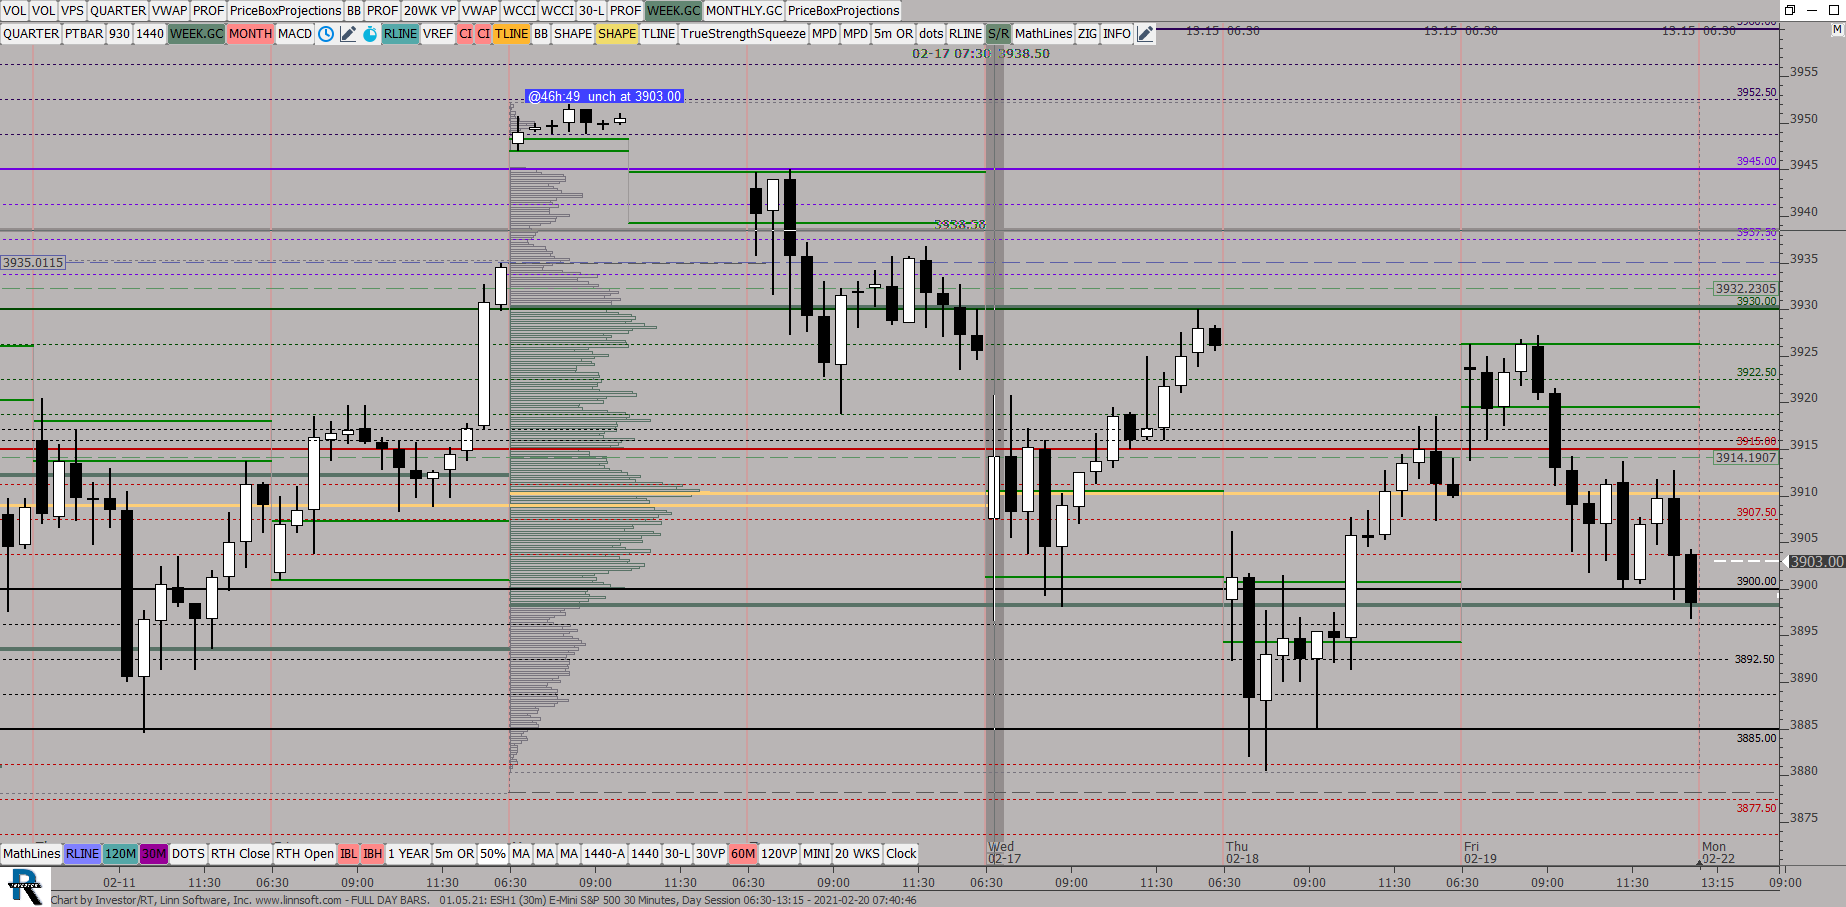 |
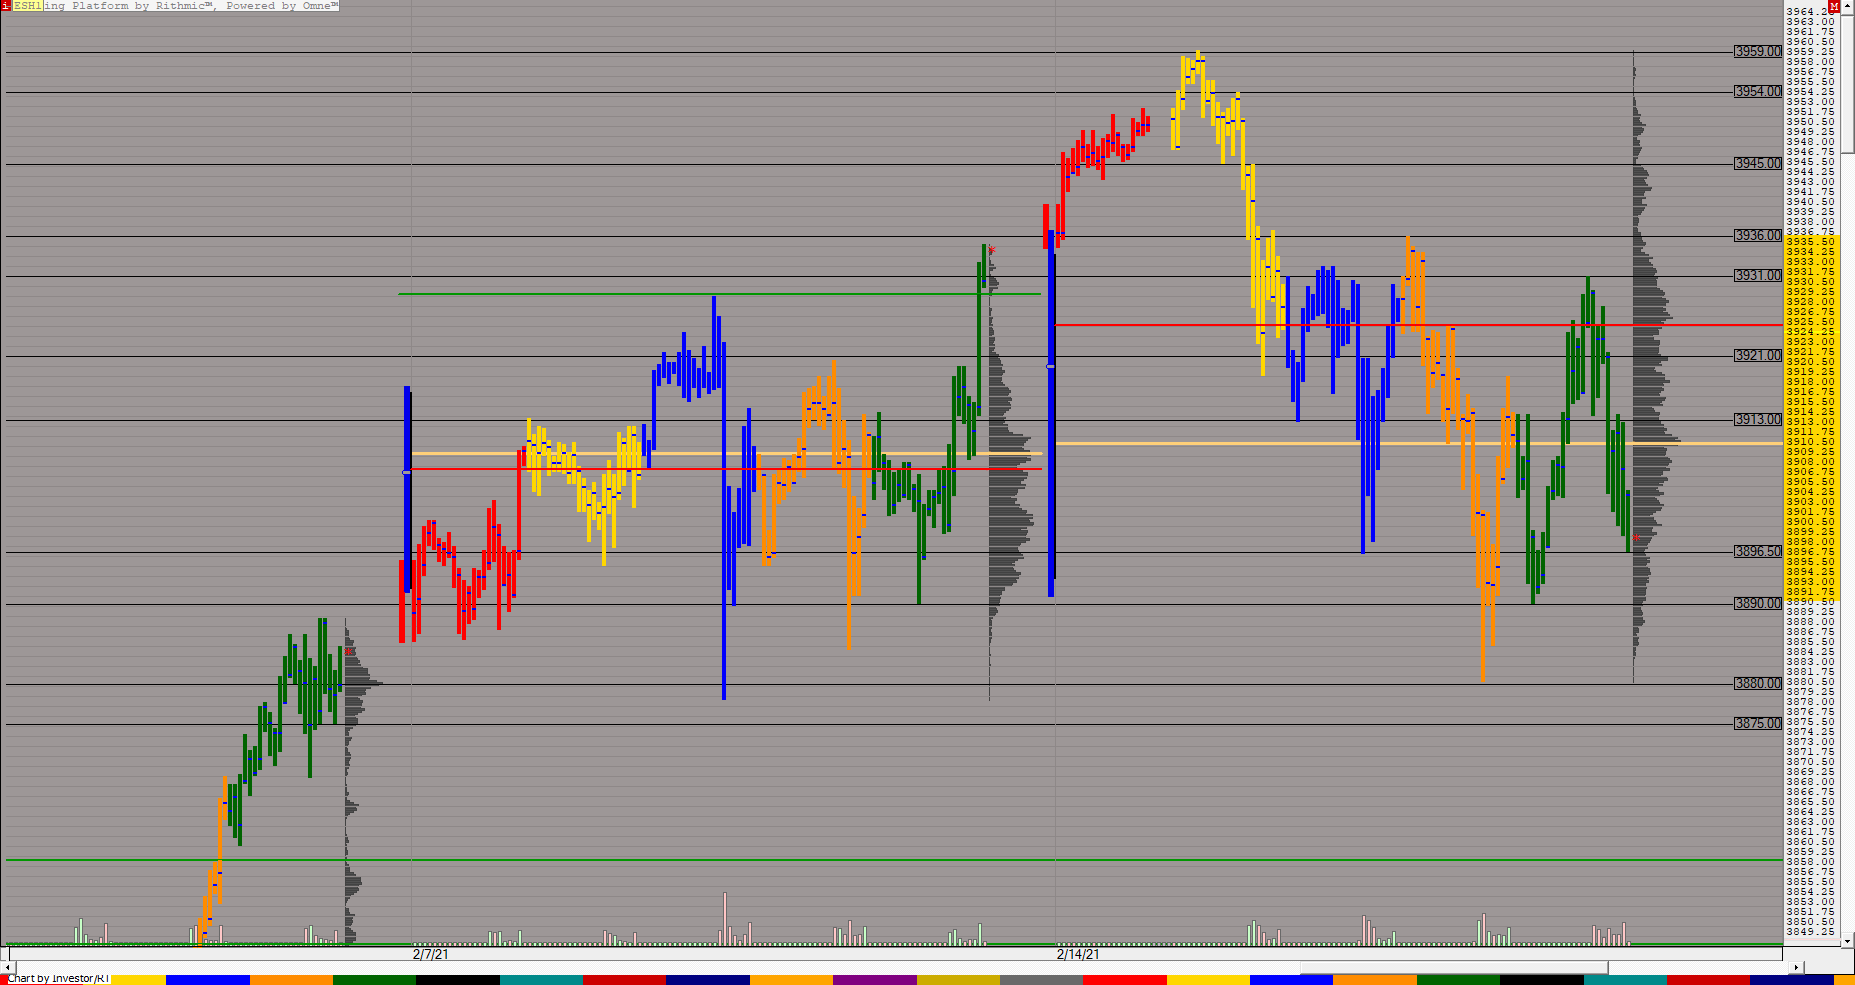
FULL DAY BARS (ESH1) ES42 [totalcount]
5 years 5 months ago
RTH, 30. This chart was uploaded by Investor/RT 14.2.5 showing symbol: ESH1. |
View |
 |
ESTPOMONTHLYb (ESH1) ES42 [totalcount]
5 years 5 months ago
Monyhly TPO, 180 MIN Candles. This chart was uploaded by Investor/RT 14.2.5 showing symbol: ESH1. |
View |
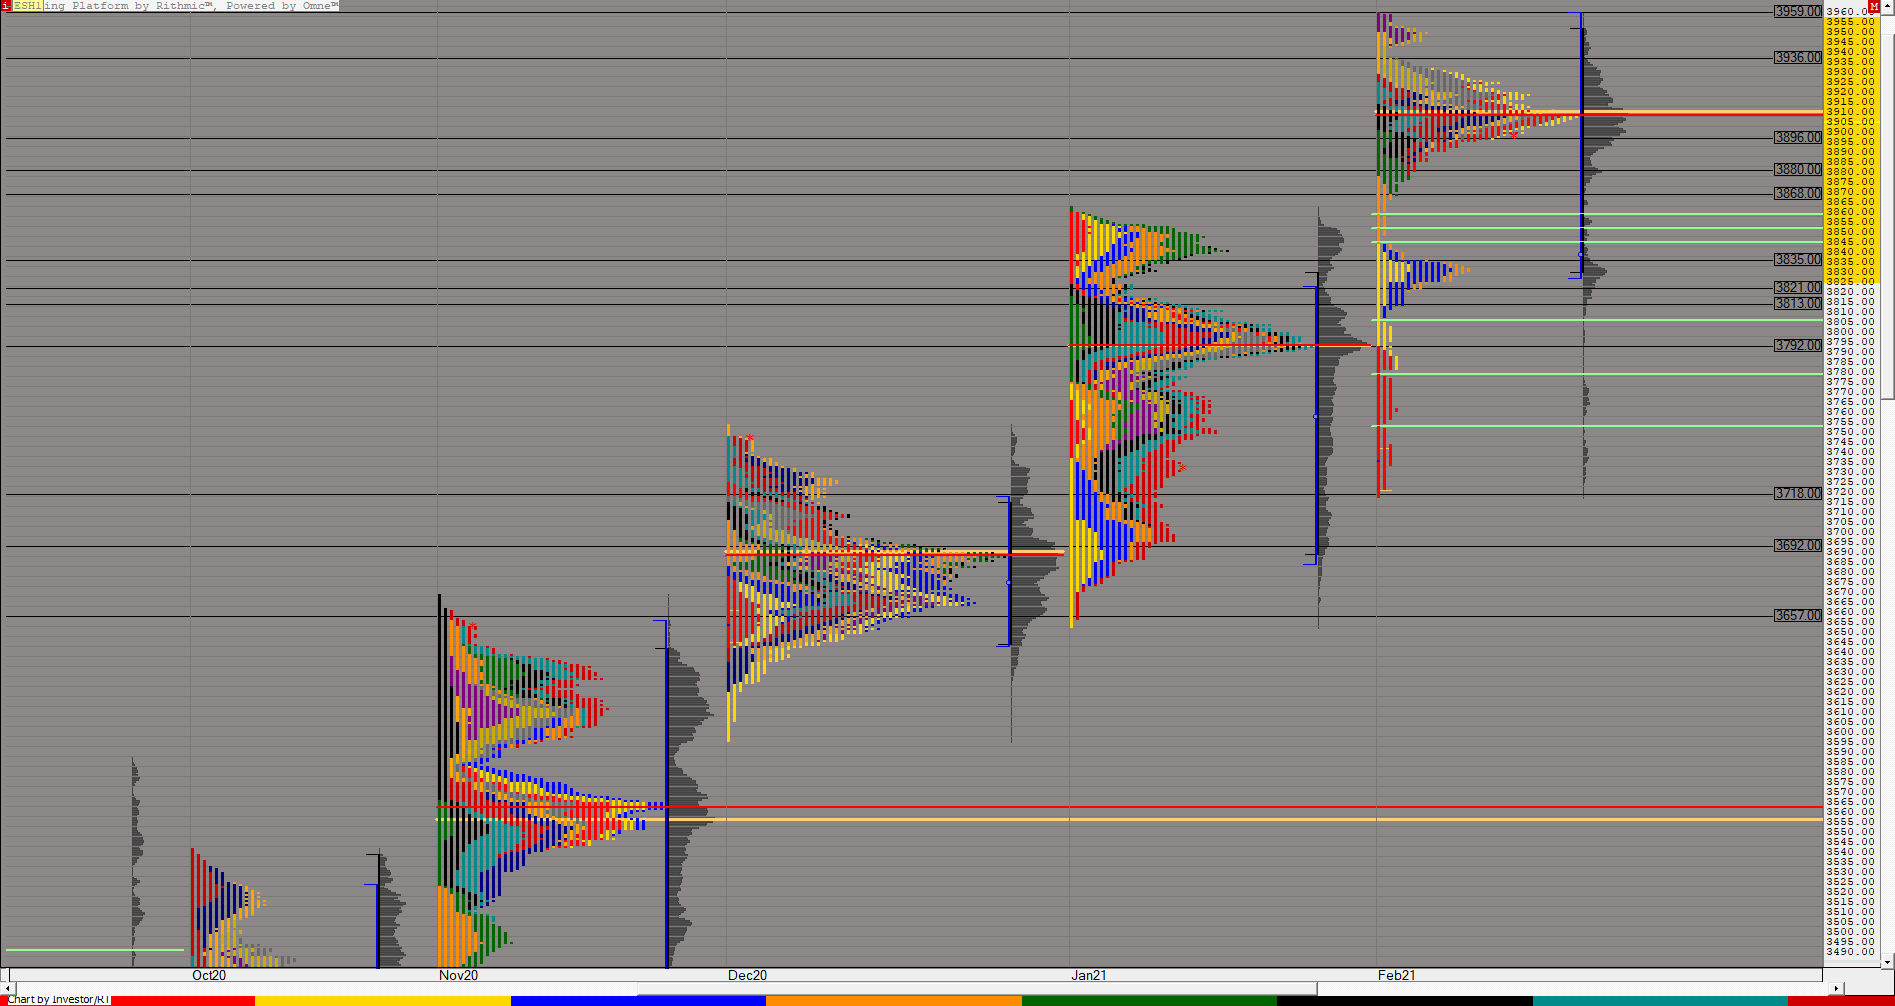 |
ESTPOMONTHLYa (ESH1) ES42 [totalcount]
5 years 5 months ago
Monyhly TPO, 180 MIN Candles. This chart was uploaded by Investor/RT 14.2.5 showing symbol: ESH1. |
View |
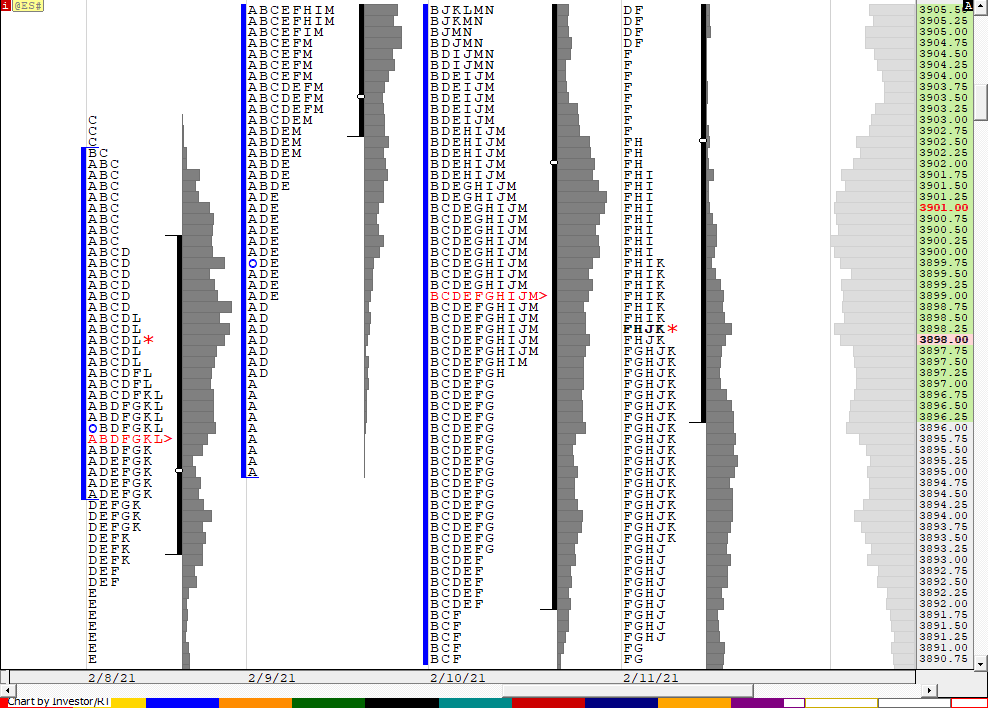 |
CD MarketProfile (@ES#) cpayne [totalcount]
5 years 5 months ago
Market Profile with Volume. This chart was uploaded by Investor/RT 14.2.6 showing symbol: @ES#. |
View |
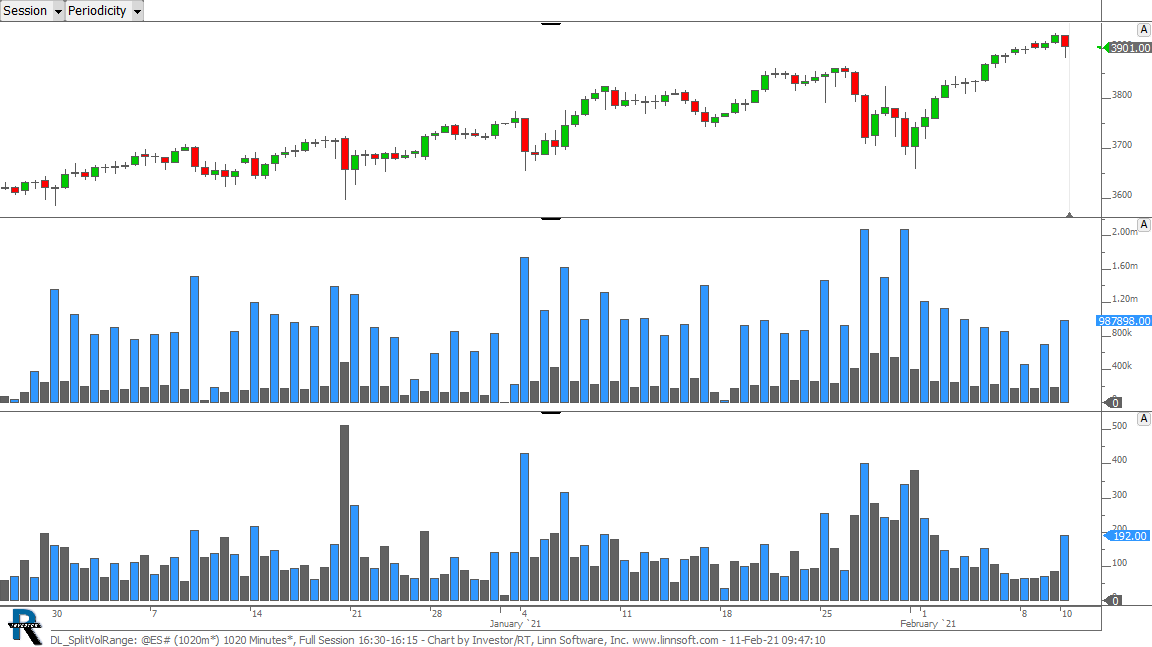 |
DL SplitVolRange (@ES#) cpayne [totalcount]
5 years 5 months ago
Day Session vs ON Session Volume and Range. This chart was uploaded by Investor/RT 14.2.6 showing symbol: @ES#. |
View |
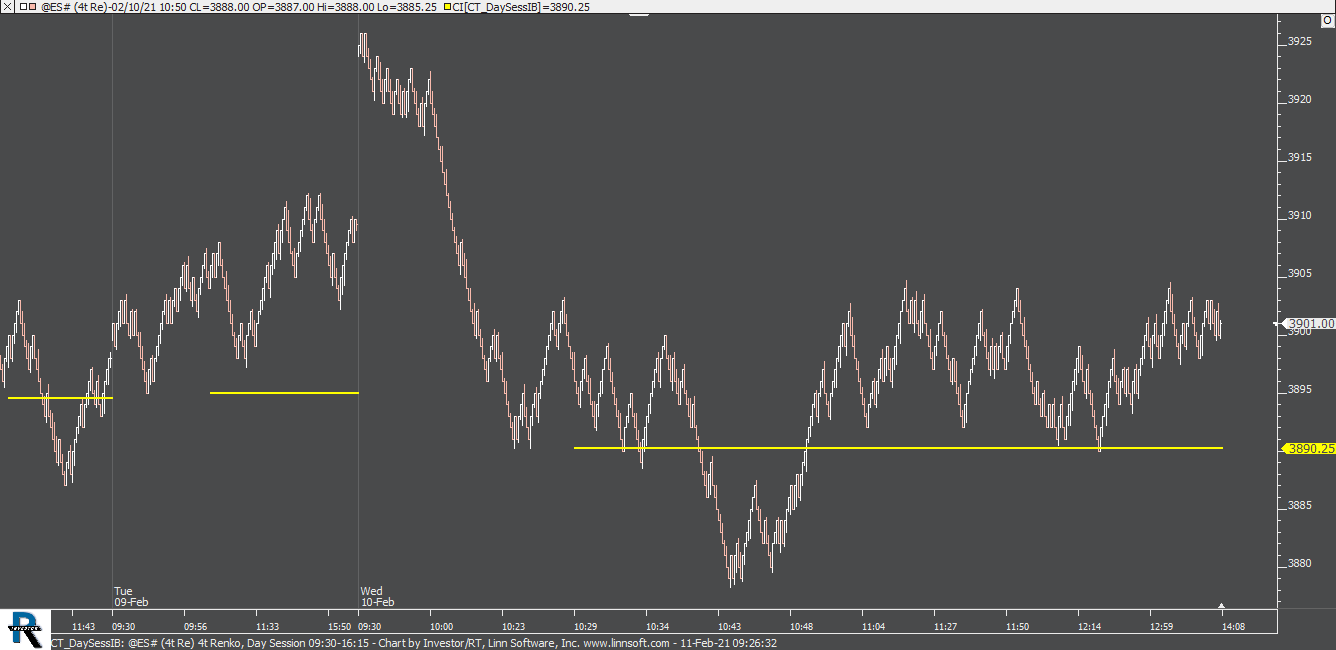 |
CT DaySessIB (@ES#) cpayne [totalcount]
5 years 5 months ago
This chart was uploaded by Investor/RT 14.2.6 showing symbol: @ES#. |
View |
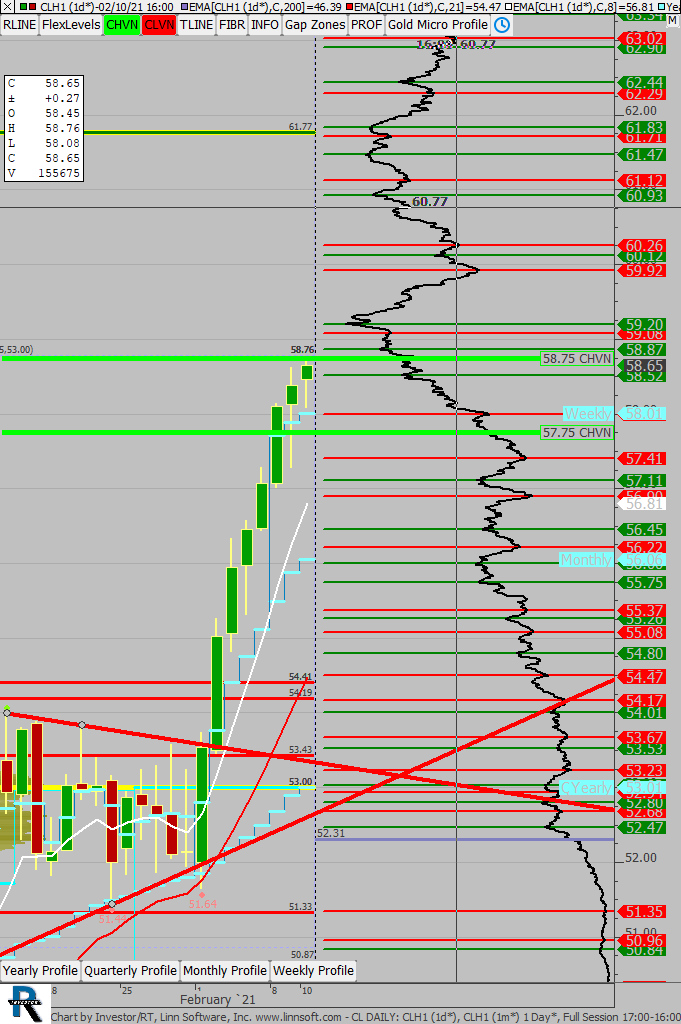 |
CL DAILY (CLH1) scottz46 [totalcount]
5 years 5 months ago
This chart was uploaded by Investor/RT 14.2.5 showing symbol: CLH1. |
View |
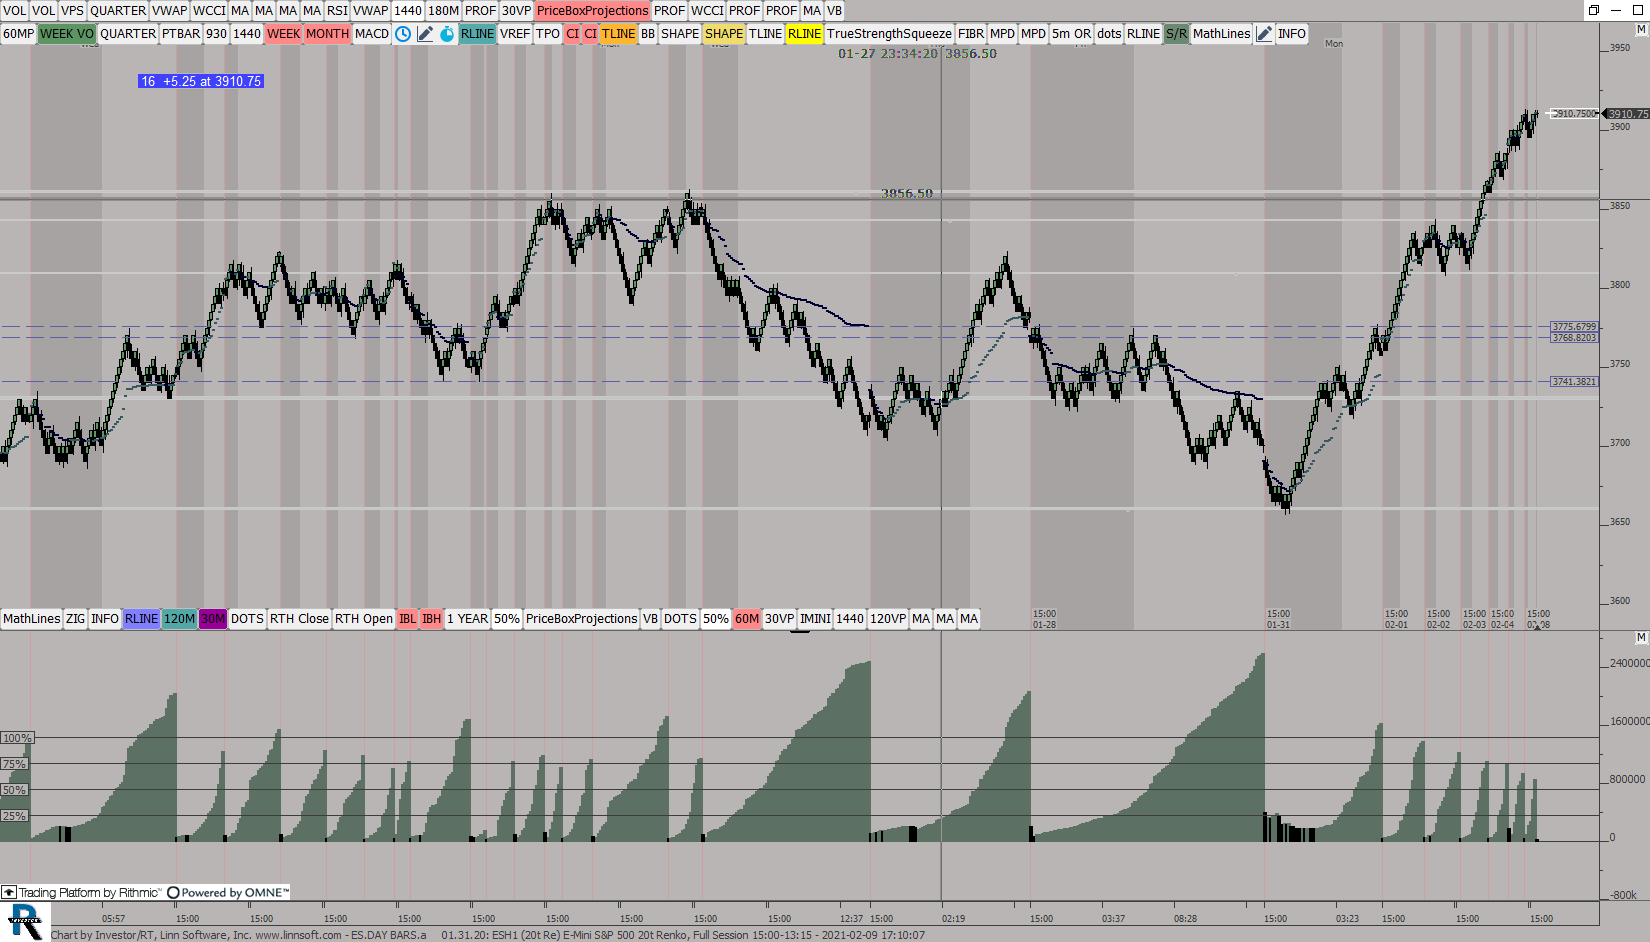 |
ESDAY BARSa (ESH1) ES42 [totalcount]
5 years 5 months ago
This chart was uploaded by Investor/RT 14.2.5 showing symbol: ESH1. |
View |
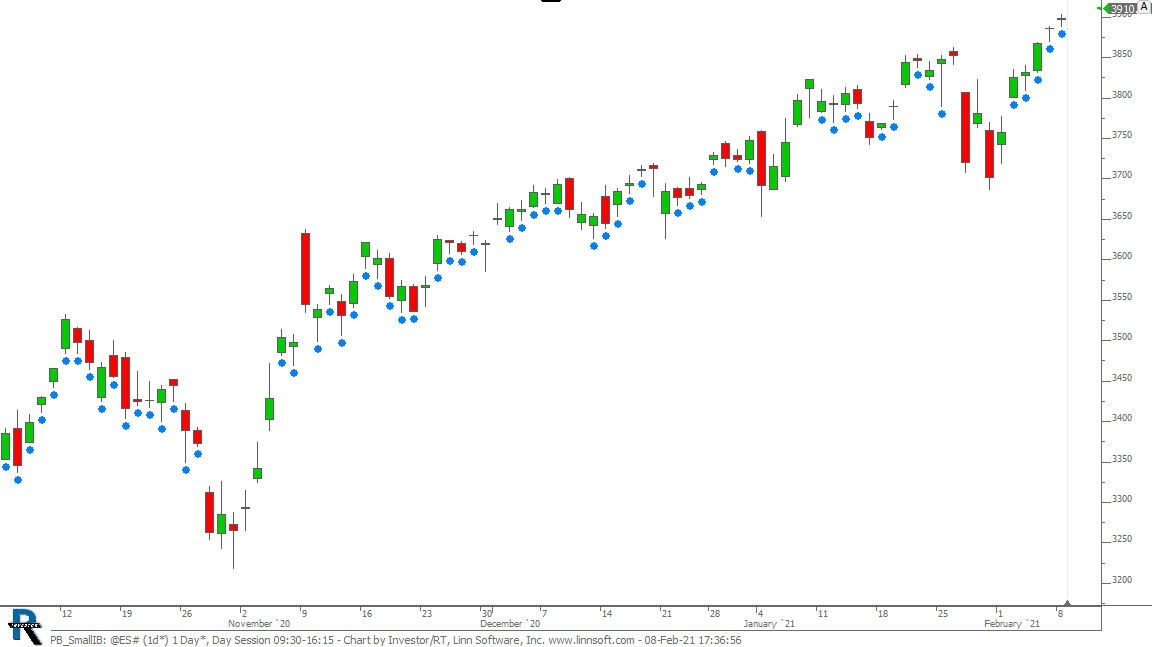 |
PB SmallIB (@ES#) cpayne [totalcount]
5 years 5 months ago
This chart was uploaded by Investor/RT 14.2.6 showing symbol: @ES#. |
View |
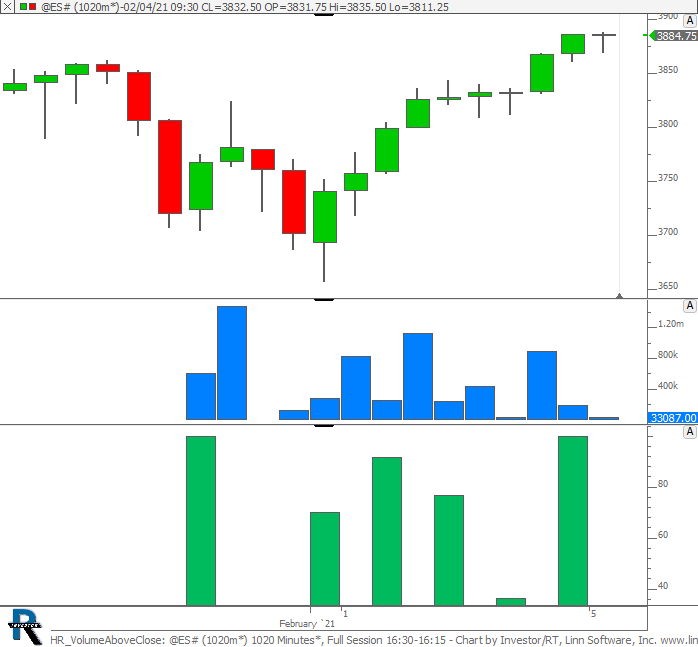 |
HR VolumeAboveClose (@ES#) cpayne [totalcount]
5 years 5 months ago
This chart was uploaded by Investor/RT 14.2.6 showing symbol: @ES#. |
View |
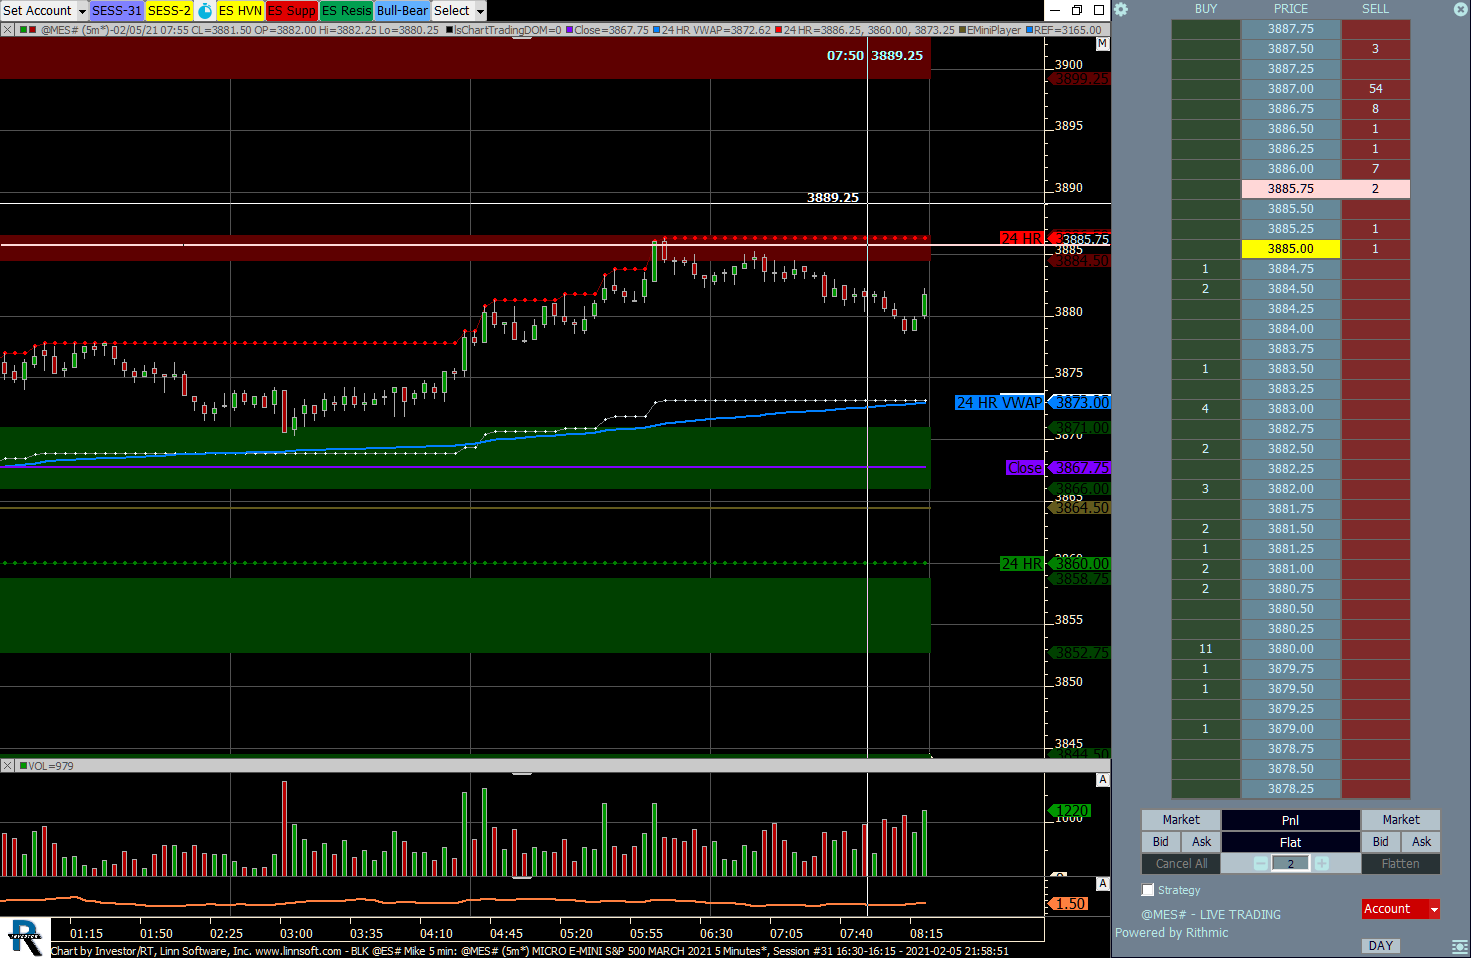 |
BLK ES Mike 5 min (@MES#) Robert Wilkins [totalcount]
5 years 5 months ago
This chart was uploaded by Investor/RT 14.2.5 showing symbol: @MES#. |
View |
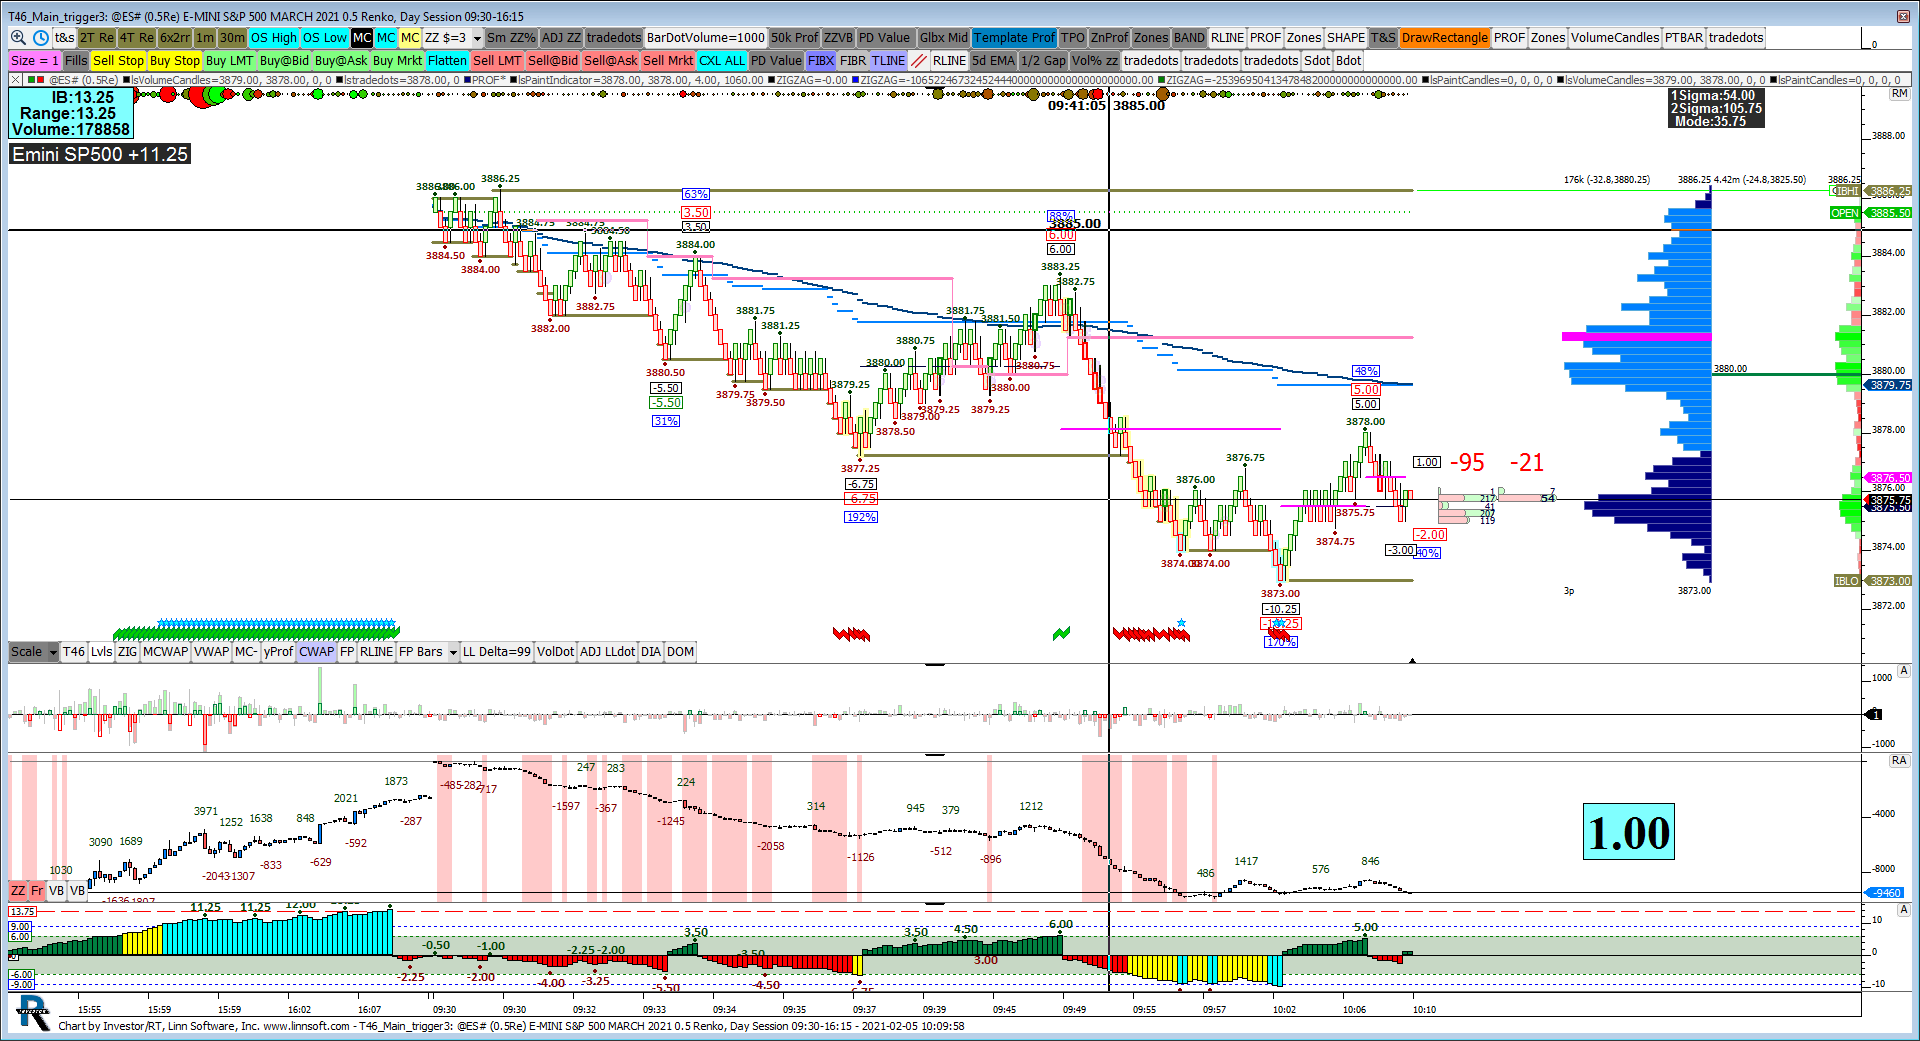 |
T46 Main trigger (@ES#) jayski51369 [totalcount]
5 years 5 months ago
This chart was uploaded by Investor/RT 13.6.8 showing symbol: @ES#. |
View |
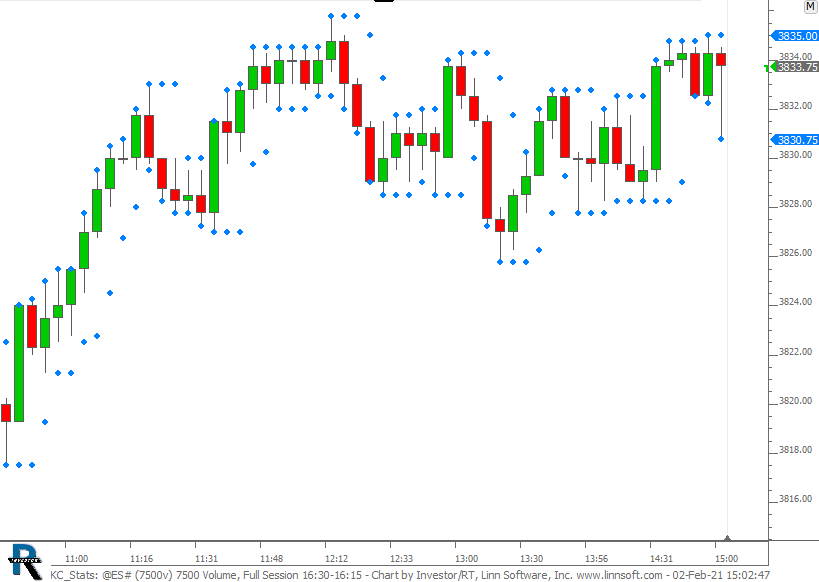 |
KC Stats (@ES#) cpayne [totalcount]
5 years 5 months ago
This chart was uploaded by Investor/RT 14.2.6 showing symbol: @ES#. |
View |
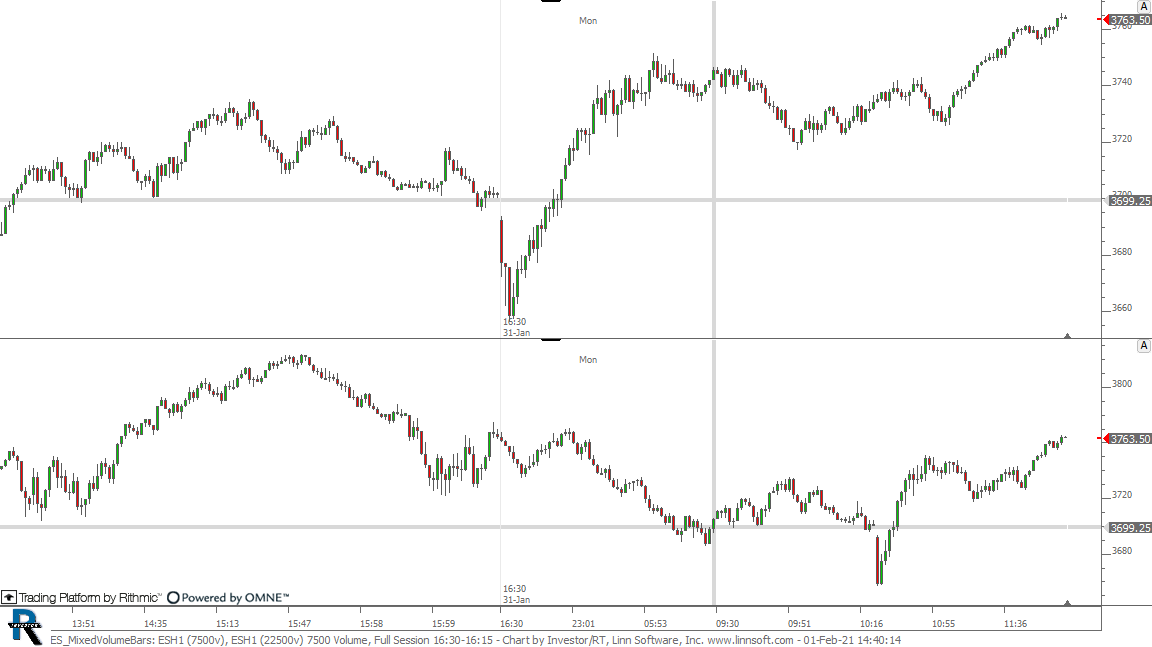 |
ES MixedVolumeBars (ESH1) cpayne [totalcount]
5 years 5 months ago
This chart was uploaded by Investor/RT 14.2.6 showing symbol: ESH1. |
View |
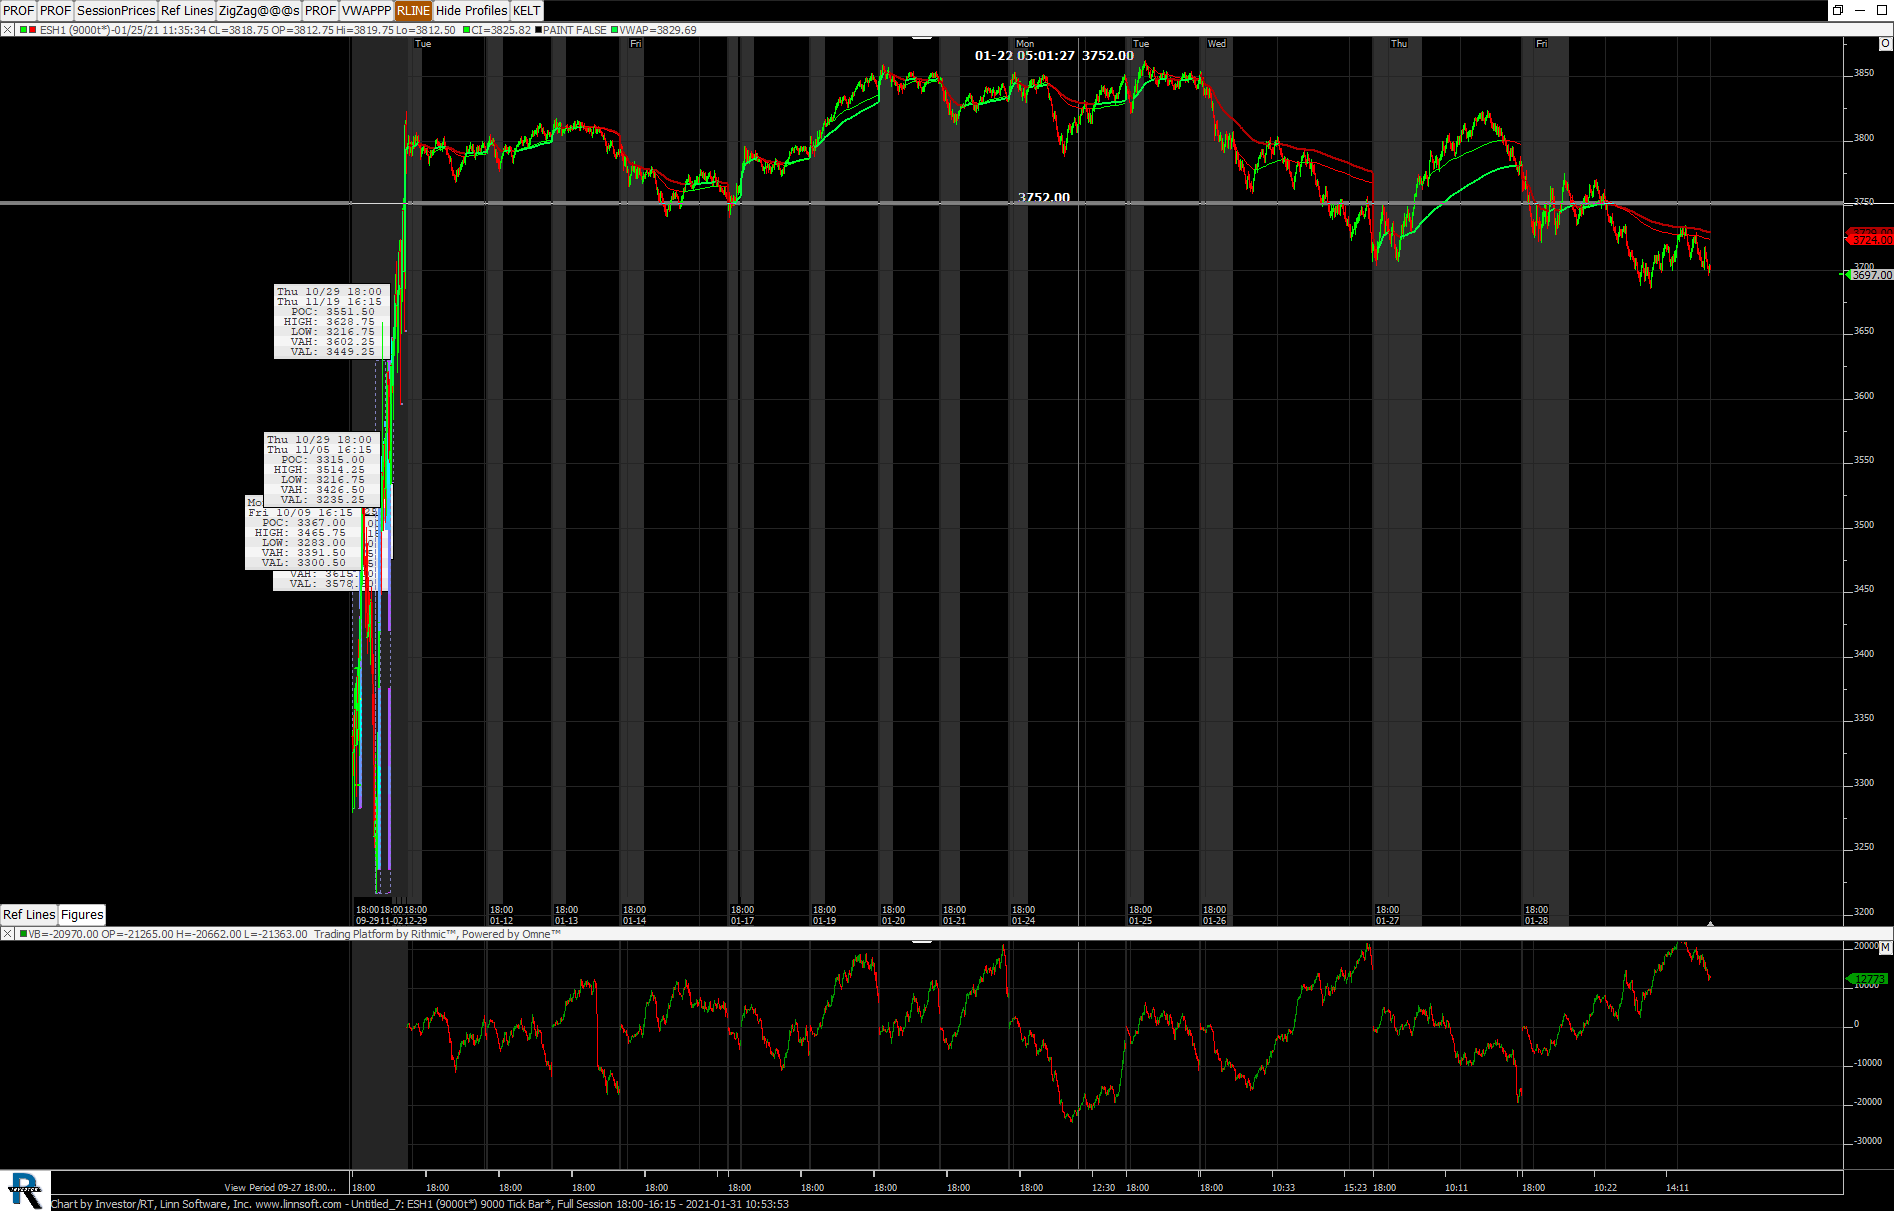 |
Untitled 7 (ESH1) David Lieberman [totalcount]
5 years 6 months ago
This chart was uploaded by Investor/RT 14.2.5 showing symbol: ESH1. |
View |
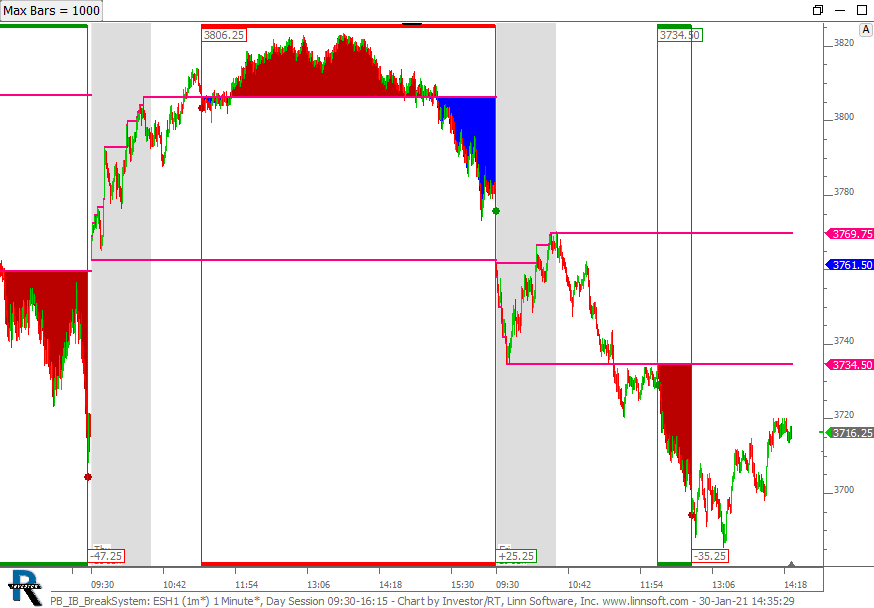 |
PB IB BreakSystem (ESH1) cpayne [totalcount]
5 years 6 months ago
This chart was uploaded by Investor/RT 14.2.6 showing symbol: ESH1. |
View |
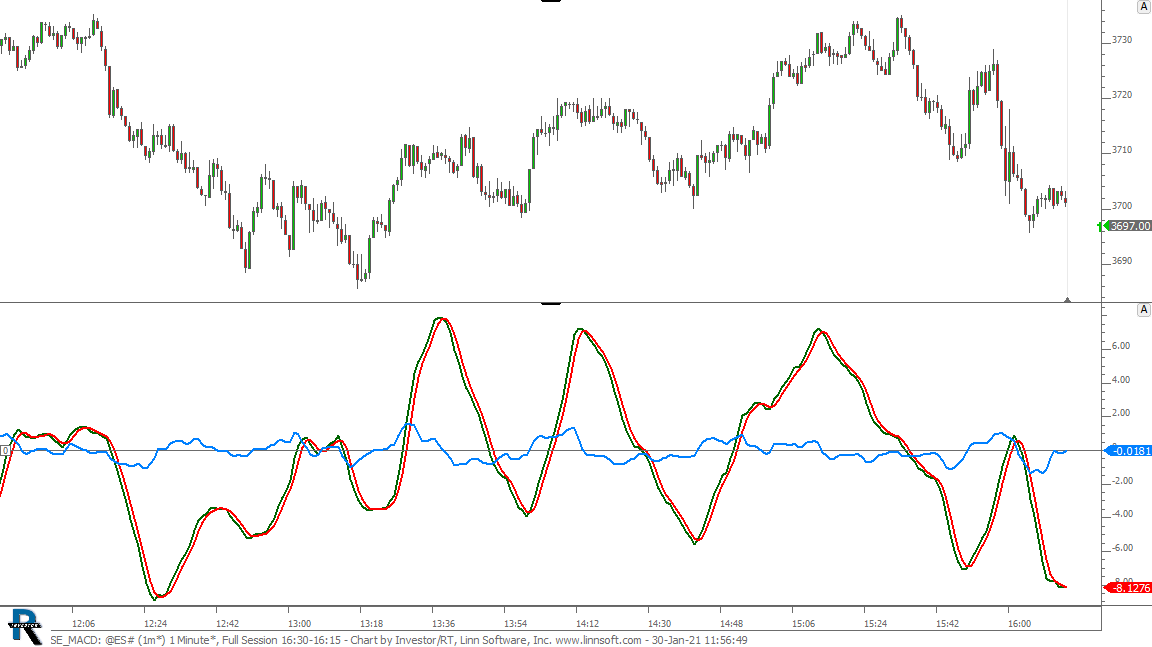 |
SE MACD (@ES#) cpayne [totalcount]
5 years 6 months ago
MACD with Signal. This chart was uploaded by Investor/RT 14.2.6 showing symbol: @ES#. |
View |
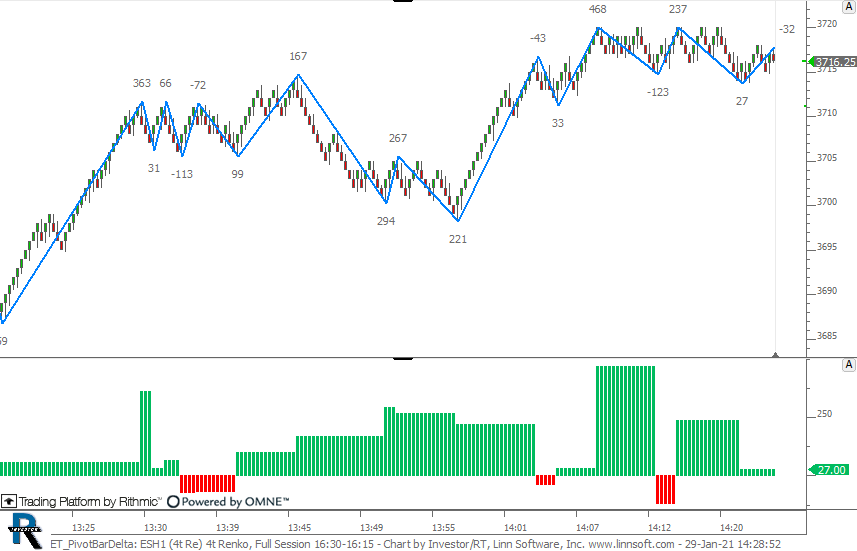 |
ET PivotBarDelta (ESH1) cpayne [totalcount]
5 years 6 months ago
Pivot Bar Delta in Custom Indicator. This chart was uploaded by Investor/RT 14.2.6 showing symbol: ESH1. |
View |
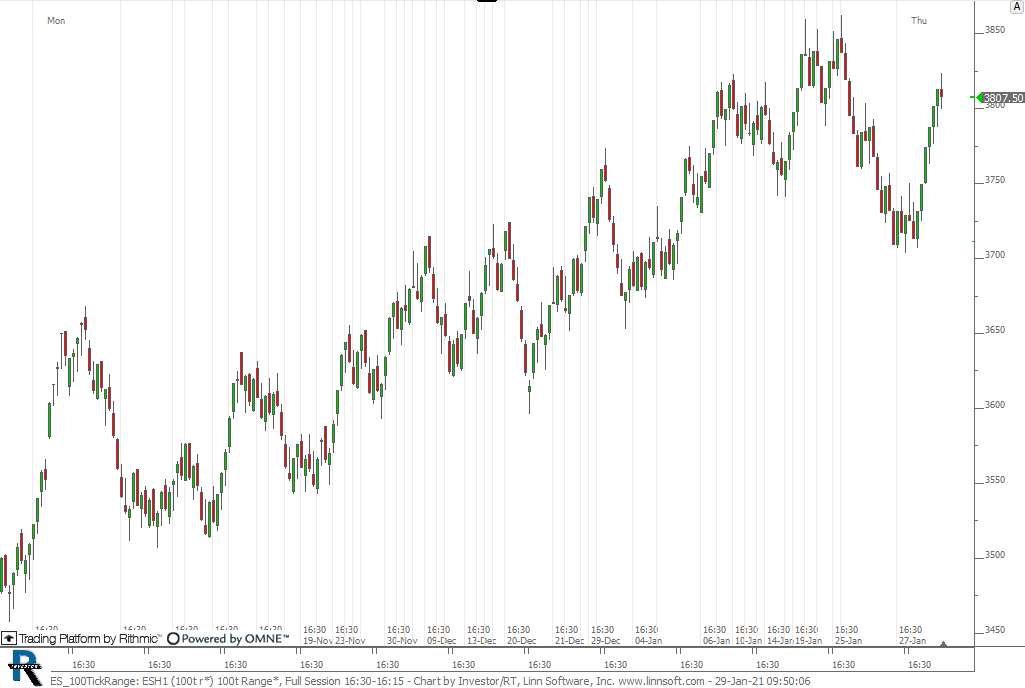 |
ES 100TickRange (ESH1) cpayne [totalcount]
5 years 6 months ago
This chart was uploaded by Investor/RT 14.2.6 showing symbol: ESH1. |
View |