 |
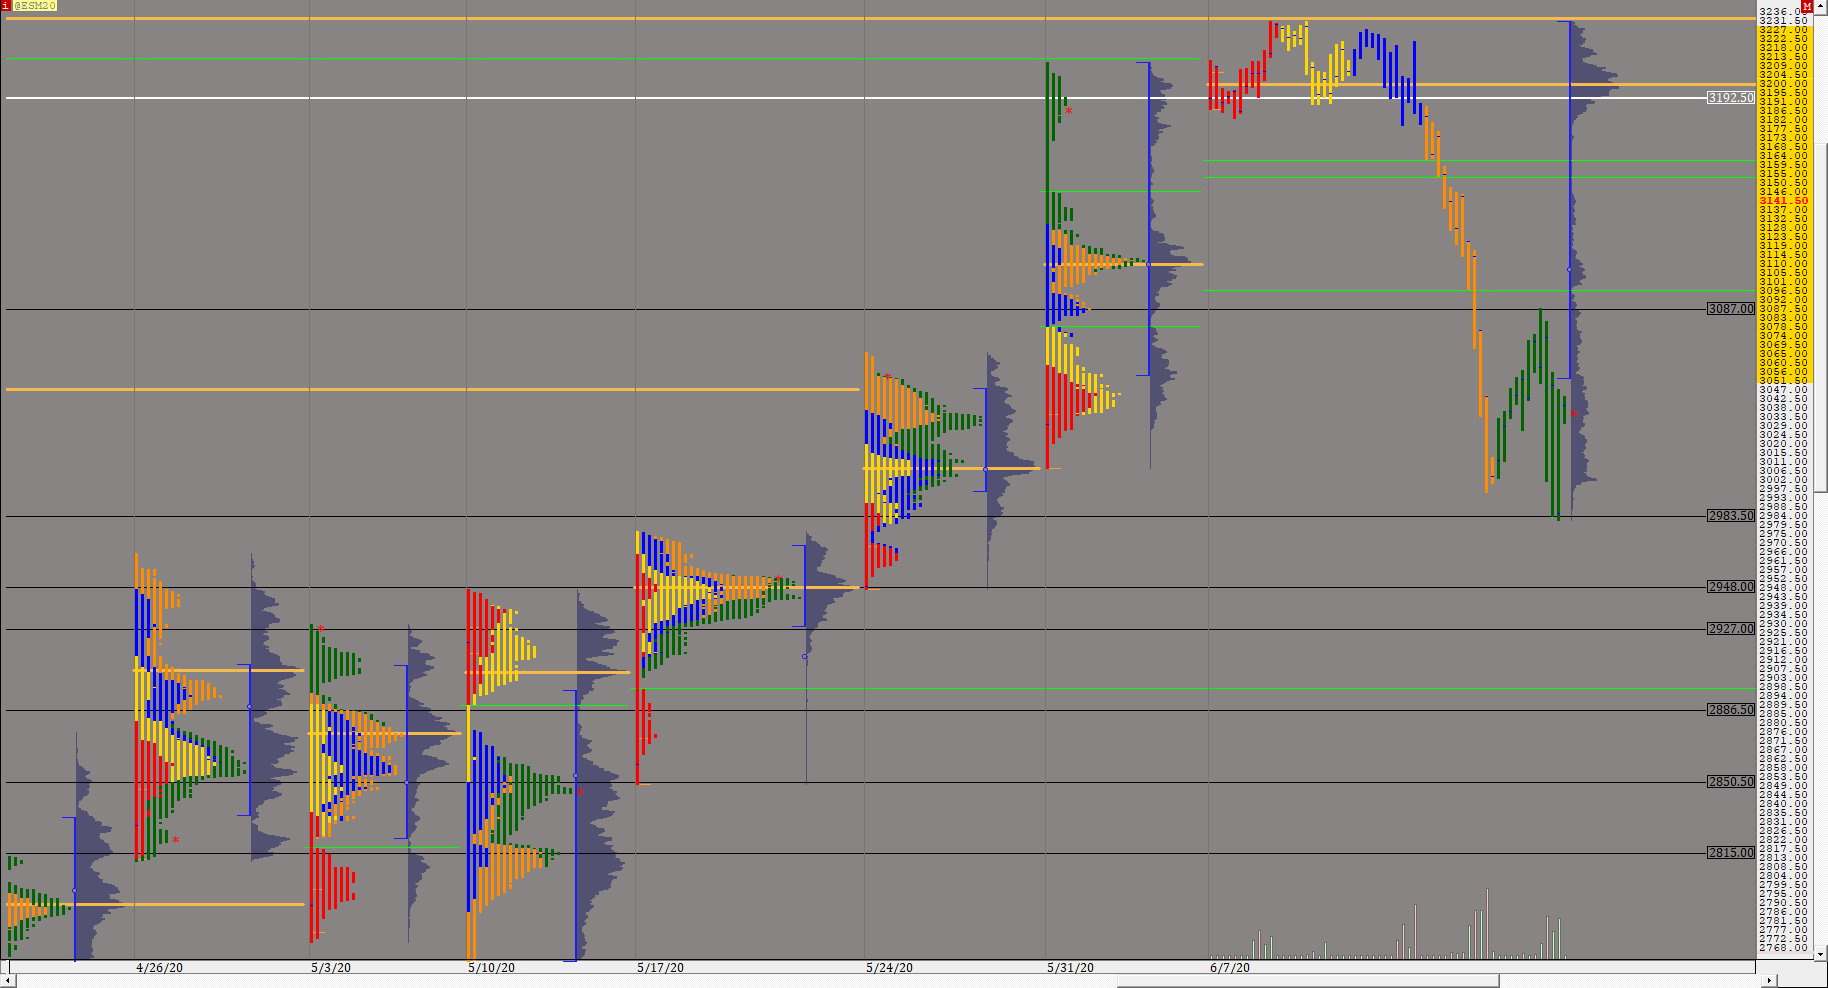
TPOWEEKLY (@ESM20) ES42 [totalcount]
6 years 1 month ago
Weekly Profiles, 120 Candles. This chart was uploaded by Investor/RT 13.6.15 showing symbol: @ESM20. |
View |
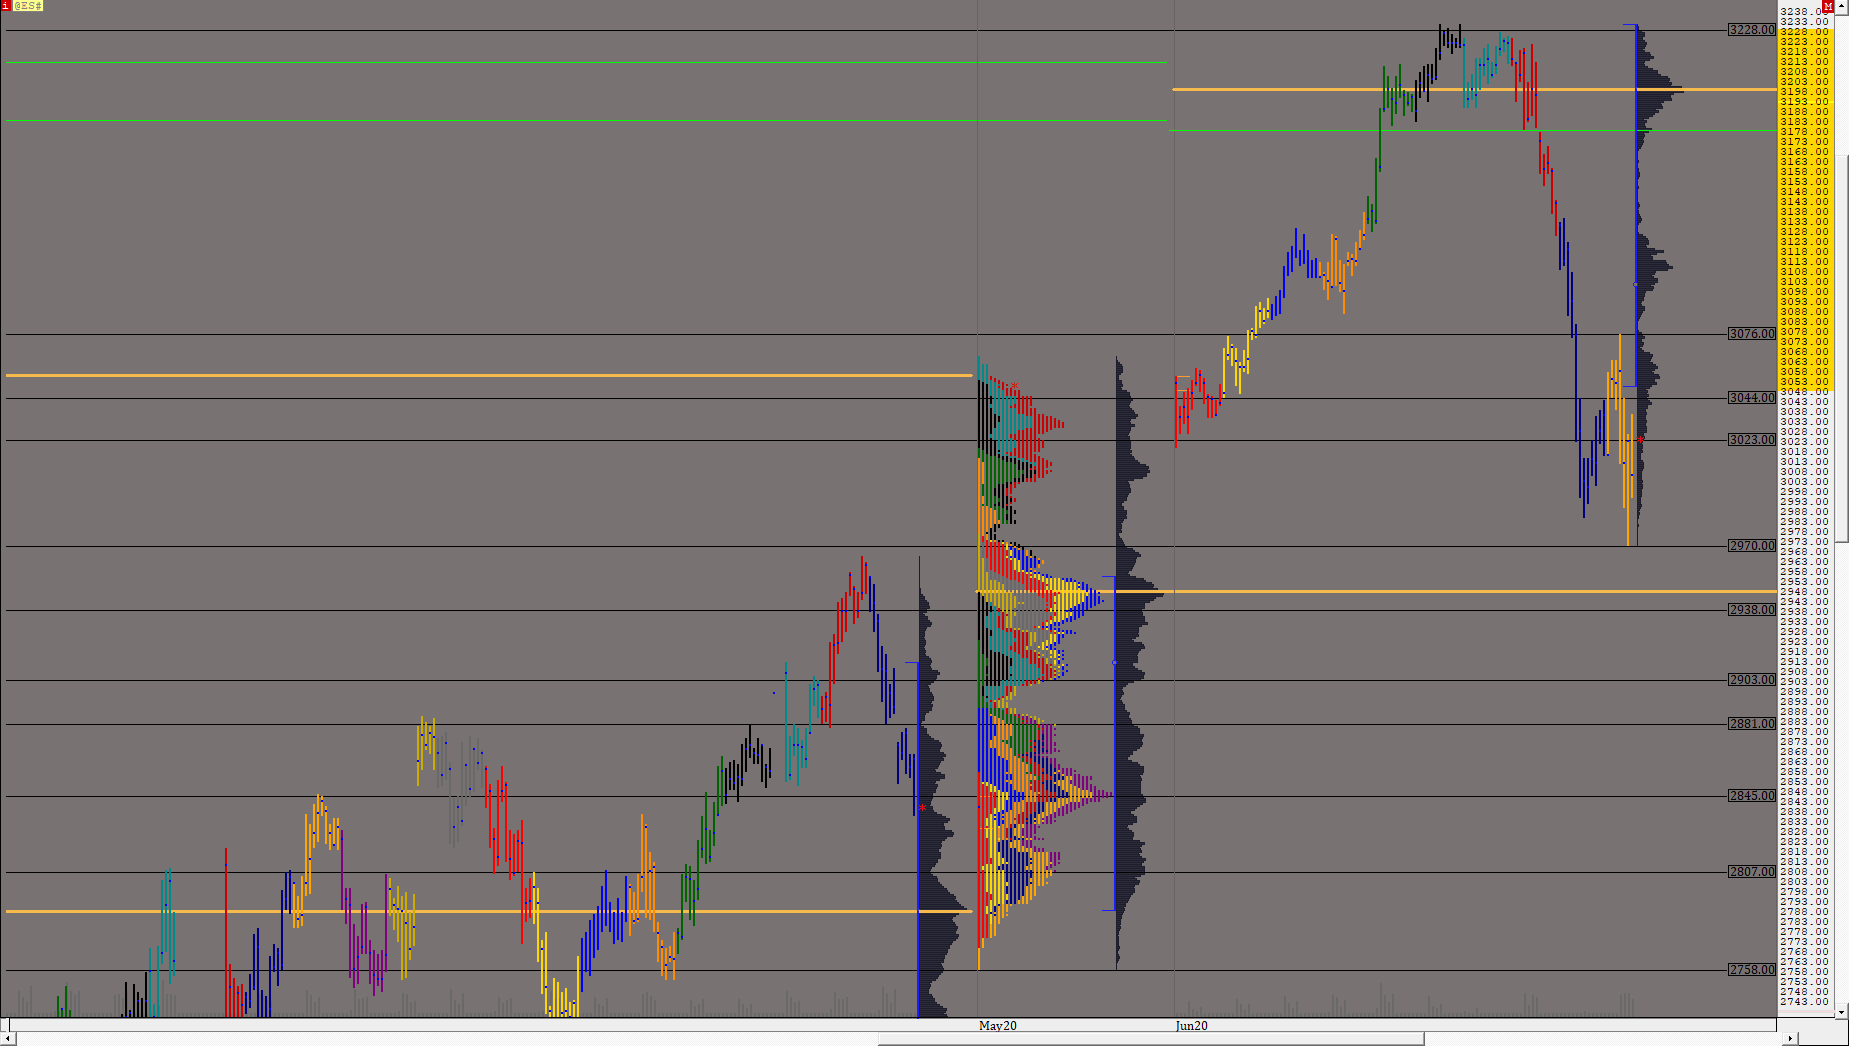 |
TPOESMONTHLY (@ES#) ES42 [totalcount]
6 years 1 month ago
Monthly Ptofiles 2 hour Candles. This chart was uploaded by Investor/RT 13.6.15 showing symbol: @ES#. |
View |
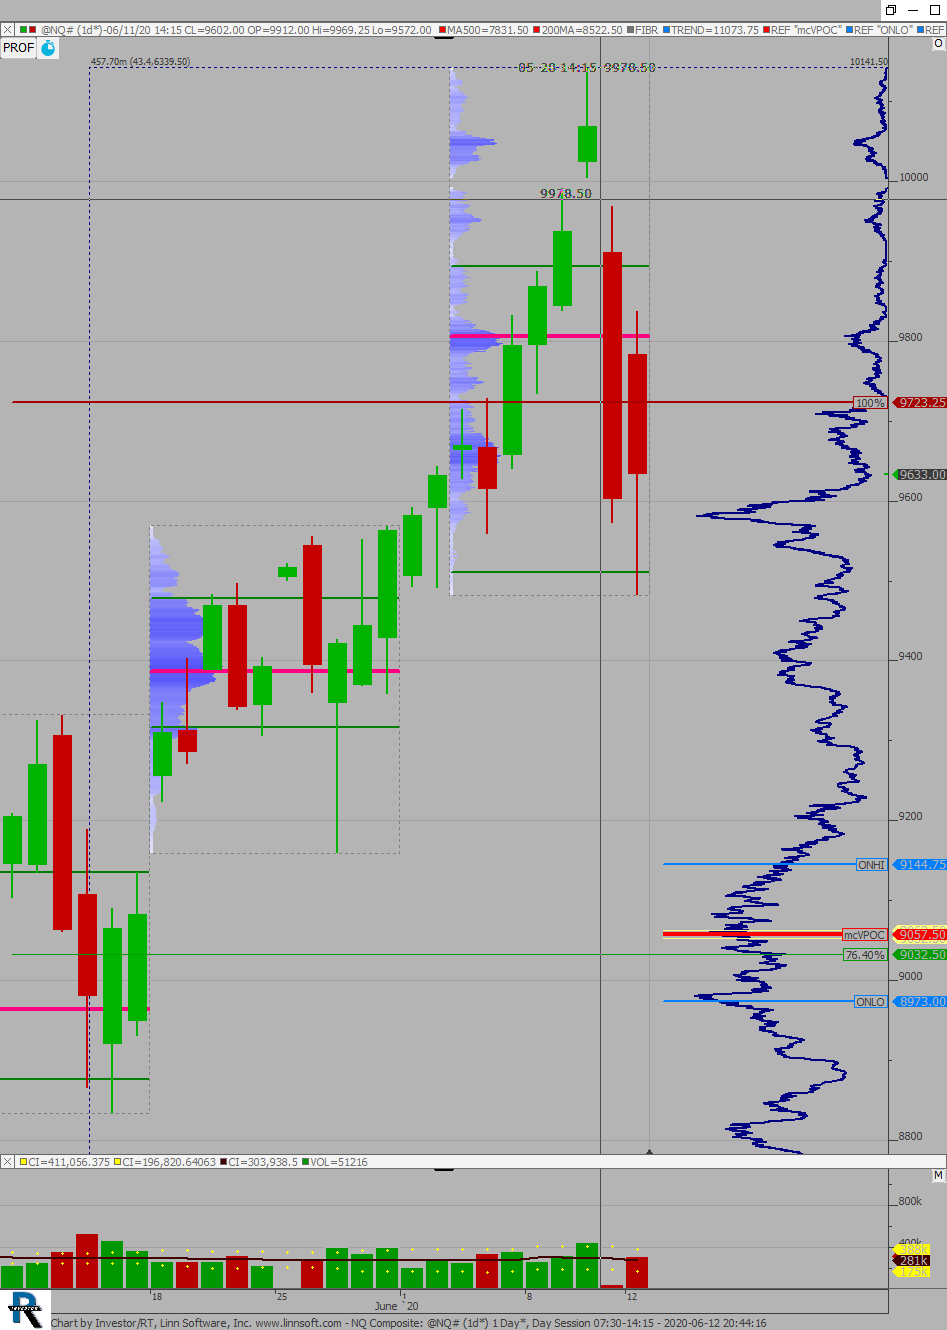 |
NQ Composite (@NQ#) rjorintas [totalcount]
6 years 1 month ago
satniro. This chart was uploaded by Investor/RT 13.3.5 showing symbol: @NQ#. |
View |
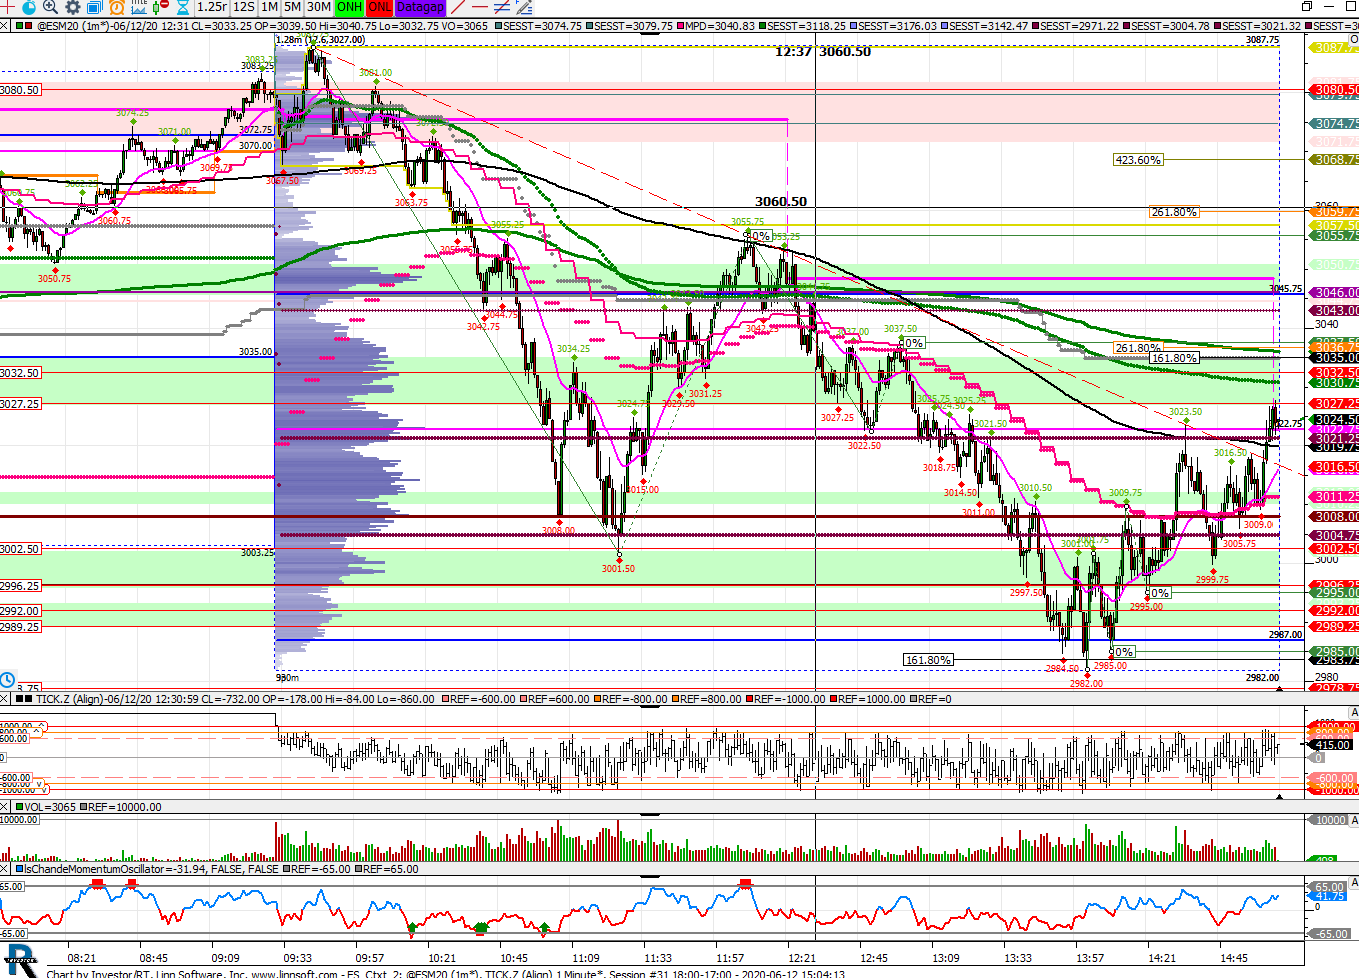 |
ES Ctxt (@ESM20) npettinato [totalcount]
6 years 1 month ago
This chart was uploaded by Investor/RT 14.1.10 showing symbol: @ESM20. |
View |
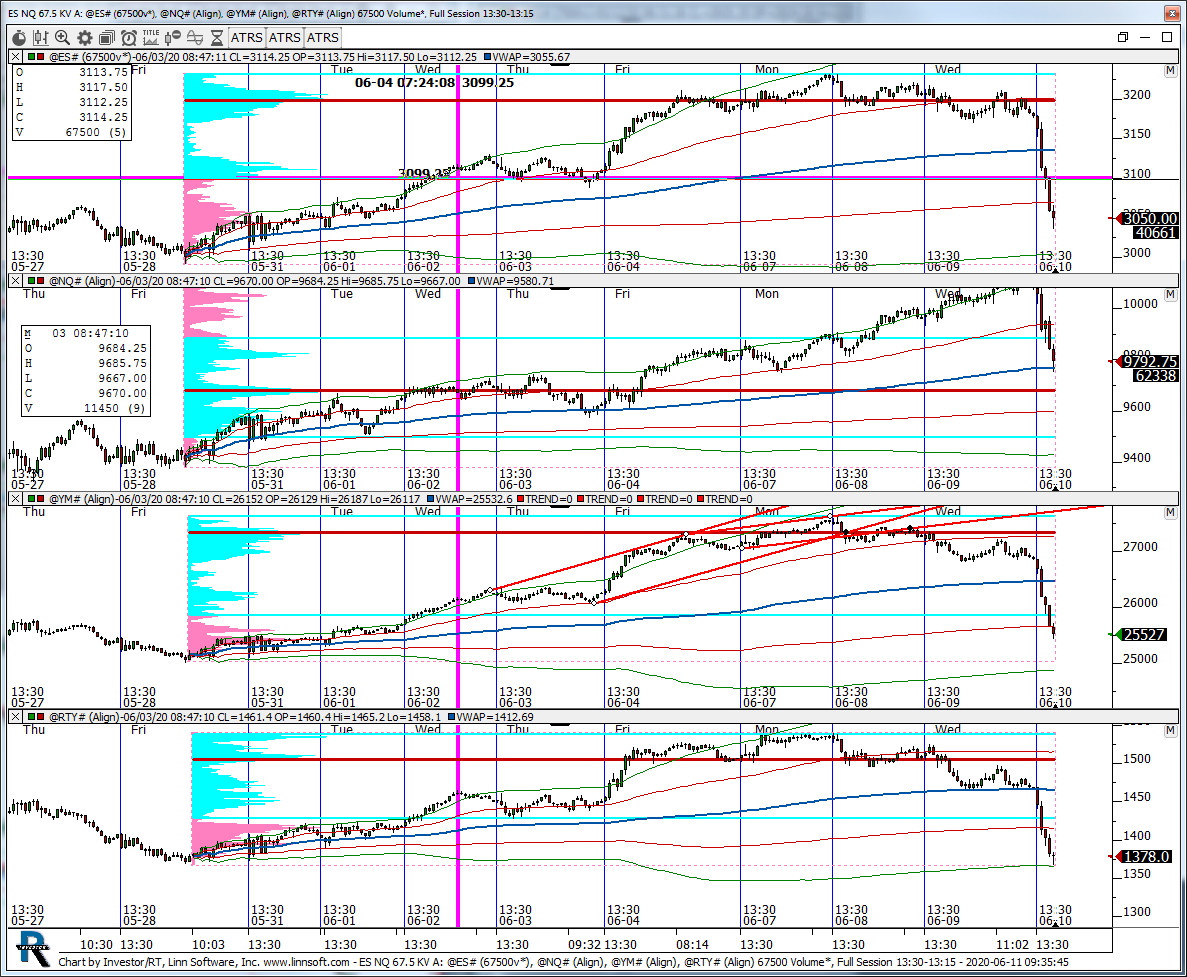 |
ES NQ 675 KV A (@ES#) kencassorla [totalcount]
6 years 1 month ago
67.5 kv. This chart was uploaded by Investor/RT 13.6.3 showing symbol: @ES#. |
View |
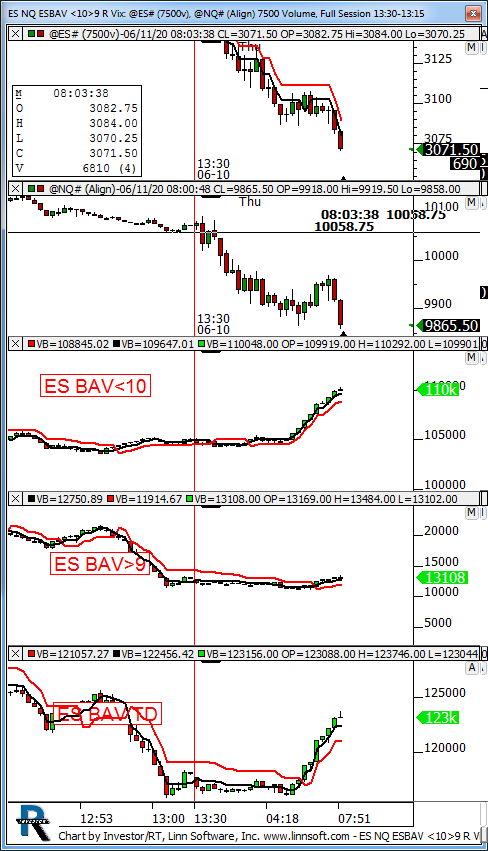 |
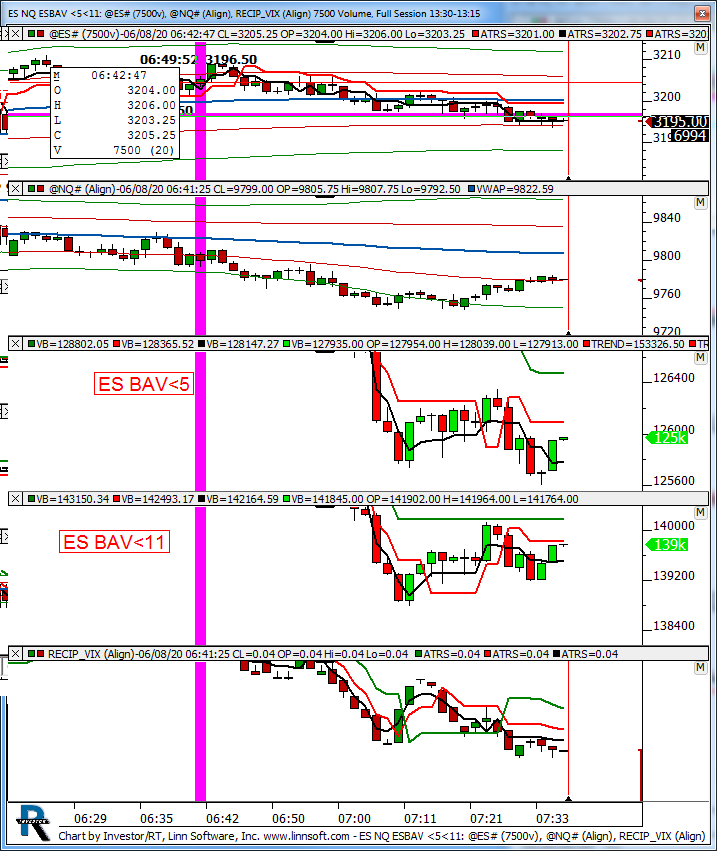
ES NQ ESBAV 109 R Vix (@ES#) kencassorla [totalcount]
6 years 1 month ago
subs. This chart was uploaded by Investor/RT 13.6.15 showing symbol: @ES#. |
View |
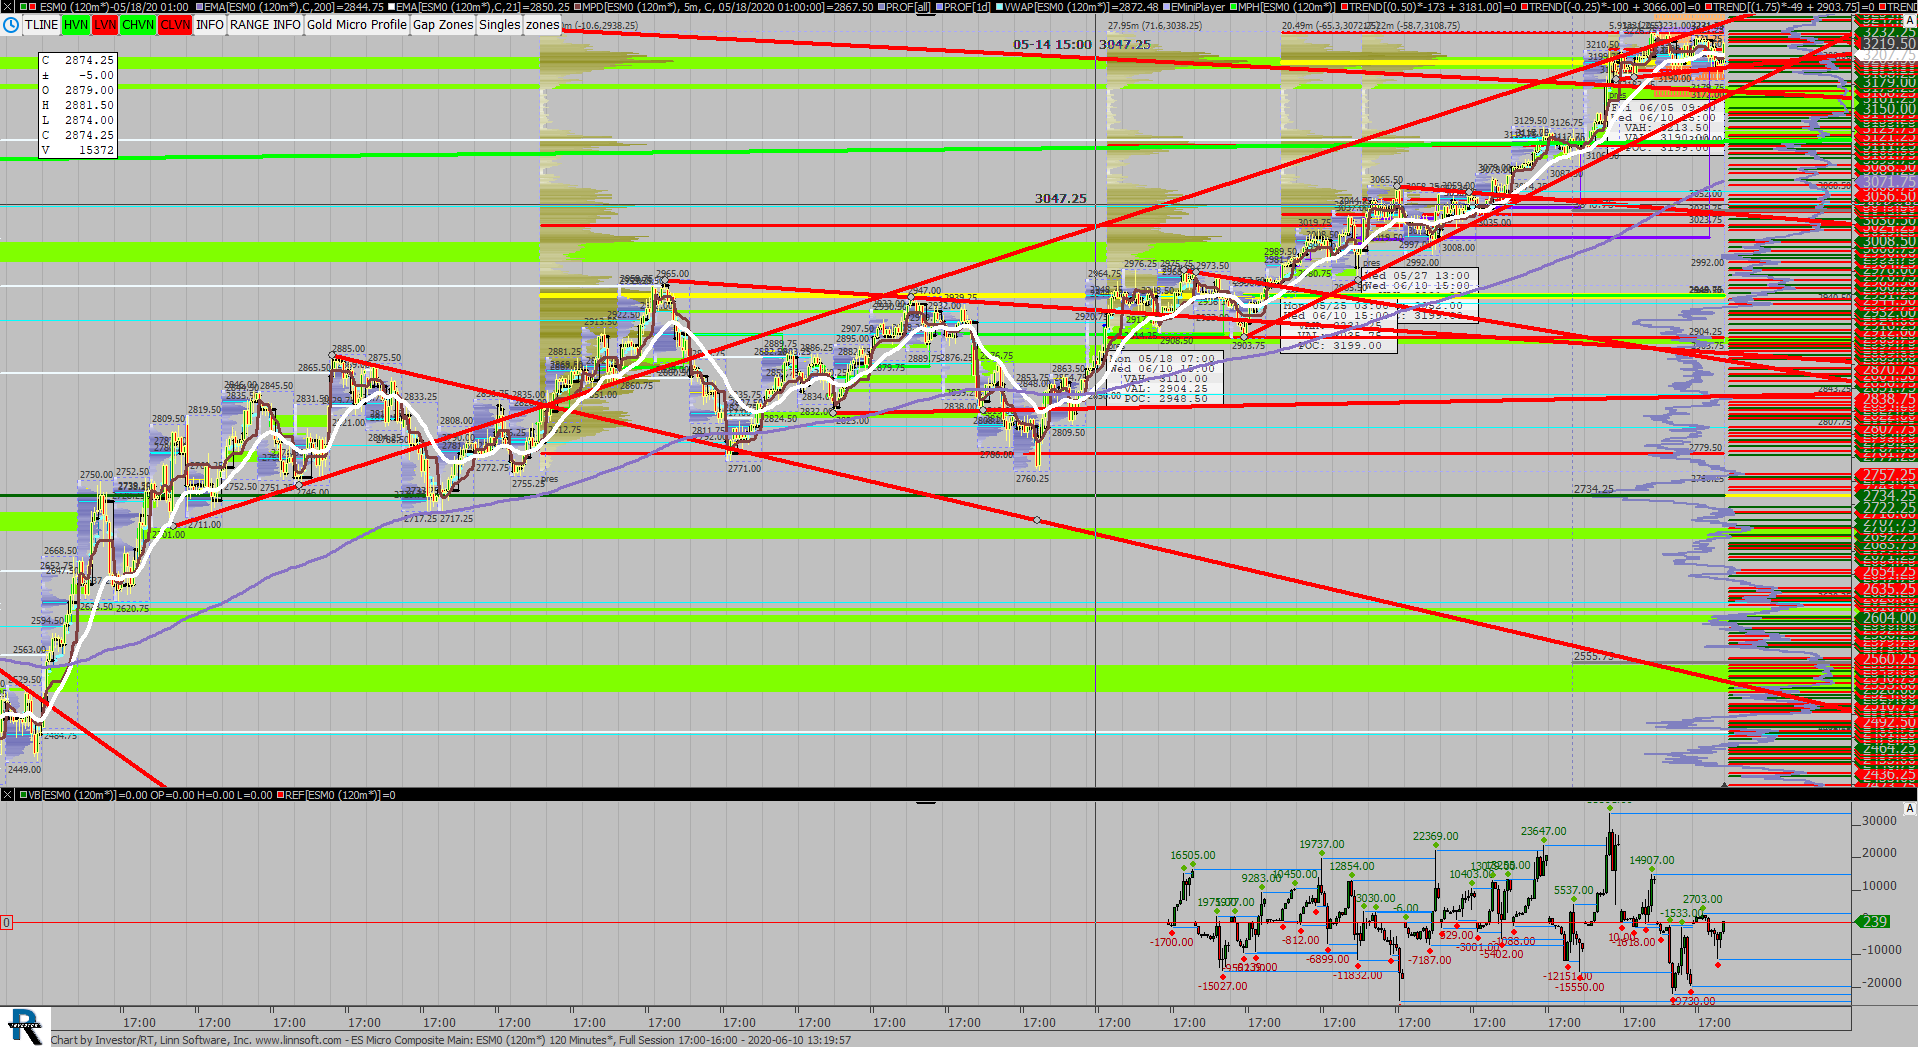 |
ES Micro Composite Main (ESM0) scottz46 [totalcount]
6 years 1 month ago
This chart was uploaded by Investor/RT 13.6.15 showing symbol: ESM0. |
View |
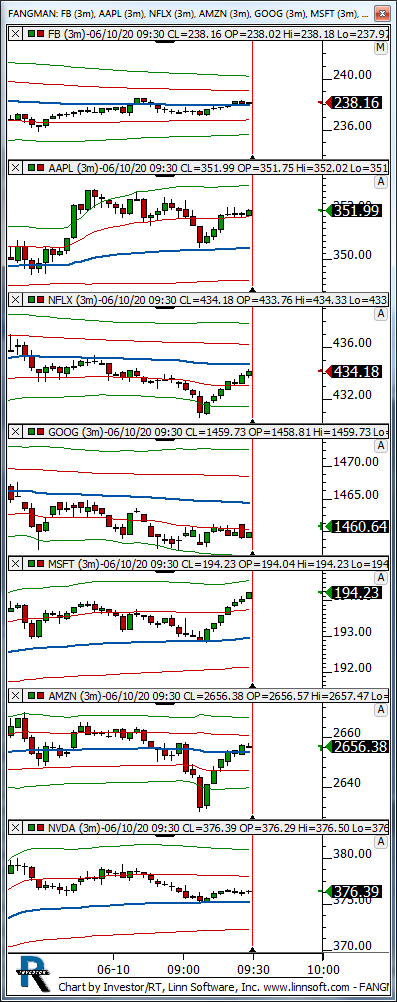 |
FANGMAN (FB) kencassorla [totalcount]
6 years 1 month ago
FANGMAN. This chart was uploaded by Investor/RT 13.6.15 showing symbol: FB. |
View |
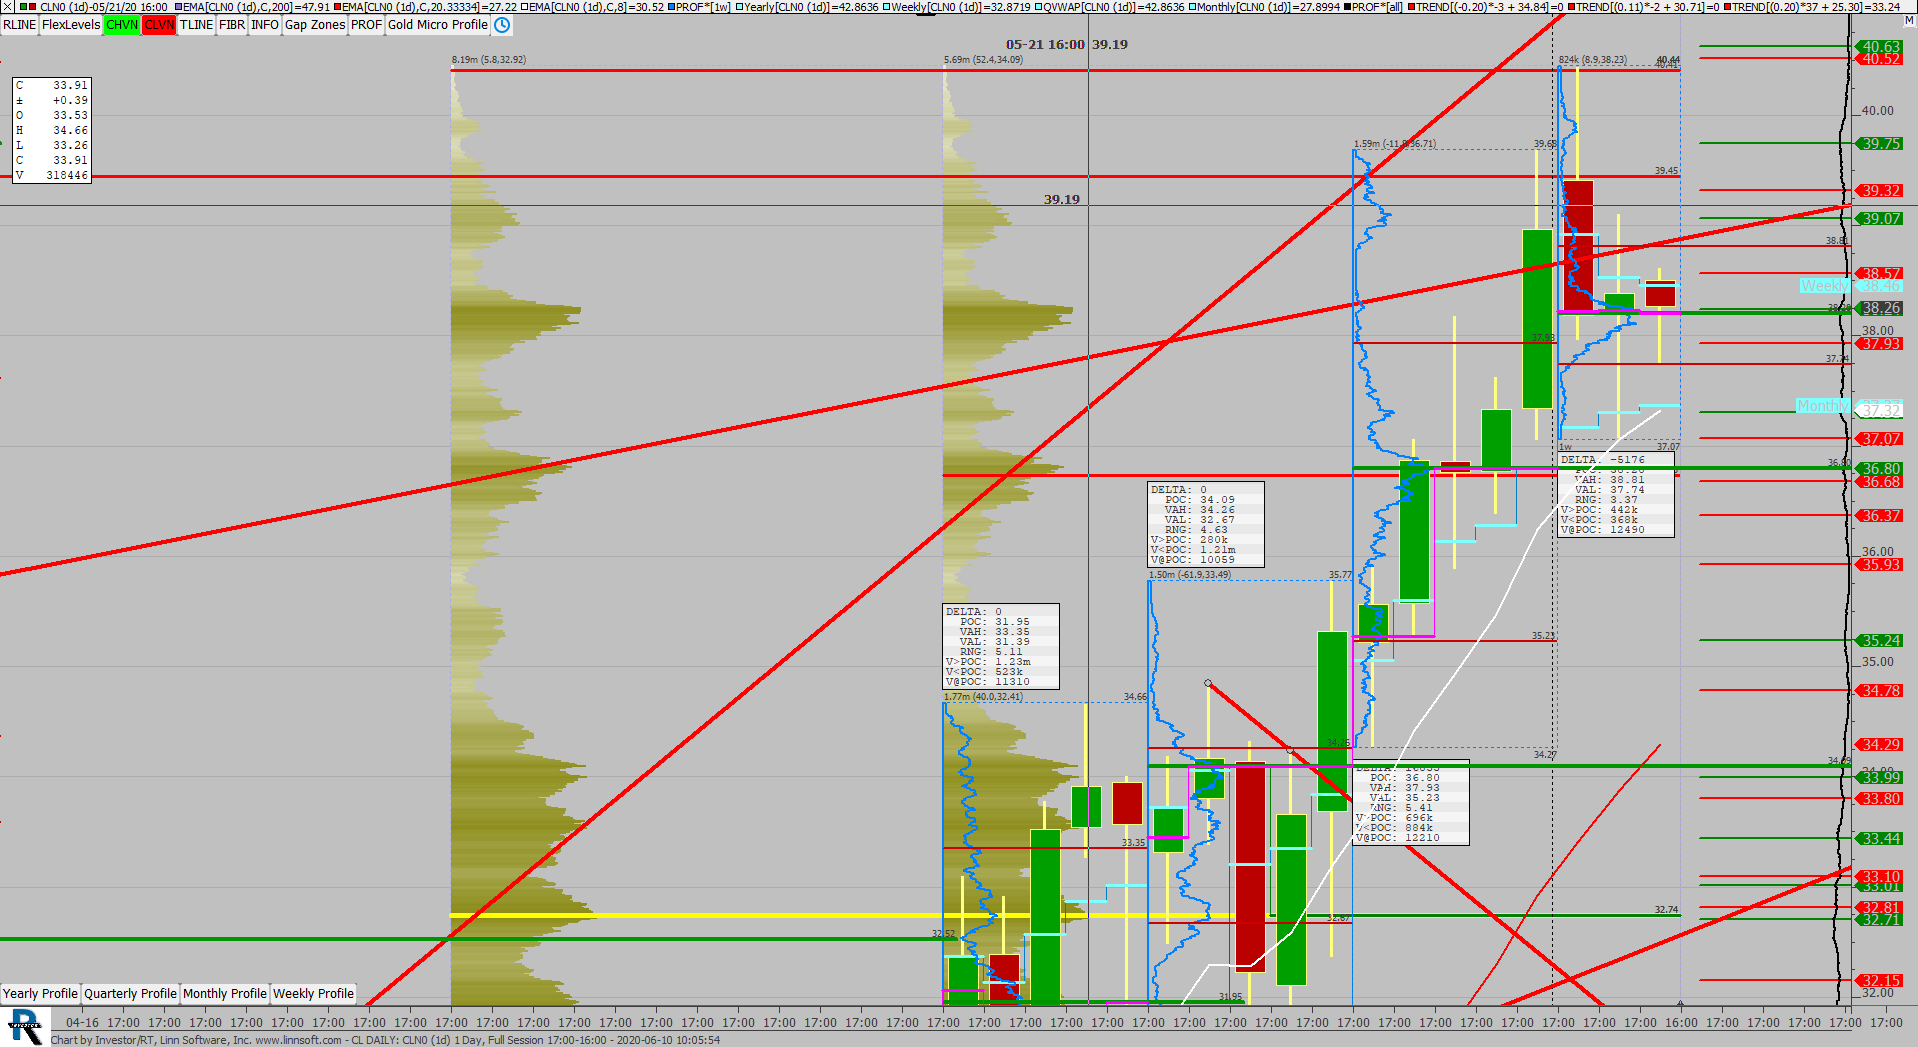 |
CL DAILY (CLN0) scottz46 [totalcount]
6 years 1 month ago
This chart was uploaded by Investor/RT 13.6.15 showing symbol: CLN0. |
View |
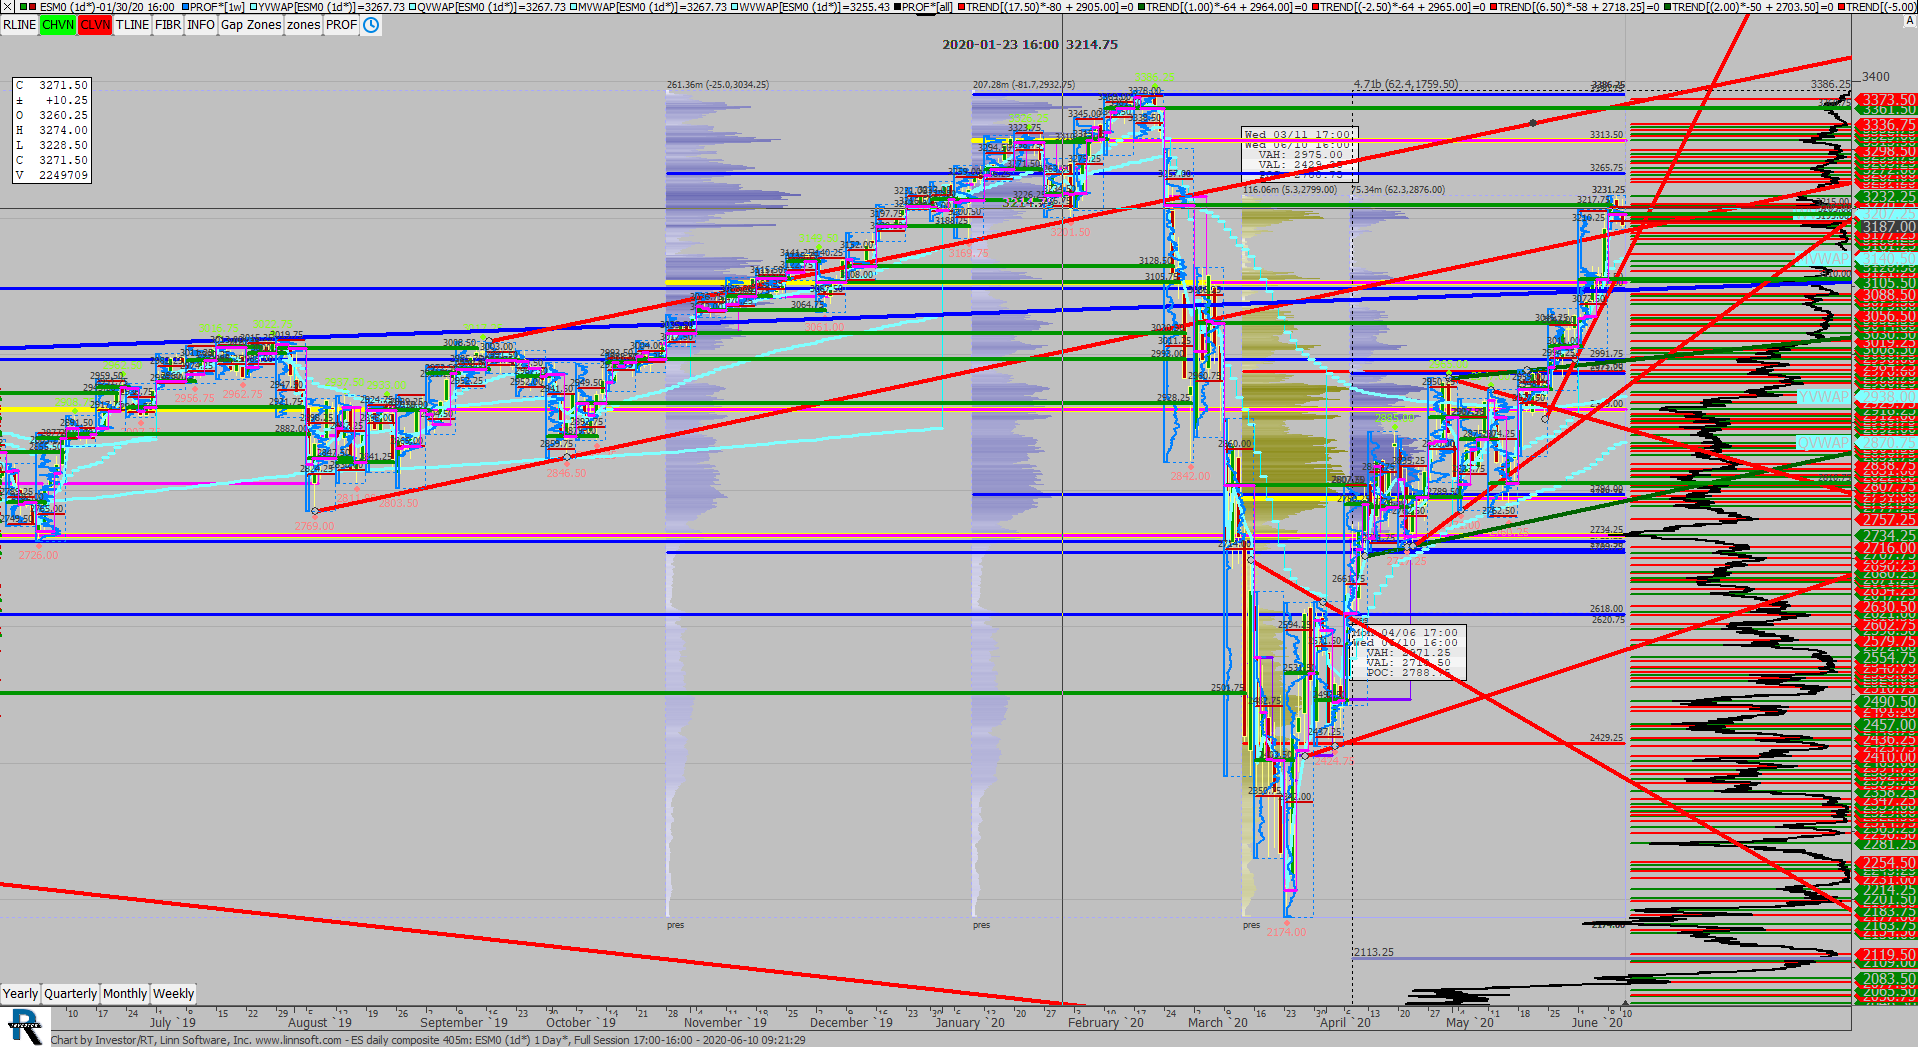 |
ES daily composite 405m (ESM0) scottz46 [totalcount]
6 years 1 month ago
This chart was uploaded by Investor/RT 13.6.15 showing symbol: ESM0. |
View |
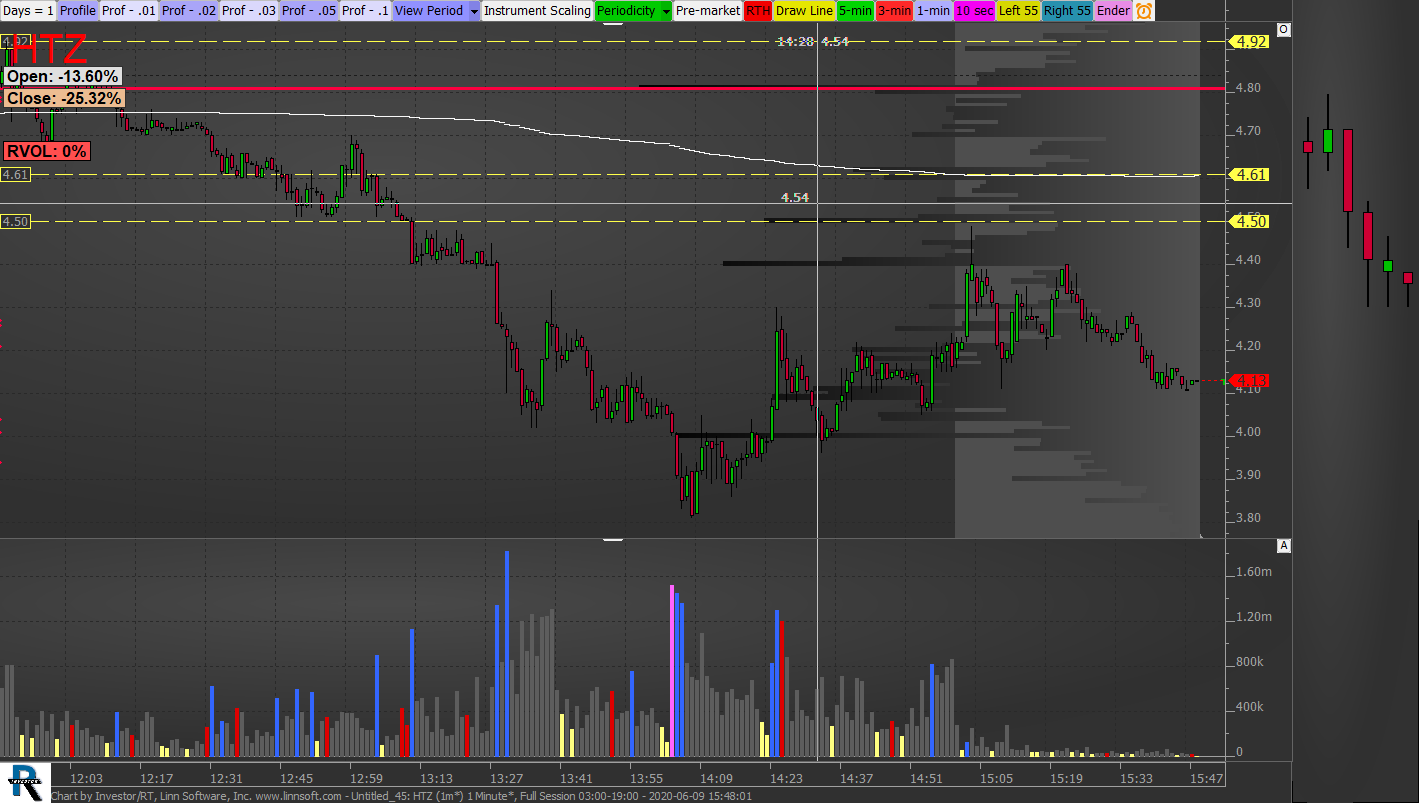 |
Untitled 45 (HTZ) Grischa Hendreschke [totalcount]
6 years 1 month ago
This chart was uploaded by Investor/RT 14.1.11 showing symbol: HTZ. |
View |
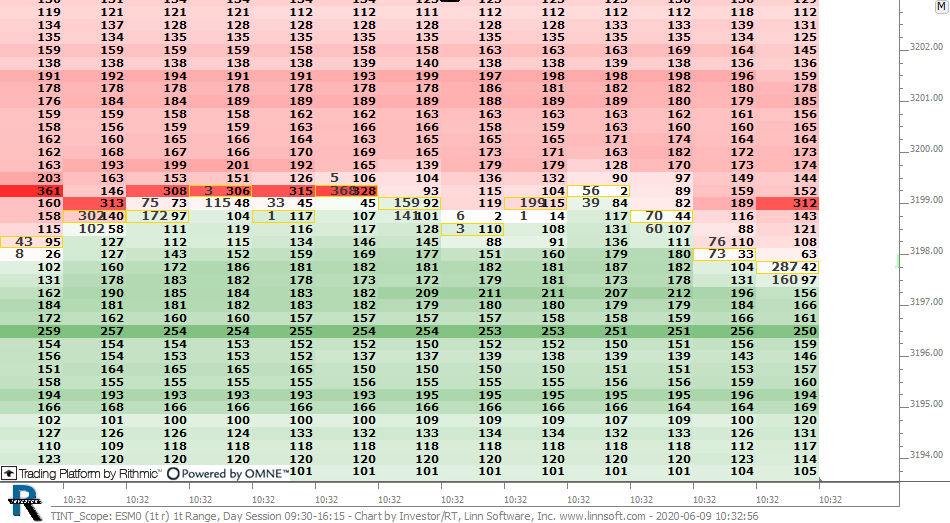 |
TINT Scope (ESM0) cpayne [totalcount]
6 years 1 month ago
VolumeScope with TINT on 1t Range Bar. This chart was uploaded by Investor/RT 14.1.11 showing symbol: ESM0. |
View |
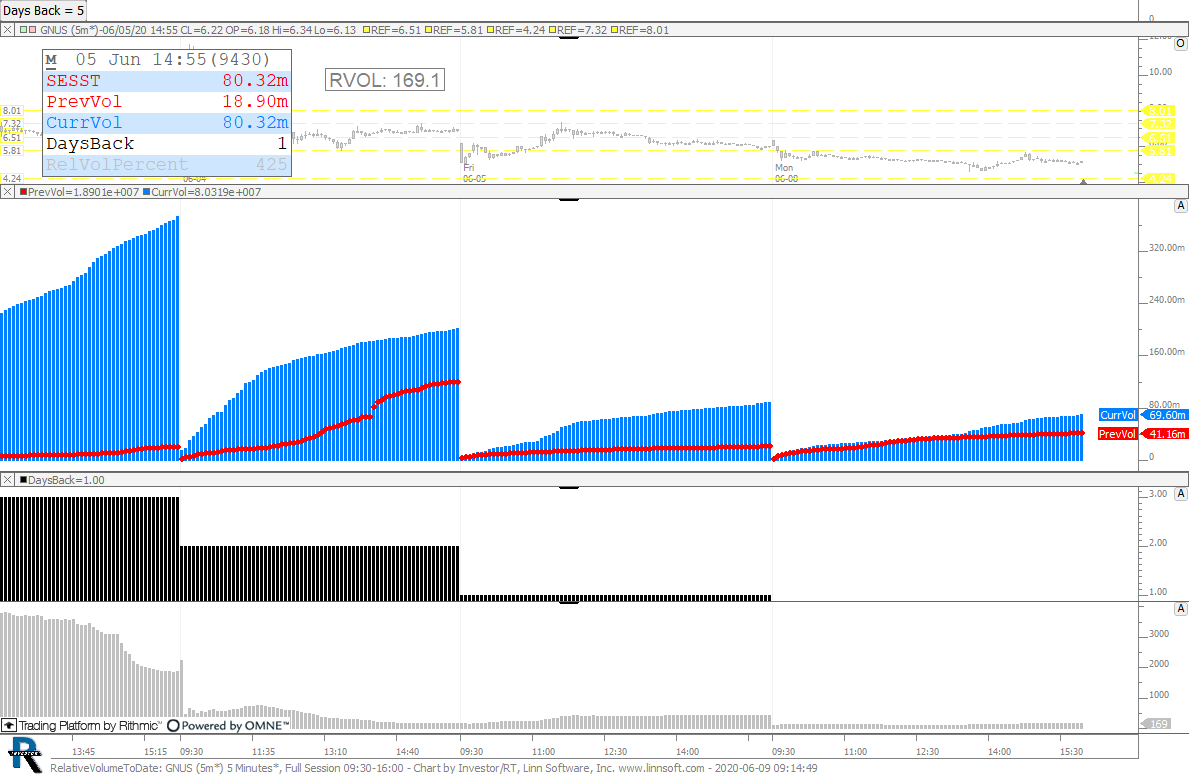 |
RelativeVolumeToDate (GNUS) 2 cpayne [totalcount]
6 years 1 month ago
This chart was uploaded by Investor/RT 14.1.11 showing symbol: GNUS. |
View |
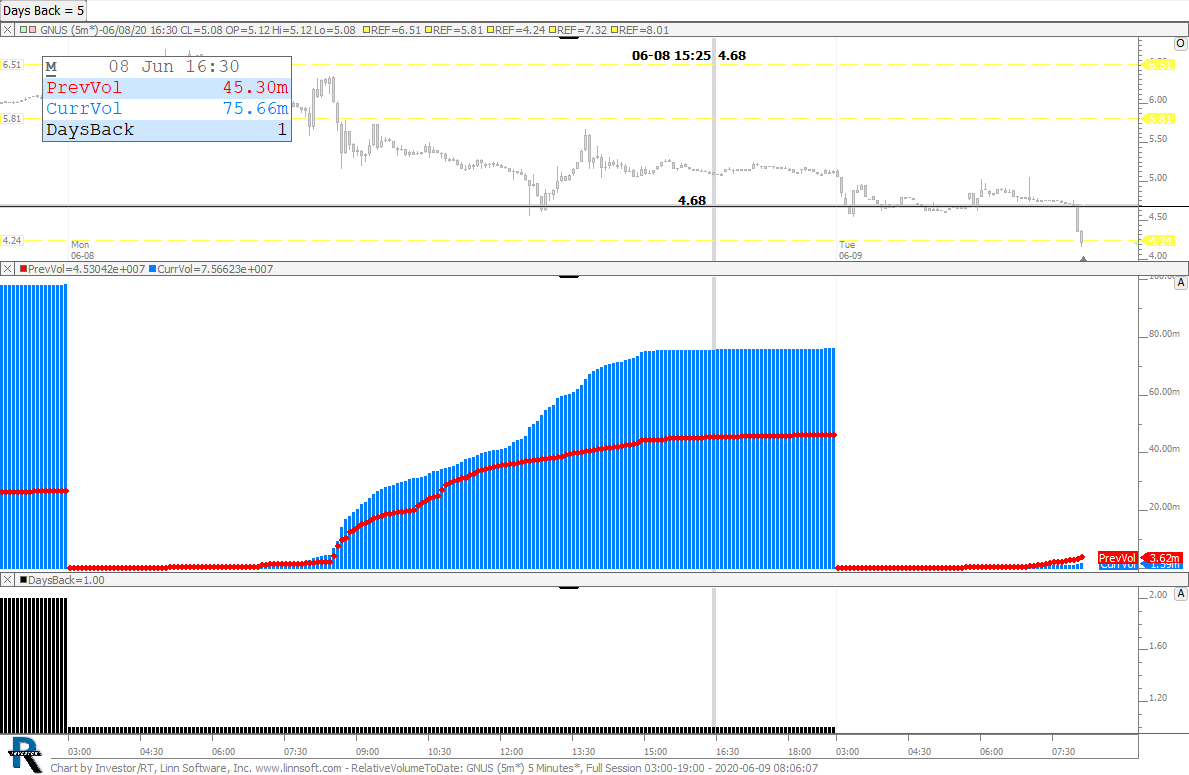 |
RelativeVolumeToDate (GNUS) Grischa Hendreschke [totalcount]
6 years 1 month ago
This chart was uploaded by Investor/RT 14.1.11 showing symbol: GNUS. |
View |
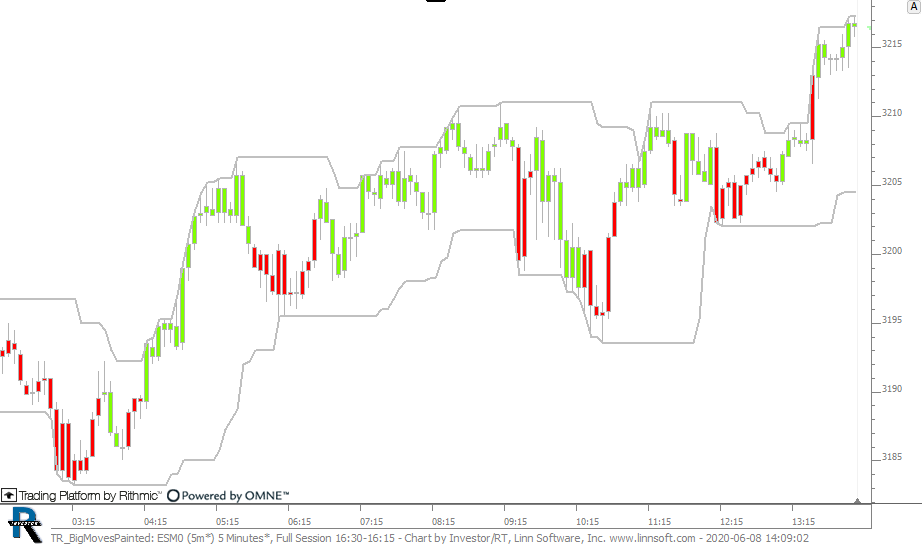 |
TR BigMovesPainted (ESM0) cpayne [totalcount]
6 years 1 month ago
Painting Big True Range Moves. This chart was uploaded by Investor/RT 14.1.11 showing symbol: ESM0. |
View |
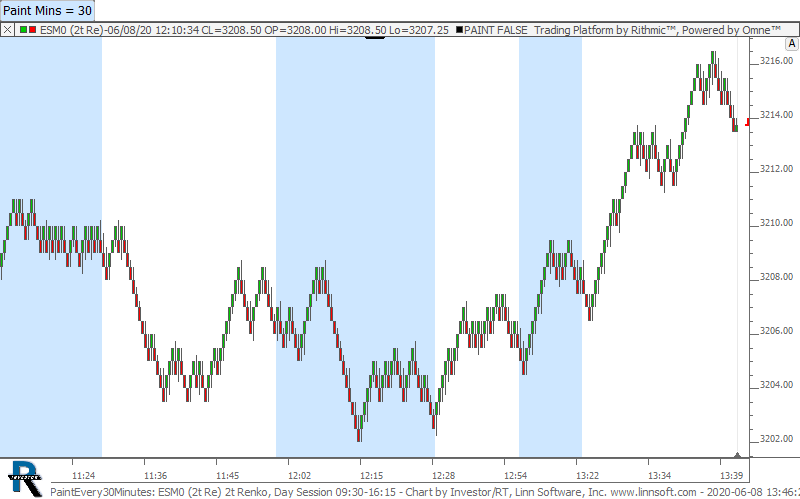 |
PaintEvery30Minutes (ESM0) cpayne [totalcount]
6 years 1 month ago
Paint Every 30 Minutes on 2t Renko Chart. This chart was uploaded by Investor/RT 14.1.11 showing symbol: ESM0. |
View |
 |
ES NQ ESBAV 511 (@ES#) kencassorla [totalcount]
6 years 1 month ago
subs. This chart was uploaded by Investor/RT 13.6.15 showing symbol: @ES#. |
View |
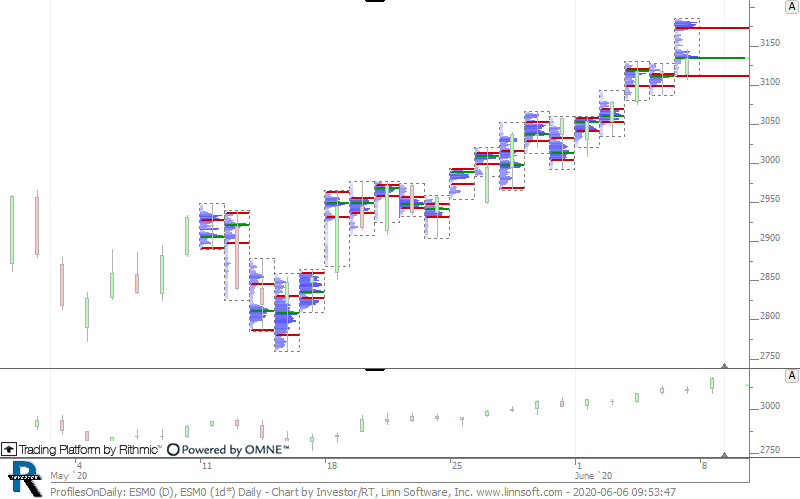 |
ProfilesOnDaily (ESM0) cpayne [totalcount]
6 years 1 month ago
Profiles on Daily Bars. This chart was uploaded by Investor/RT 14.1.11 showing symbol: ESM0. |
View |
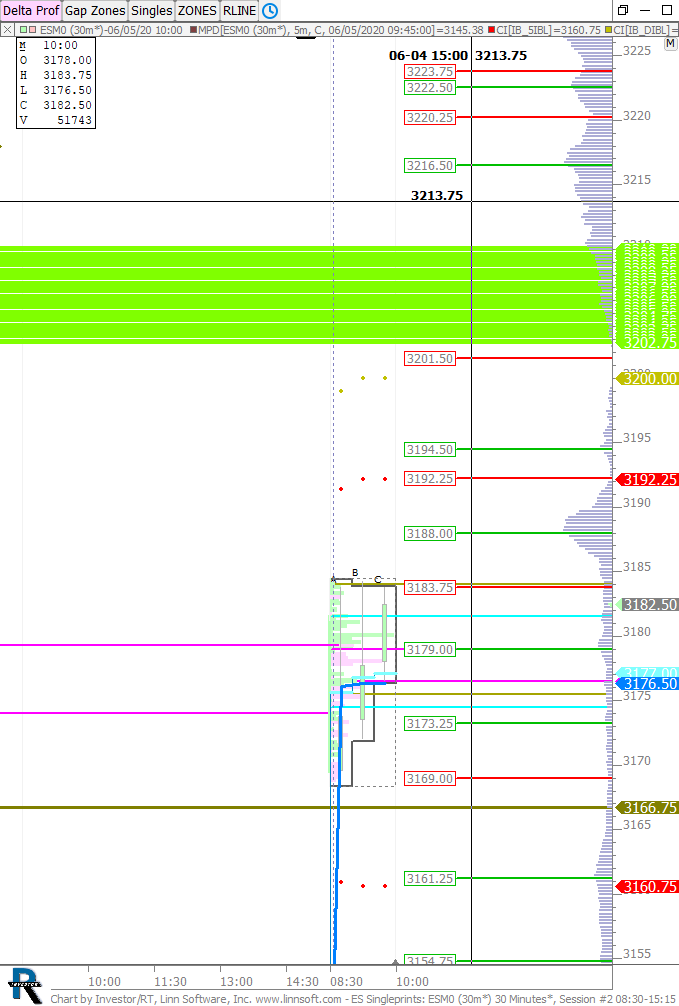 |
ES Singleprints (ESM0) scottz46 [totalcount]
6 years 1 month ago
This chart was uploaded by Investor/RT 14.1.10 showing symbol: ESM0. |
View |
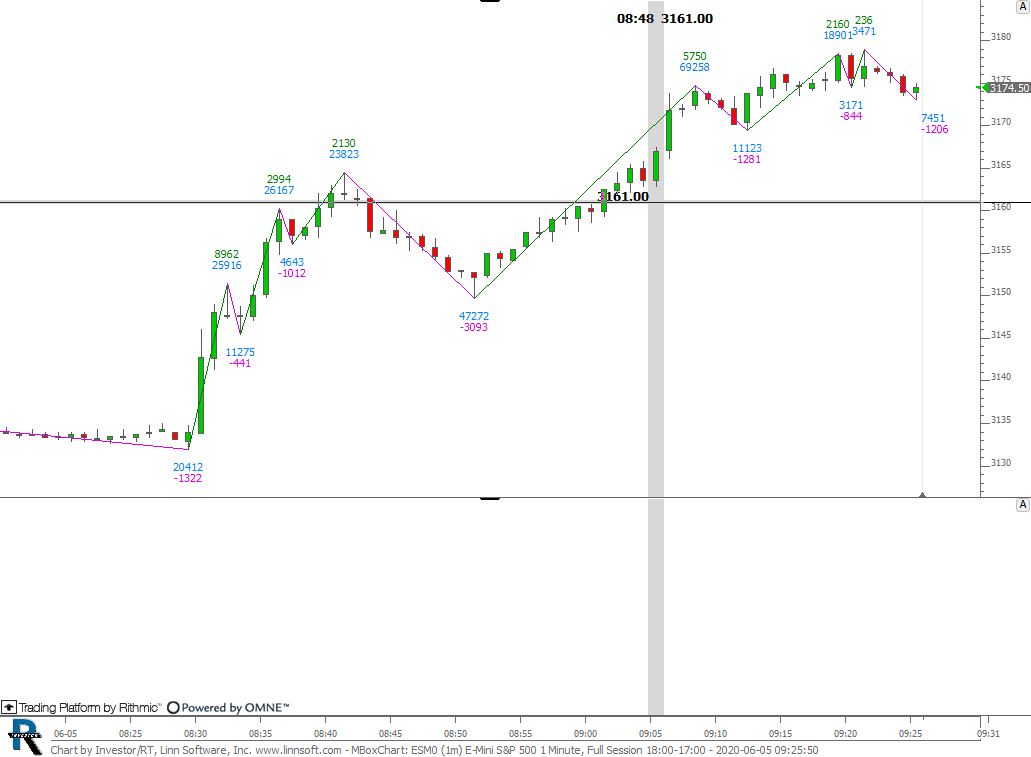 |
MBoxChart (ESM0) carlosleon2005 [totalcount]
6 years 1 month ago
This chart was uploaded by Investor/RT 14.1.11 showing symbol: ESM0. |
View |
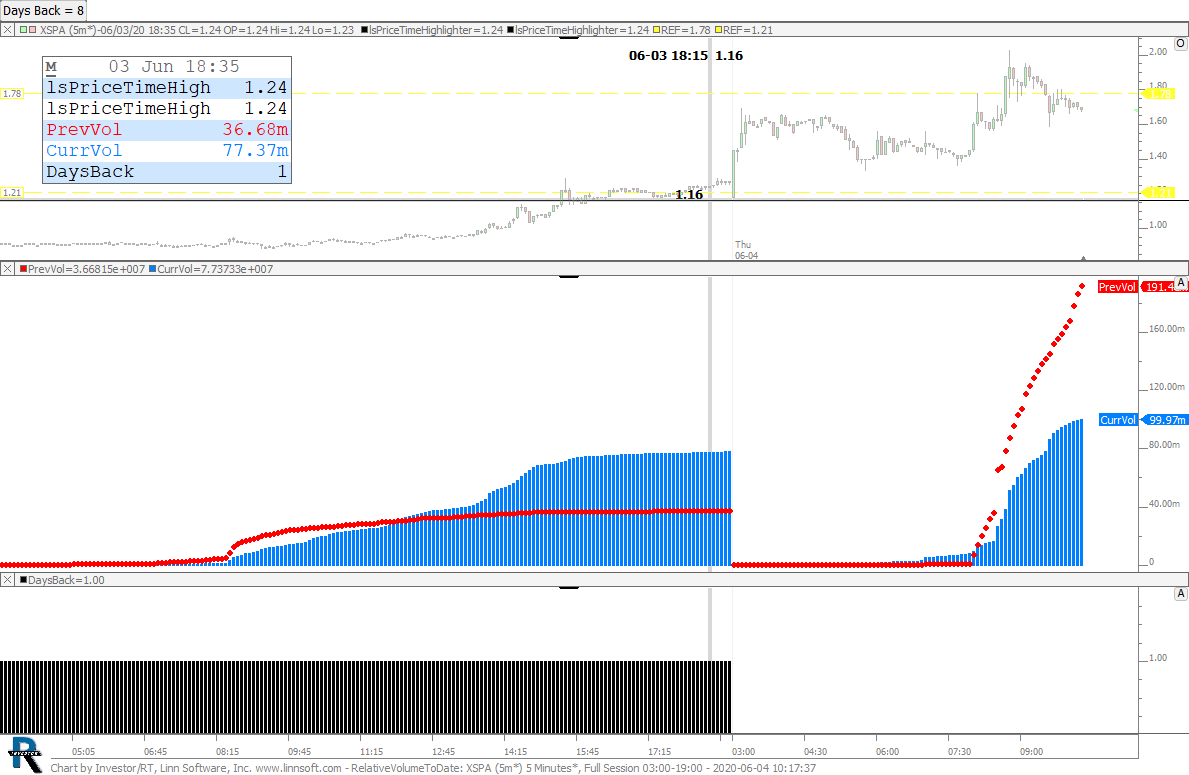 |
RelativeVolumeToDate (XSPA) Grischa Hendreschke [totalcount]
6 years 1 month ago
This chart was uploaded by Investor/RT 14.1.11 showing symbol: XSPA. |
View |
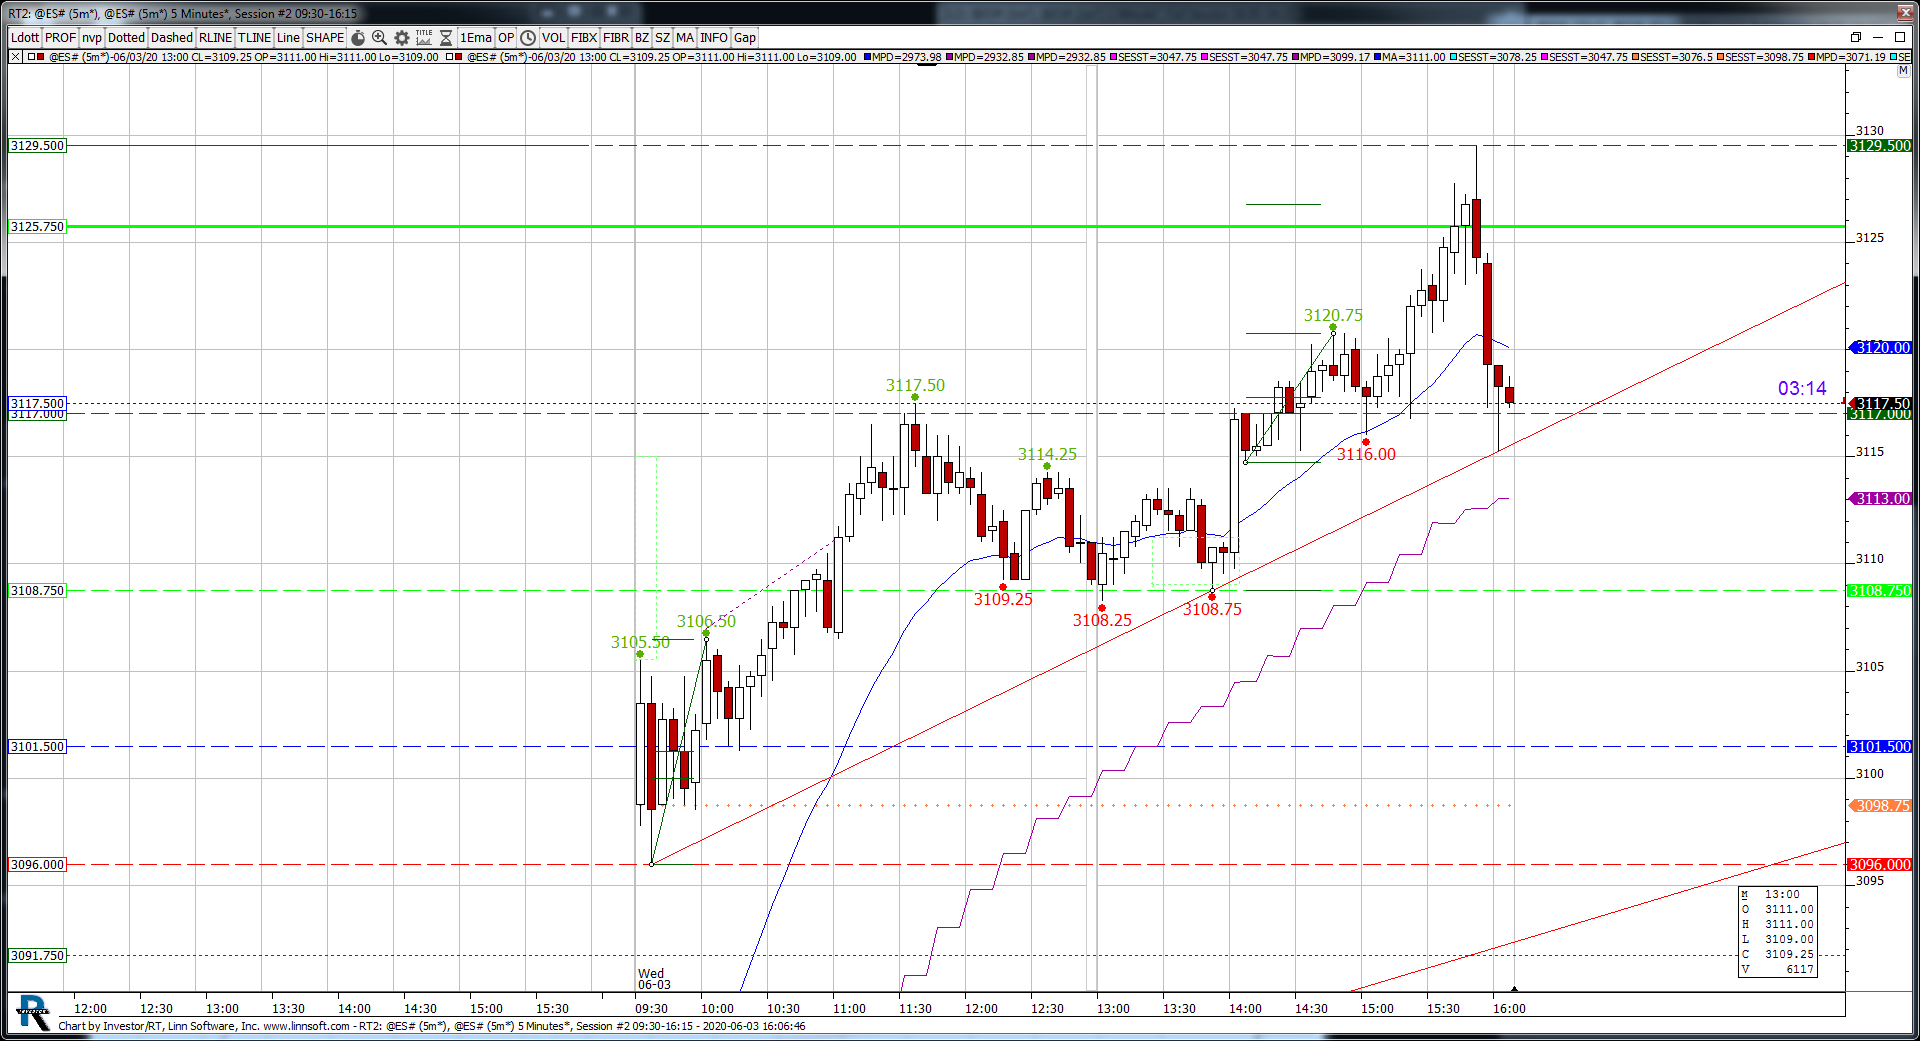 |
RT2 (@ES#) taprinton [totalcount]
6 years 1 month ago
This chart was uploaded by Investor/RT 13.6.15 showing symbol: @ES#. |
View |
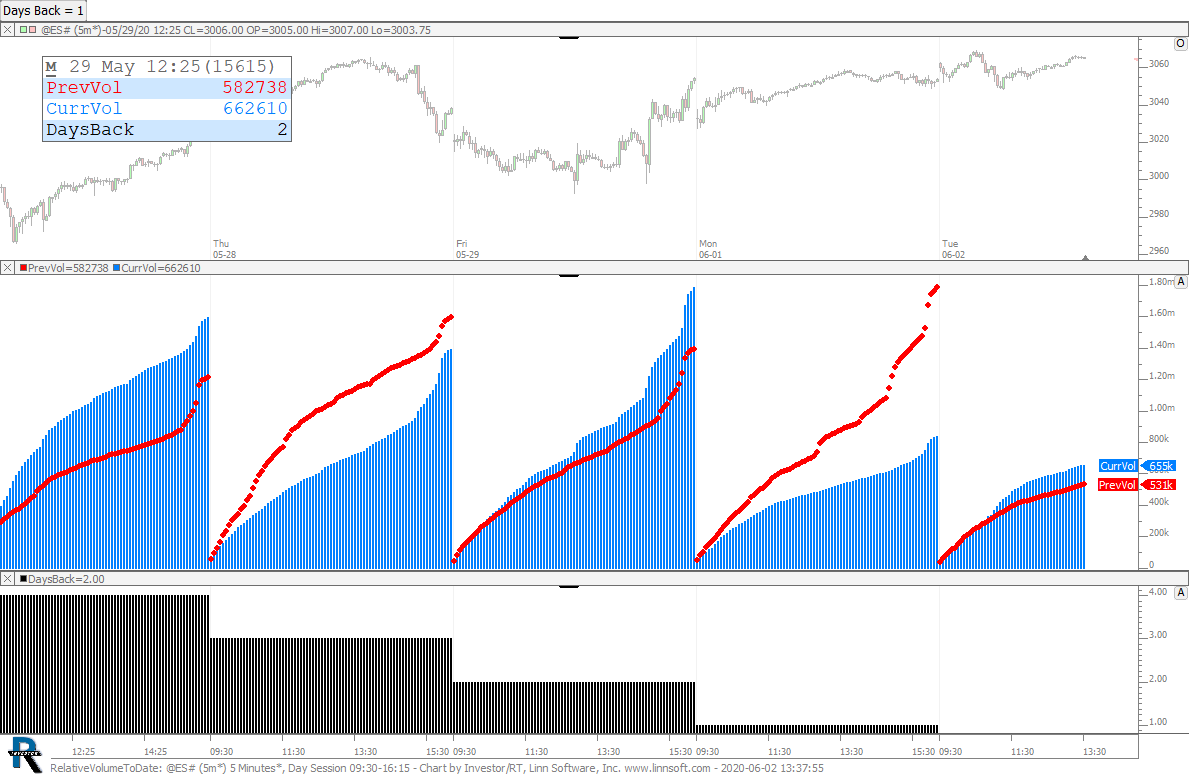 |
RelativeVolumeToDate (@ES#) cpayne [totalcount]
6 years 1 month ago
Relative Volume to Prior Date. This chart was uploaded by Investor/RT 14.1.11 showing symbol: @ES#. |
View |
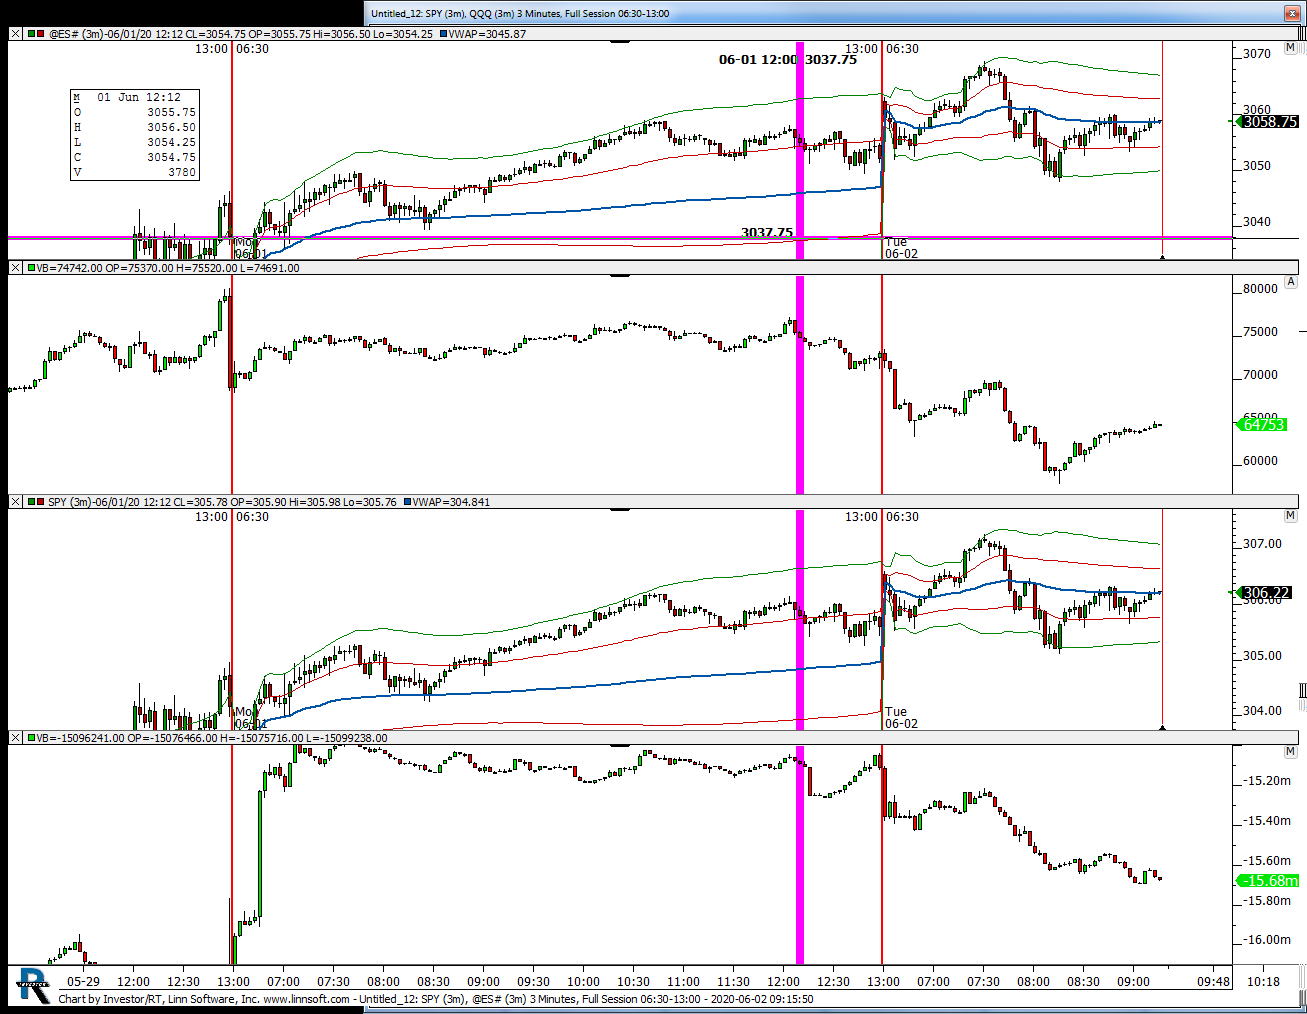 |
Untitled 12 (@ES#) kencassorla [totalcount]
6 years 1 month ago
spy vs es. This chart was uploaded by Investor/RT 13.6.15 showing symbol: @ES#. |
View |
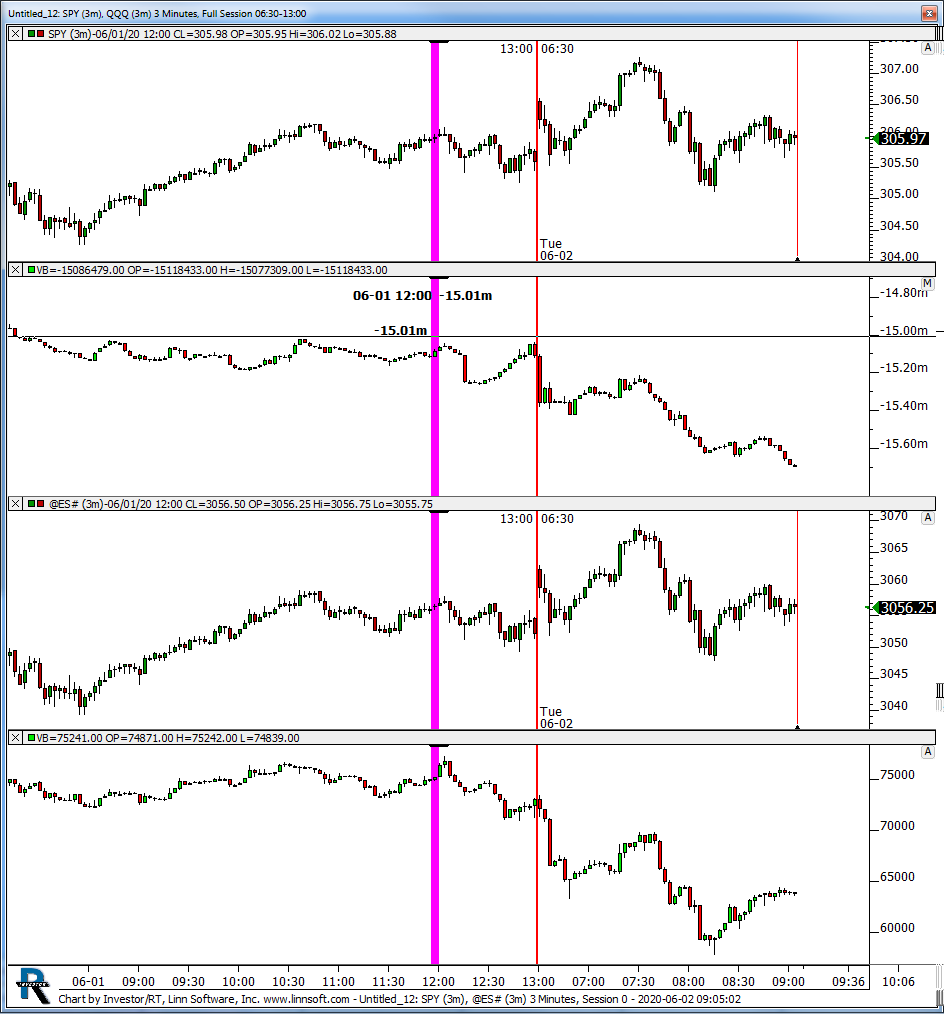 |
Untitled 12 (SPY) kencassorla [totalcount]
6 years 1 month ago
spy qqq deltas. This chart was uploaded by Investor/RT 13.6.15 showing symbol: SPY. |
View |