 |
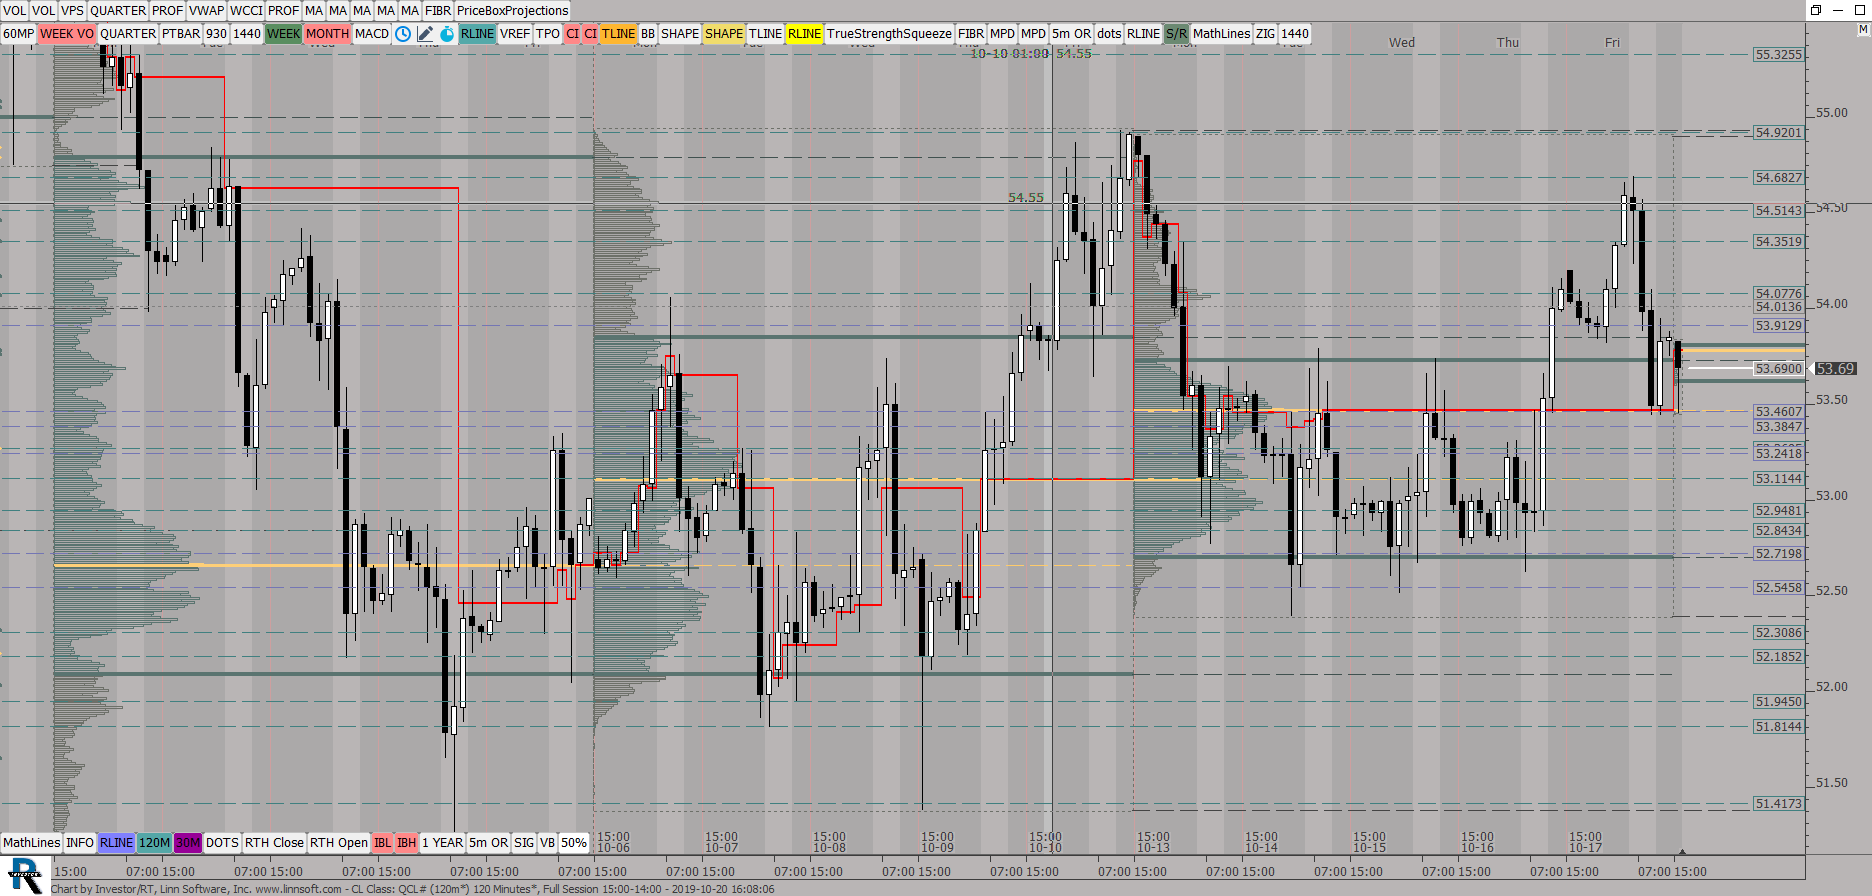
CL Class (QCL#) ES42 [totalcount]
6 years 9 months ago
Weekly TPO Profiles, 120 min candles. This chart was uploaded by Investor/RT 13.6.3 showing symbol: QCL#. |
View |
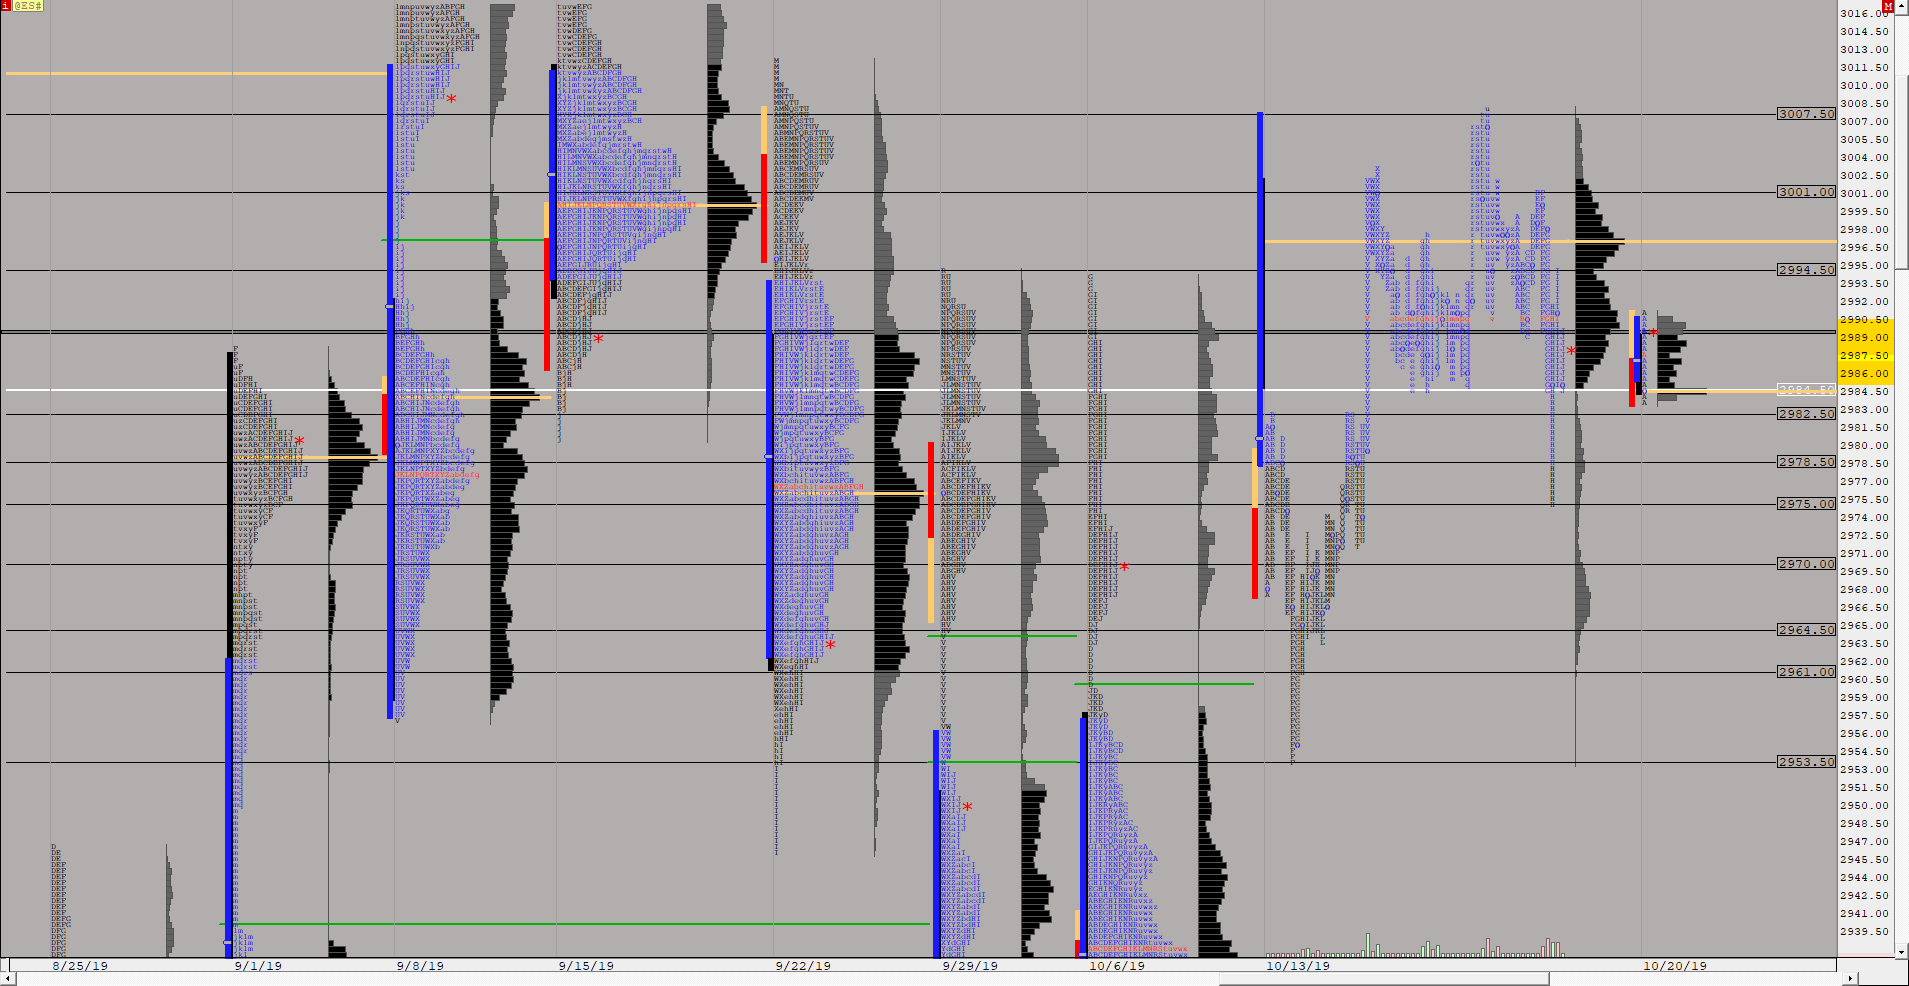 |
WEEKLY VALUEMP (@ES#) ES42 [totalcount]
6 years 9 months ago
This chart was uploaded by Investor/RT 13.5.24 showing symbol: @ES#. |
View |
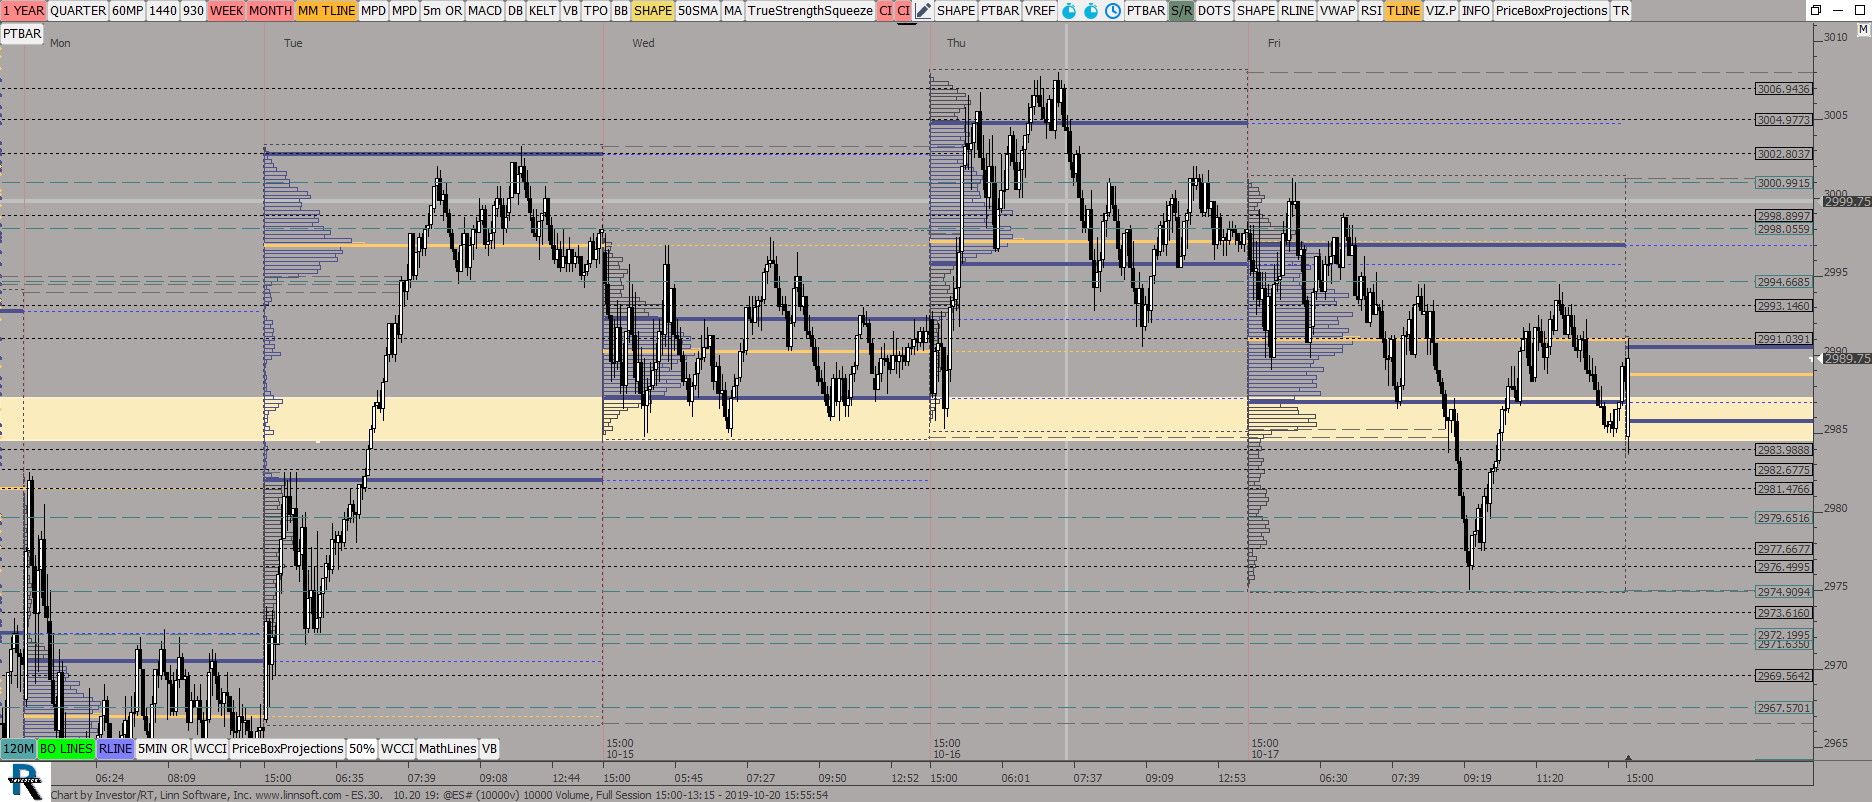 |
ES30 1020 (@ES#) ES42 [totalcount]
6 years 9 months ago
Daily VP, Volume Candles. This chart was uploaded by Investor/RT 13.6.3 showing symbol: @ES#. |
View |
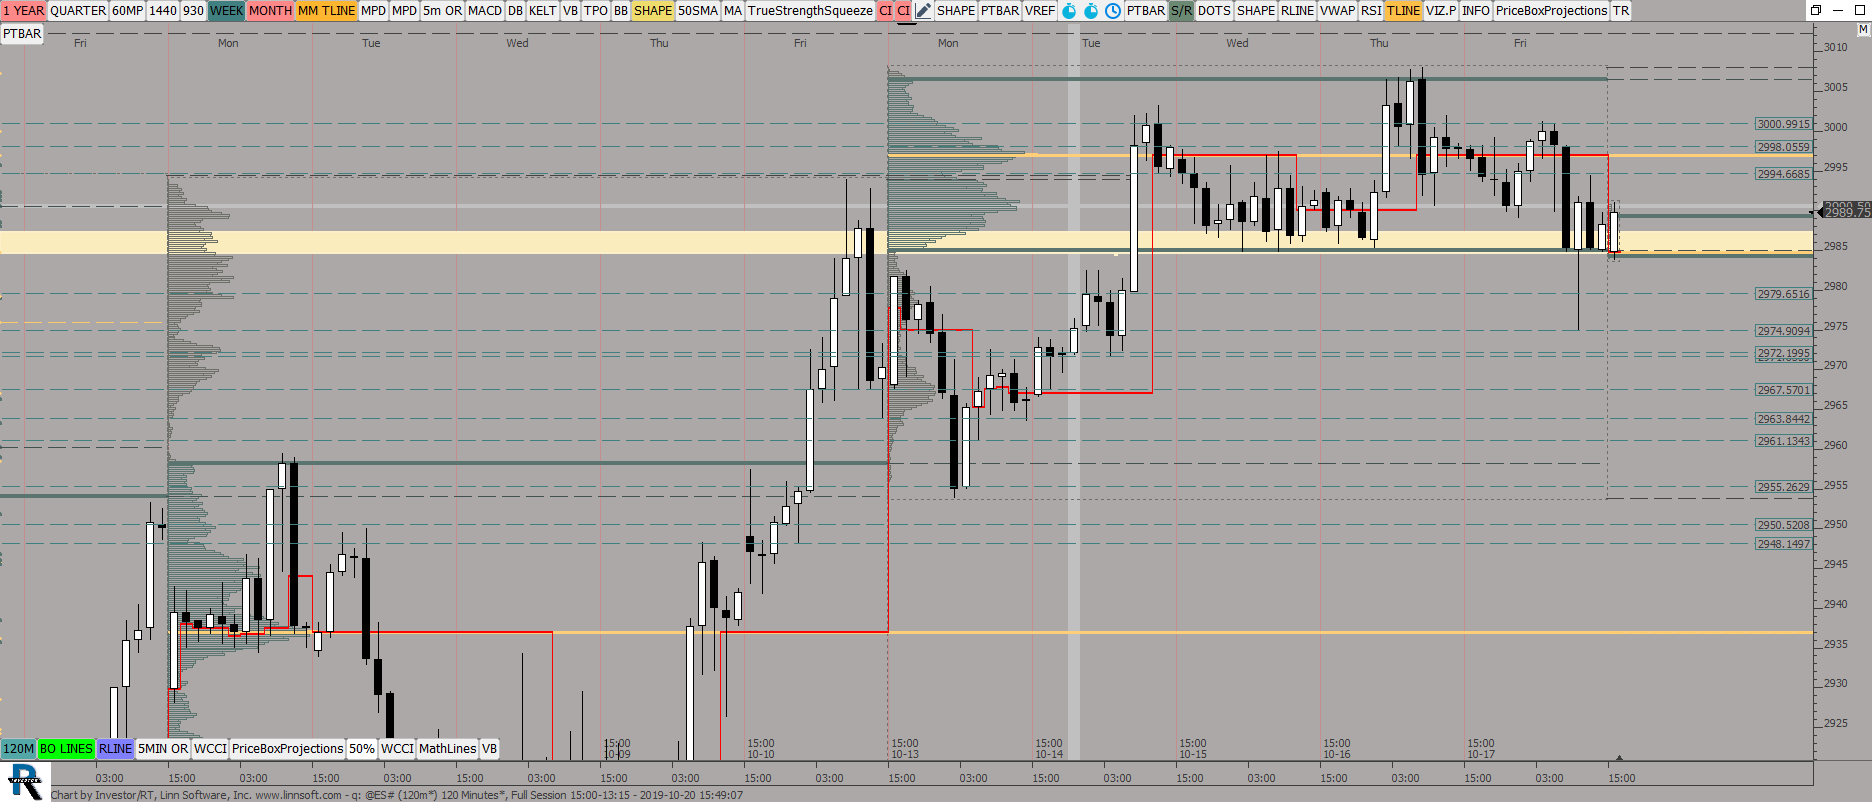 |
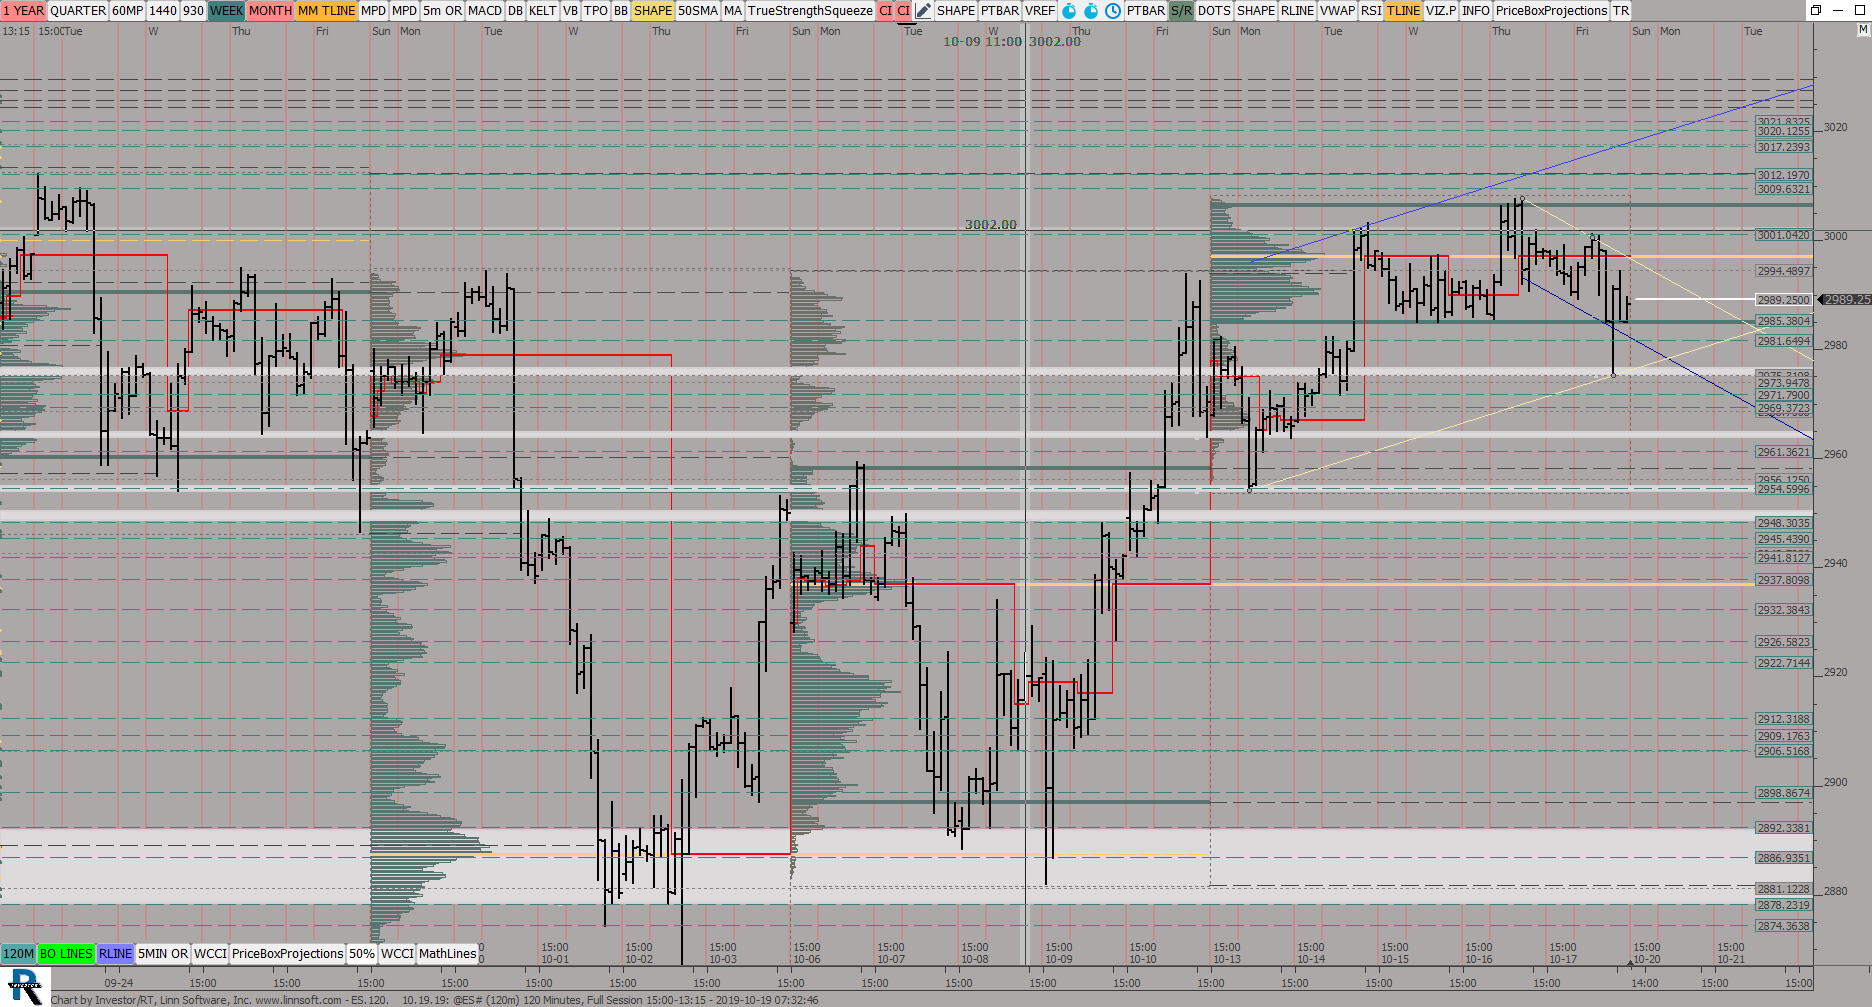
q (@ES#) ES42 [totalcount]
6 years 9 months ago
Weekly VP, 120 Candles. This chart was uploaded by Investor/RT 13.6.3 showing symbol: @ES#. |
View |
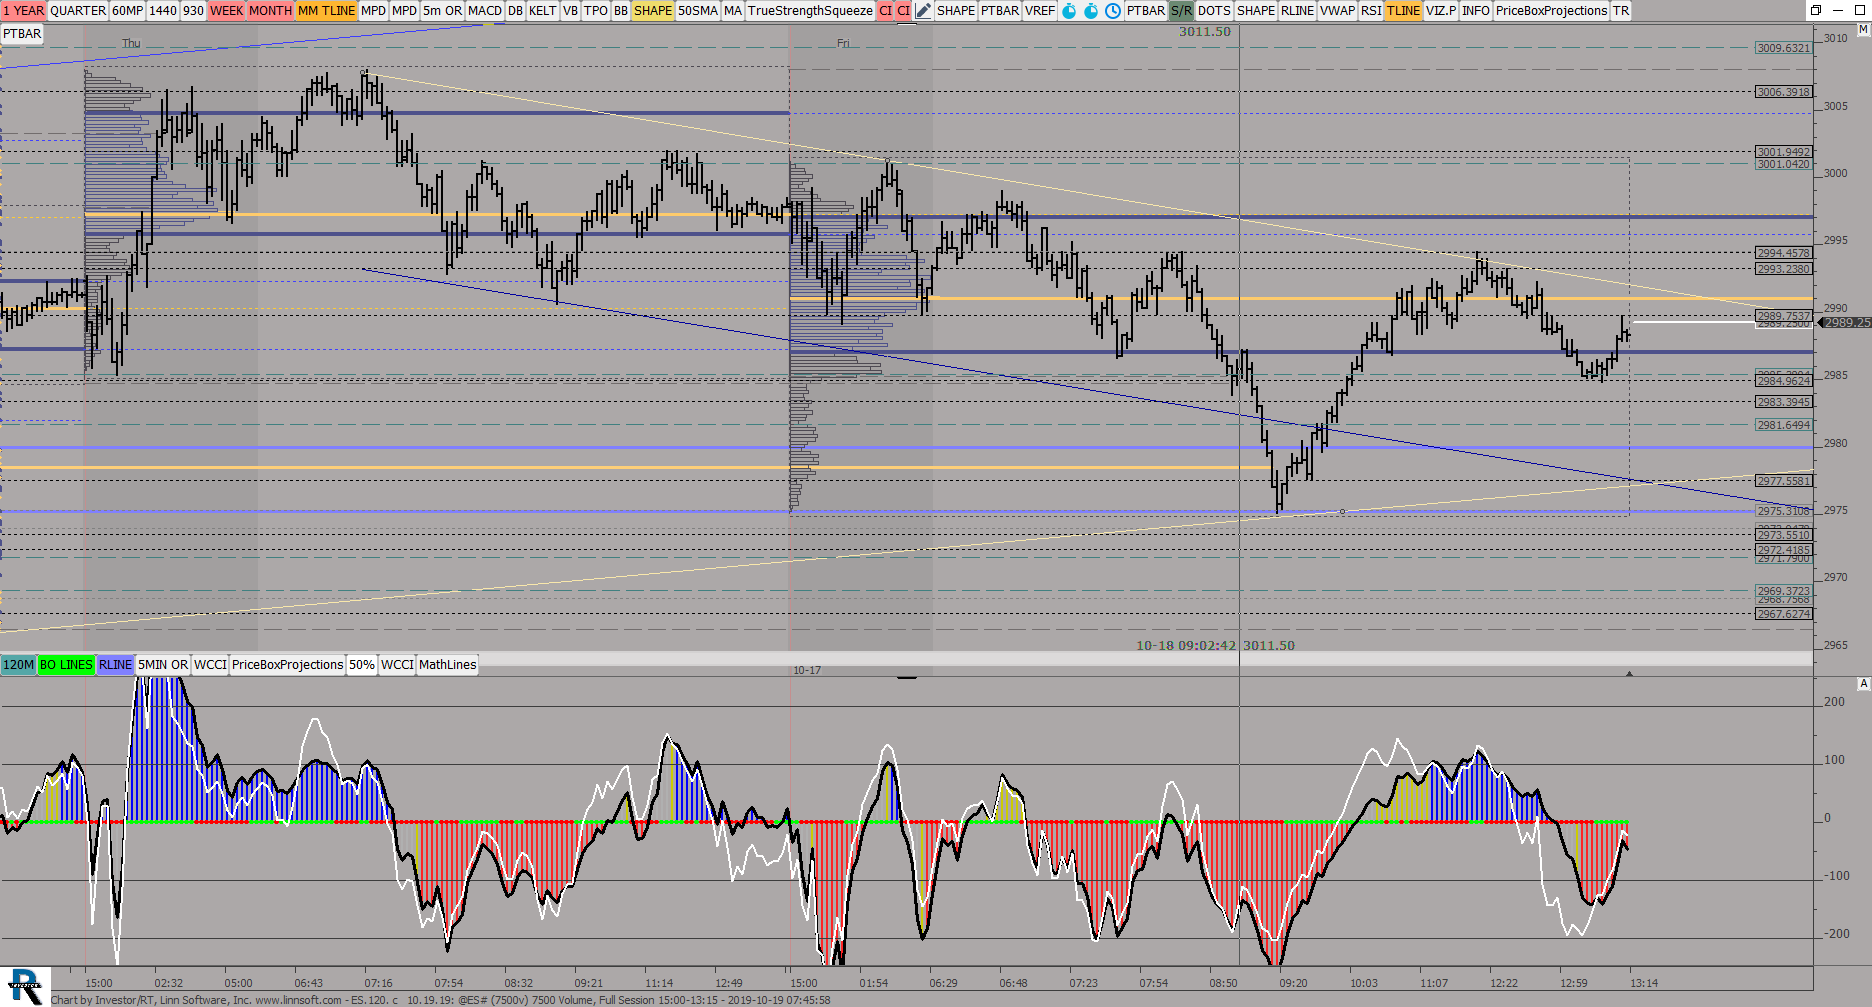 |
ES120 c (@ES#) ES42 [totalcount]
6 years 9 months ago
Daily VP, Entry Candles. This chart was uploaded by Investor/RT 13.6.3 showing symbol: @ES#. |
View |
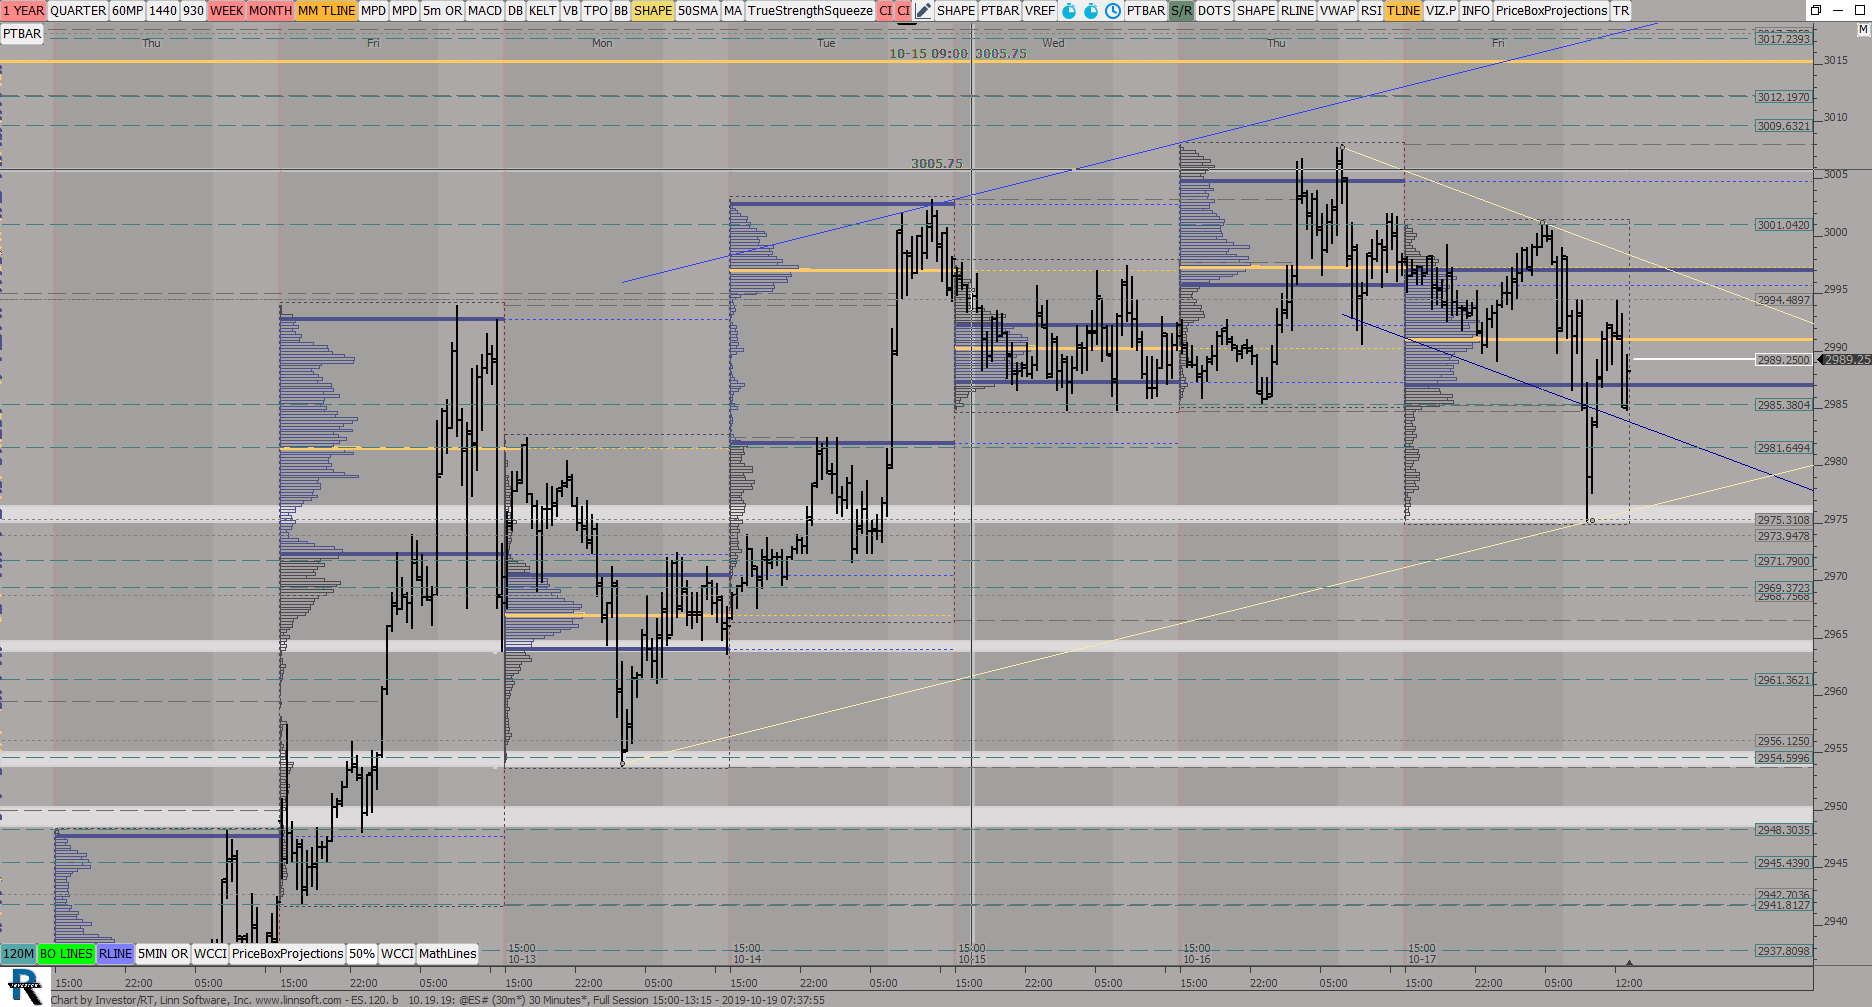 |
ES120 b (@ES#) ES42 [totalcount]
6 years 9 months ago
Daily VP, 30 Min Candles. This chart was uploaded by Investor/RT 13.6.3 showing symbol: @ES#. |
View |
 |
ES120 a (@ES#) ES42 [totalcount]
6 years 9 months ago
WeeklyV Profiles, 120 Min Candles. This chart was uploaded by Investor/RT 13.6.3 showing symbol: @ES#. |
View |
 |
ES120 (@ES#) ES42 [totalcount]
6 years 9 months ago
Weekly V Profiles, 120 Min Candles. This chart was uploaded by Investor/RT 13.6.3 showing symbol: @ES#. |
View |
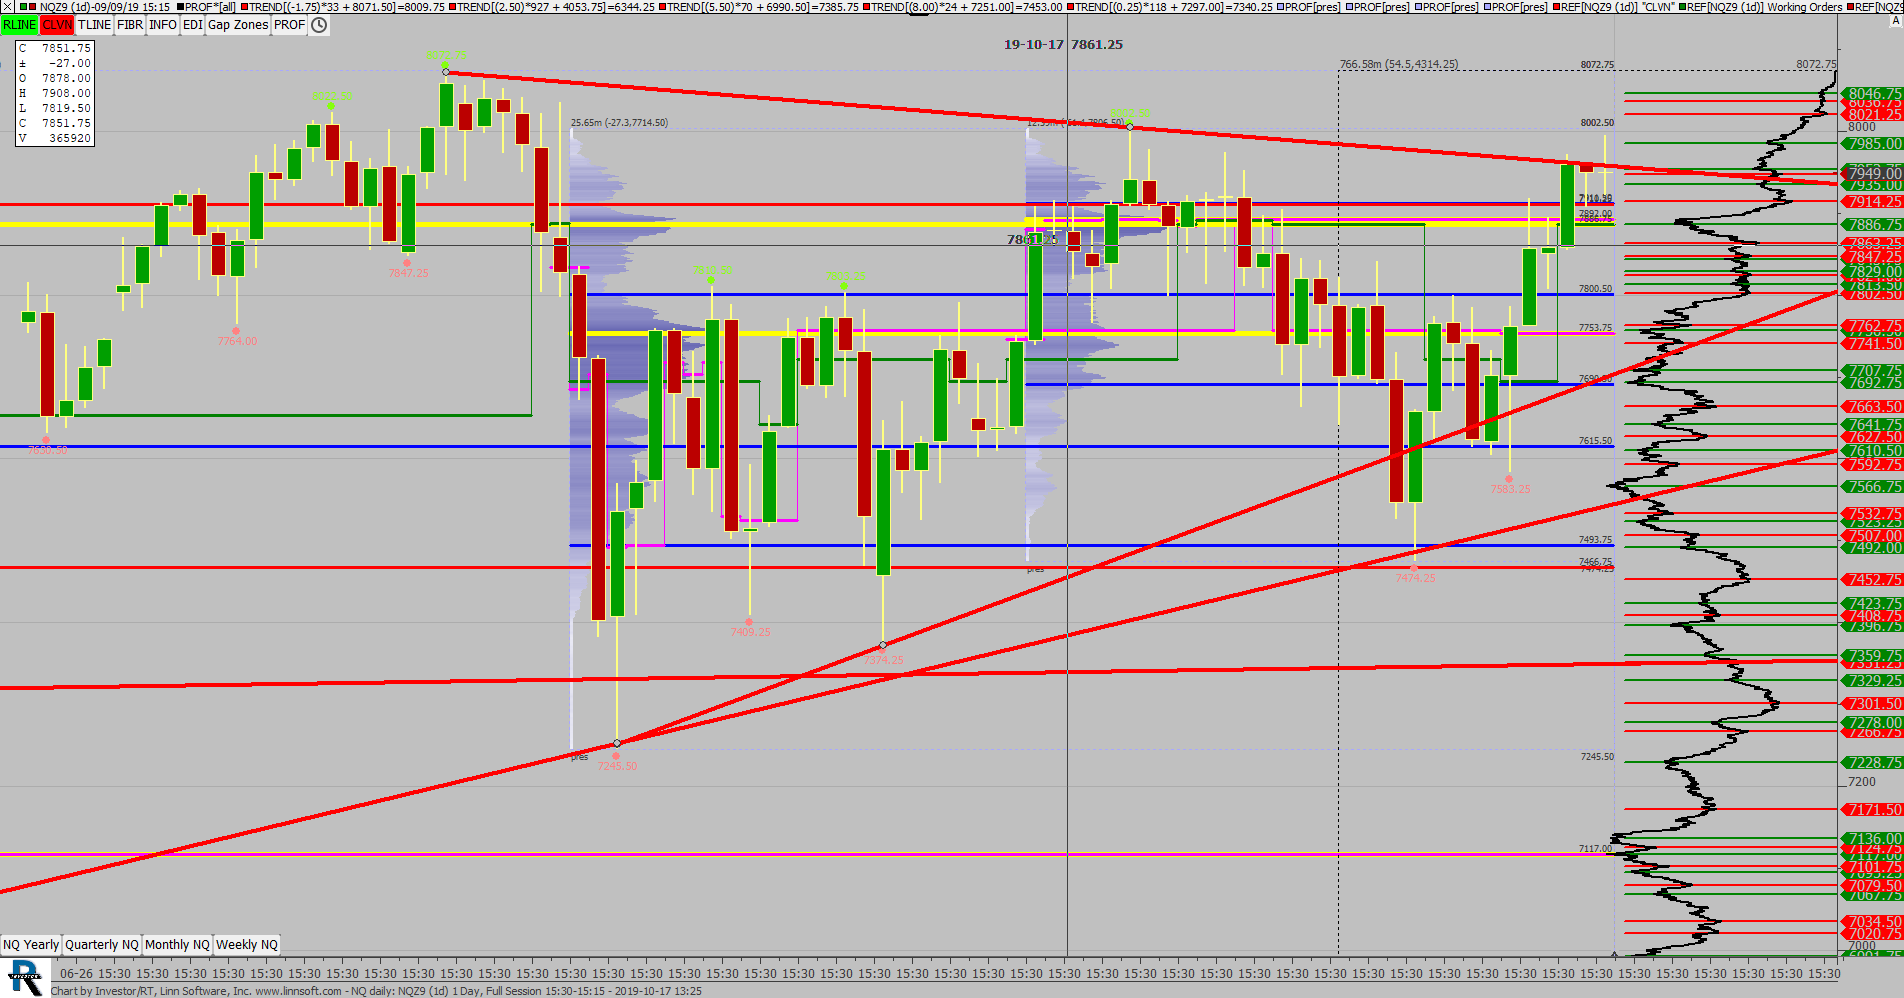 |
NQ daily (NQZ9) scottz46 [totalcount]
6 years 9 months ago
This chart was uploaded by Investor/RT 13.6.2 showing symbol: NQZ9. |
View |
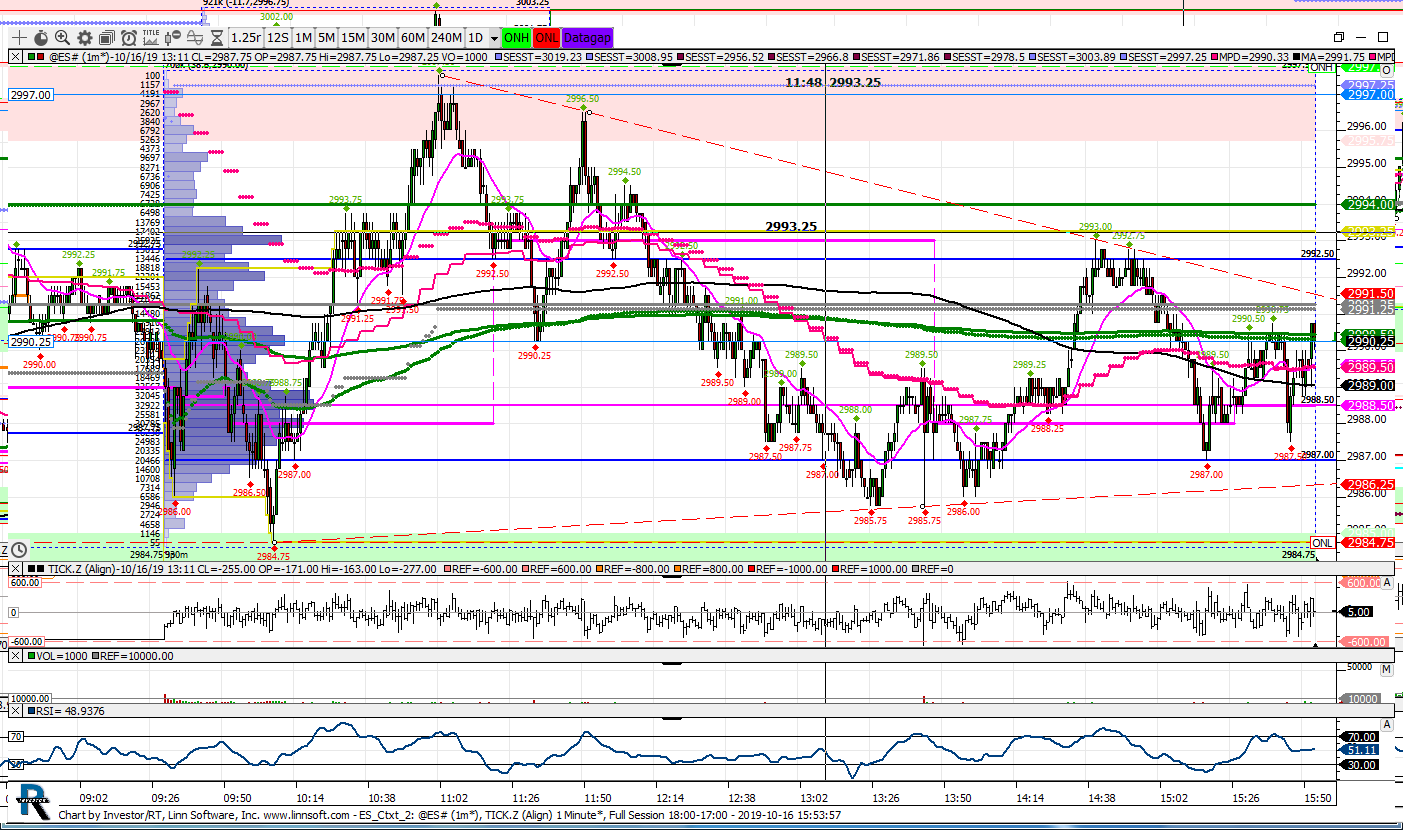 |
ES Ctxt 2 (@ES#) npettinato [totalcount]
6 years 9 months ago
This chart was uploaded by Investor/RT 13.5.24 showing symbol: @ES#. |
View |
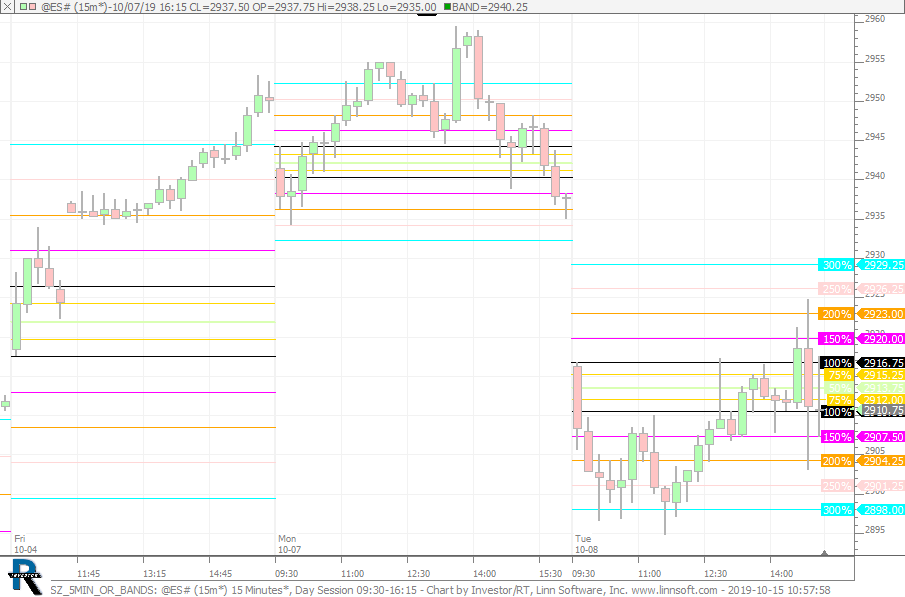 |
SZ 5MIN OR BANDS (@ES#) cpayne [totalcount]
6 years 9 months ago
Bands off 1st 5min of session. This chart was uploaded by Investor/RT 13.6.5 showing symbol: @ES#. |
View |
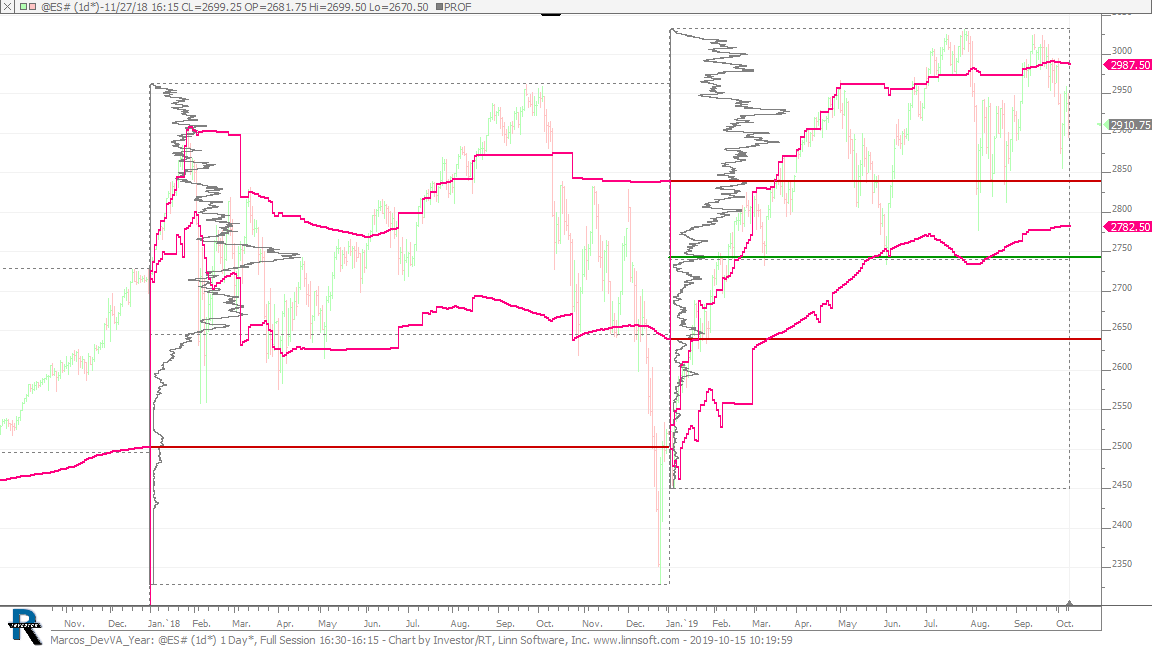 |
Marcos DevVA Year (@ES#) cpayne [totalcount]
6 years 9 months ago
Yearly Developing Value Area. This chart was uploaded by Investor/RT 13.6.5 showing symbol: @ES#. |
View |
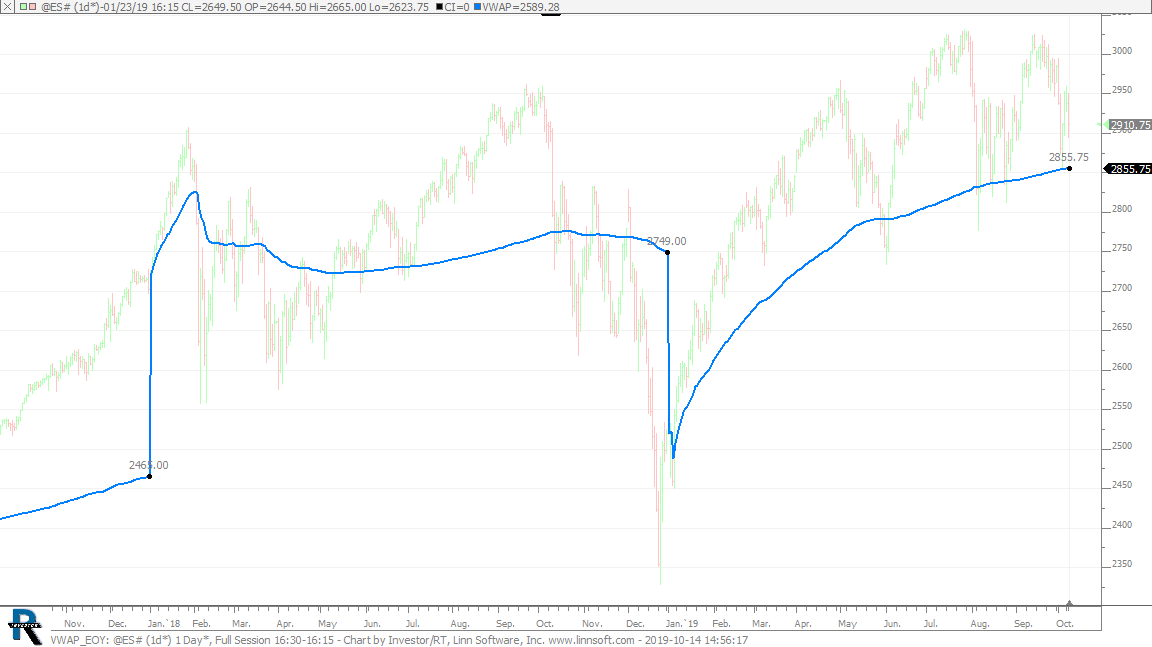 |
VWAP EOY (@ES#) cpayne [totalcount]
6 years 9 months ago
End of Year VWAP. This chart was uploaded by Investor/RT 13.6.5 showing symbol: @ES#. |
View |
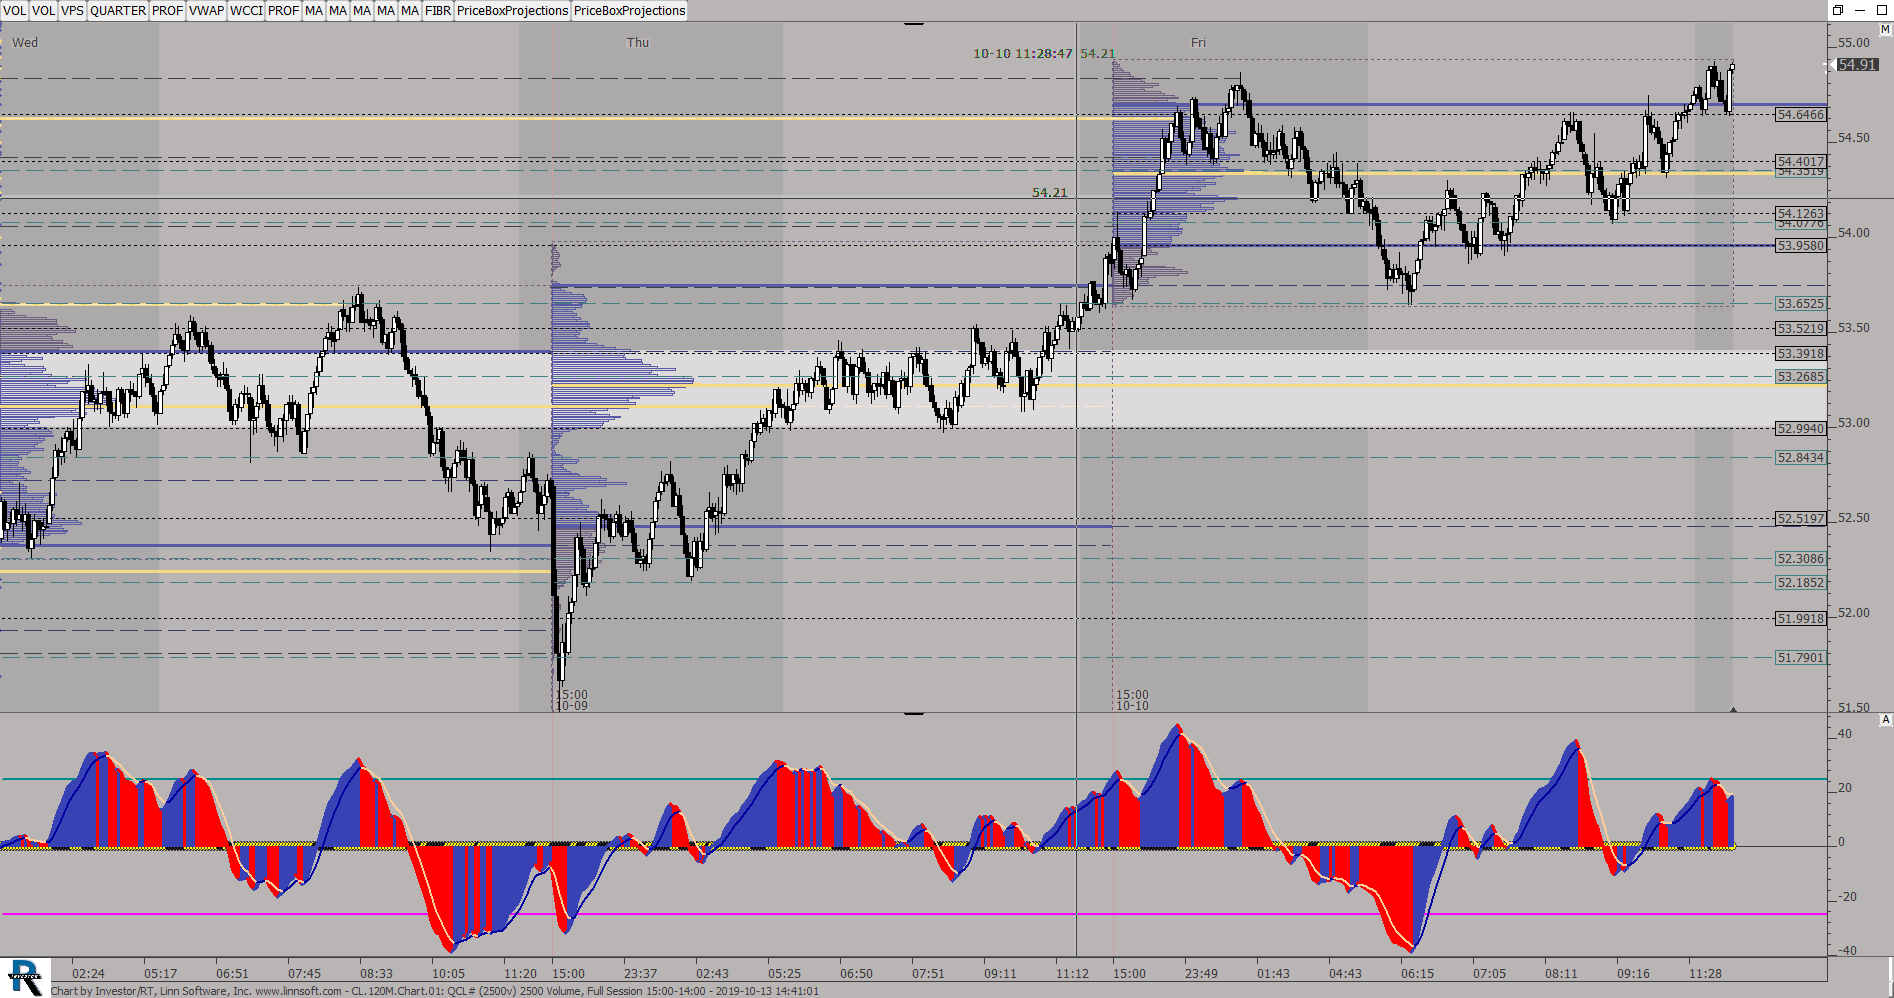 |
CL120MChart (QCL#) ES42 [totalcount]
6 years 9 months ago
Weekly Profiles, 120M candles. This chart was uploaded by Investor/RT 13.5.24 showing symbol: QCL#. |
View |
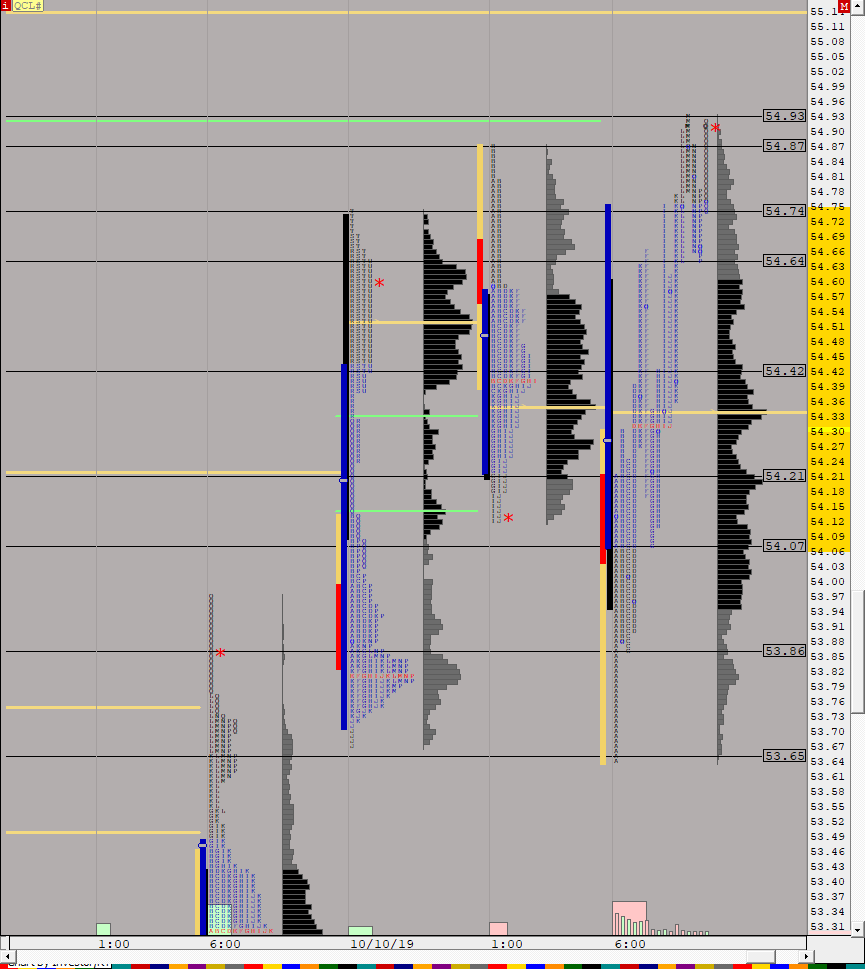 |
CL Day (QCL#) ES42 [totalcount]
6 years 9 months ago
Daily TPO Profiles, 30 Min Candles. This chart was uploaded by Investor/RT 13.6.3 showing symbol: QCL#. |
View |
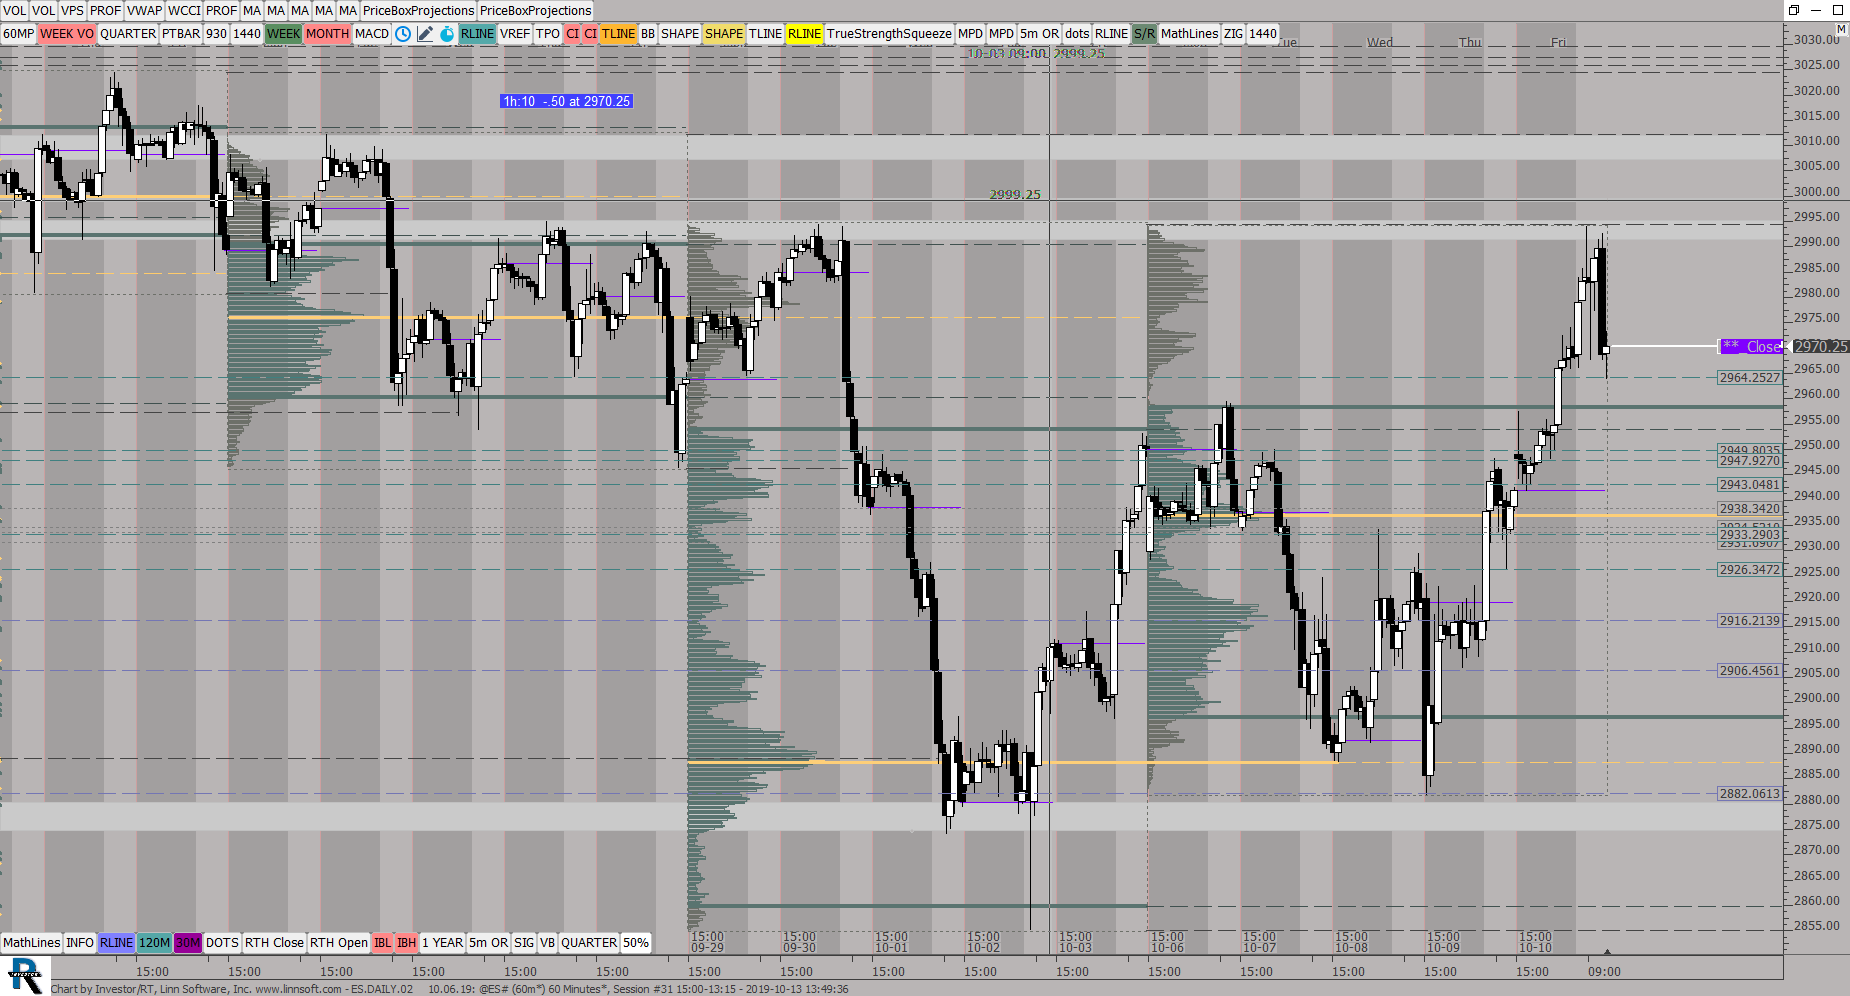 |
ESDAILY02 (@ES#) ES42 [totalcount]
6 years 9 months ago
Weekly VP, 60 Min Candles. This chart was uploaded by Investor/RT 13.6.3 showing symbol: @ES#. |
View |
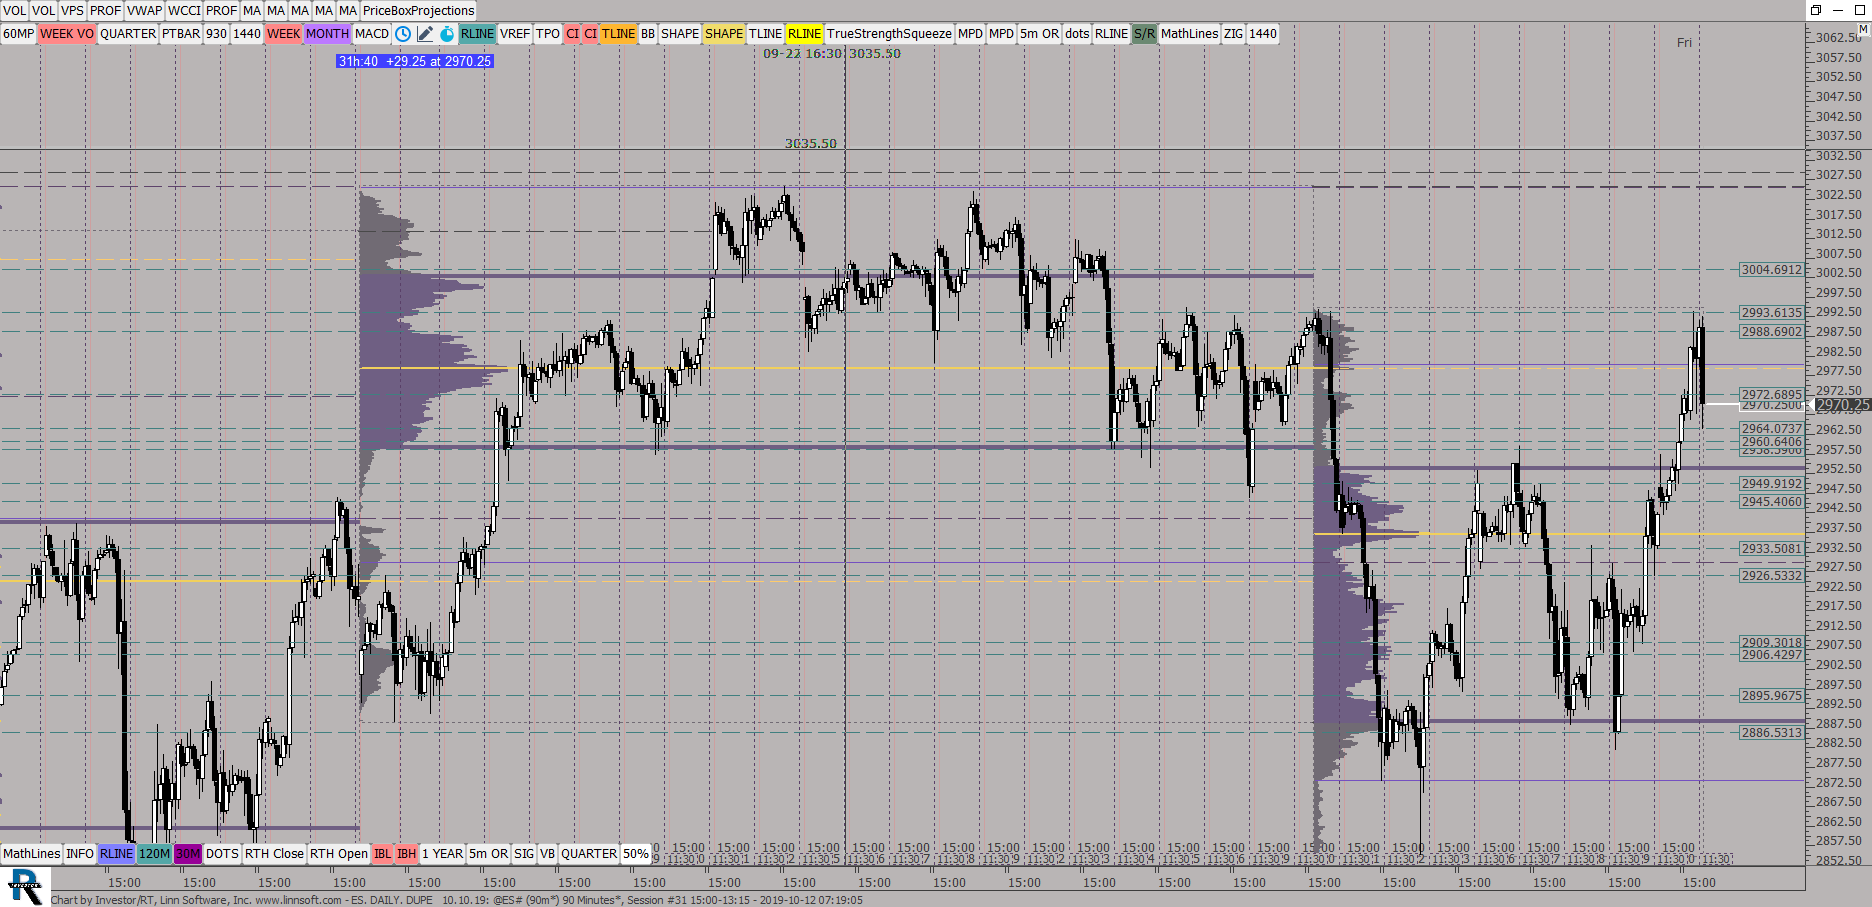 |
ES DAILY DUPE (@ES#) ES42 [totalcount]
6 years 9 months ago
Monthly VP, 90 Min Candles. This chart was uploaded by Investor/RT 13.6.3 showing symbol: @ES#. |
View |
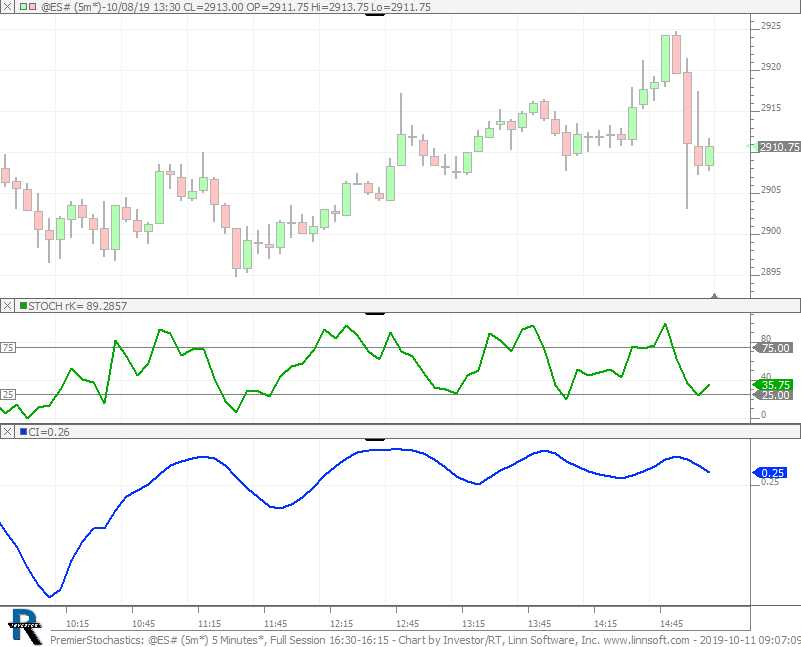 |
PremierStochastics (@ES#) cpayne [totalcount]
6 years 9 months ago
Premier Stochastics. This chart was uploaded by Investor/RT 13.6.4 showing symbol: @ES#. |
View |
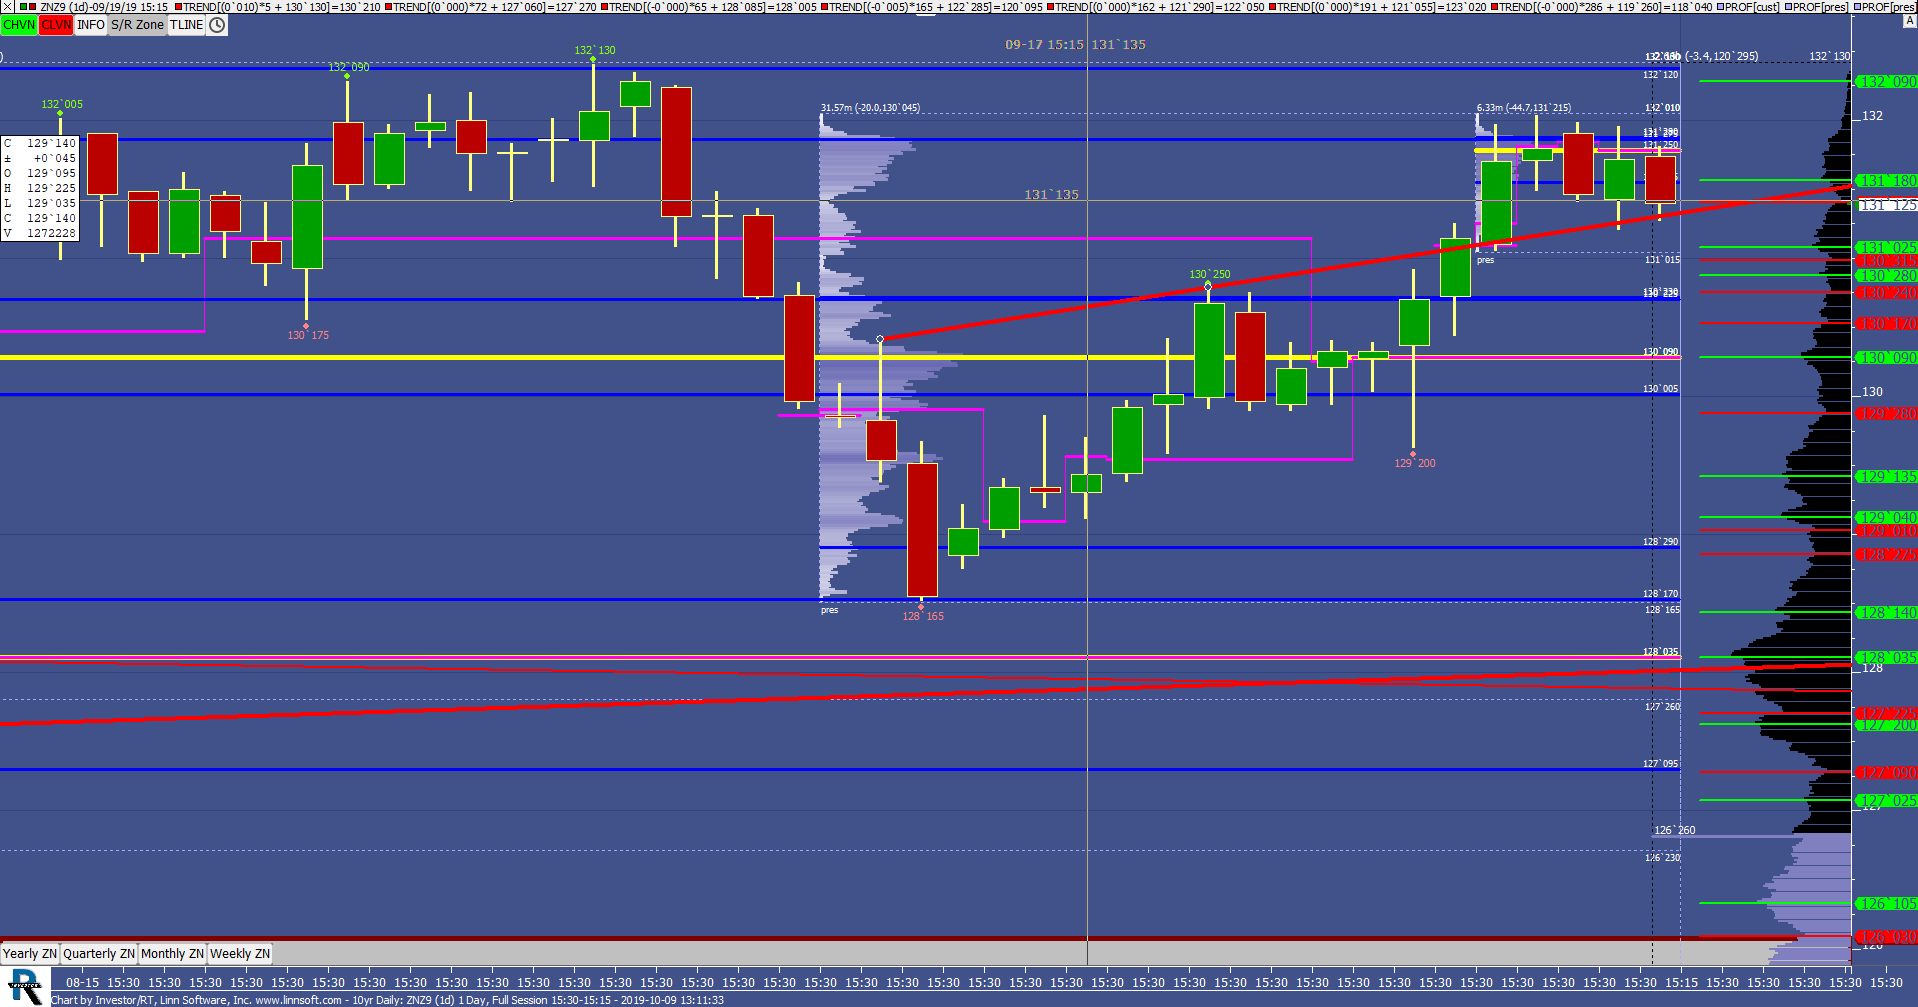 |
10yr Daily (ZNZ9) scottz46 [totalcount]
6 years 9 months ago
This chart was uploaded by Investor/RT 13.6.3 showing symbol: ZNZ9. |
View |
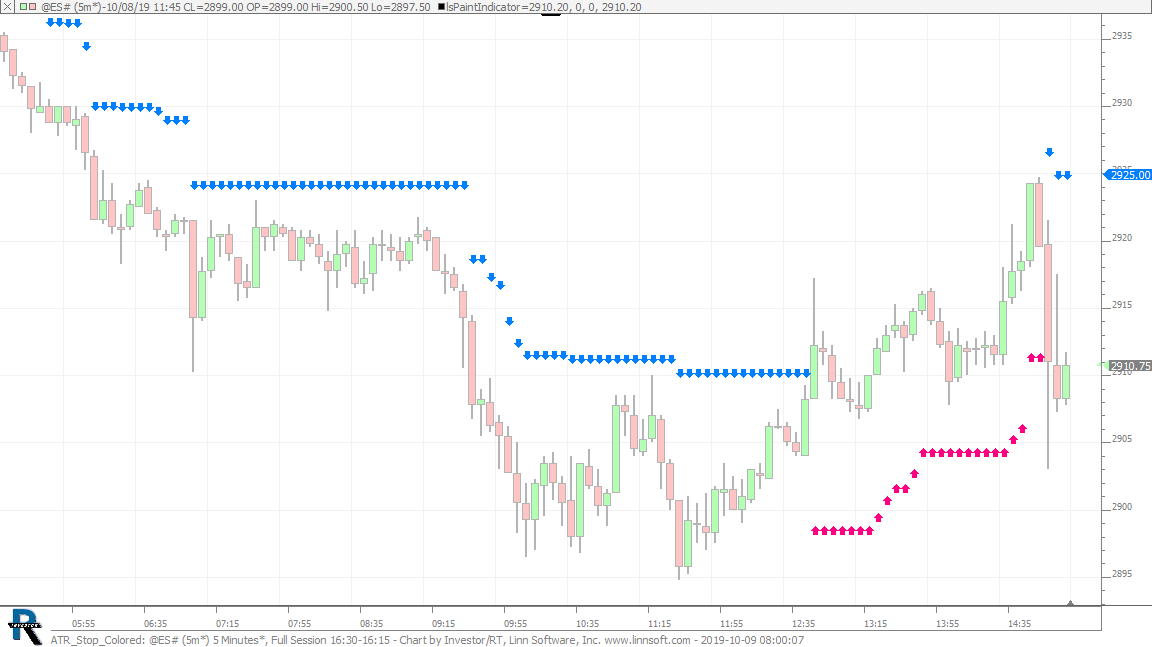 |
ATR Stop Colored (@ES#) cpayne [totalcount]
6 years 9 months ago
This chart was uploaded by Investor/RT 13.6.1 showing symbol: @ES#. |
View |
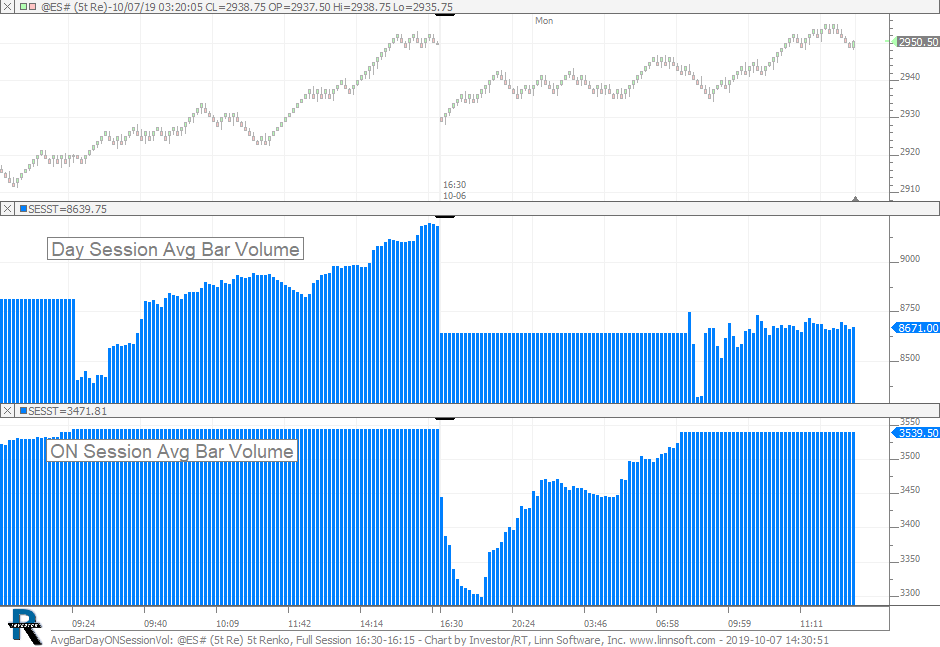 |
AvgBarDayONSessionVol (@ES#) cpayne [totalcount]
6 years 9 months ago
This chart was uploaded by Investor/RT 13.6.1 showing symbol: @ES#. |
View |
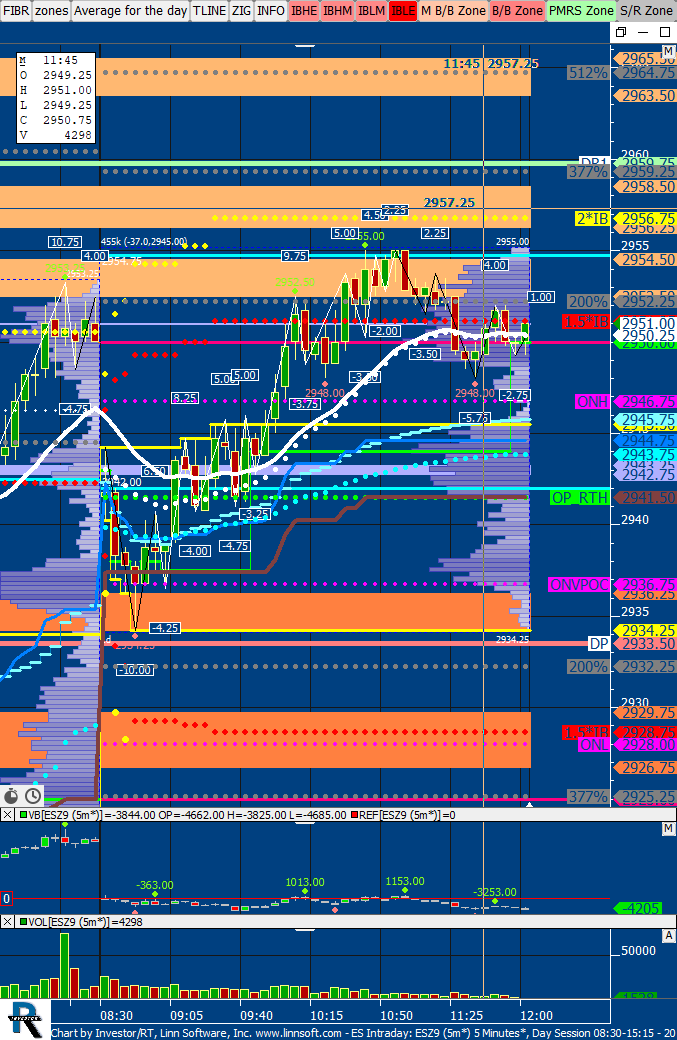 |
ES Intraday (ESZ9) scottz46 [totalcount]
6 years 9 months ago
This chart was uploaded by Investor/RT 13.6.3 showing symbol: ESZ9. |
View |
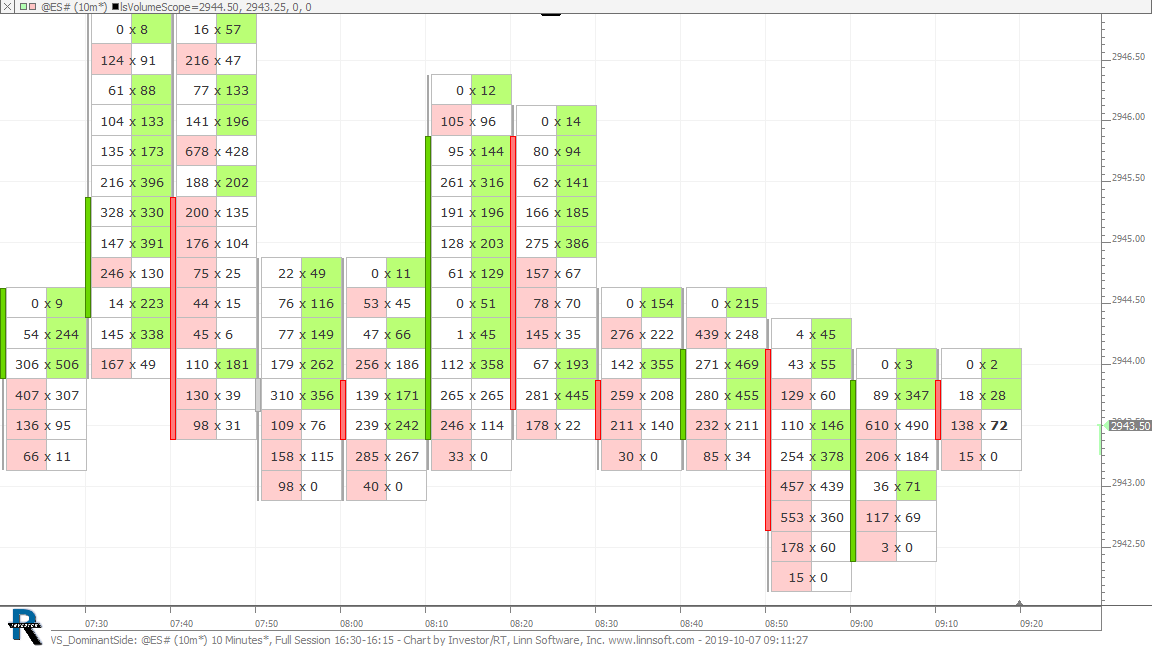 |
VS DominantSide (@ES#) cpayne [totalcount]
6 years 9 months ago
This chart was uploaded by Investor/RT 13.6.1 showing symbol: @ES#. |
View |
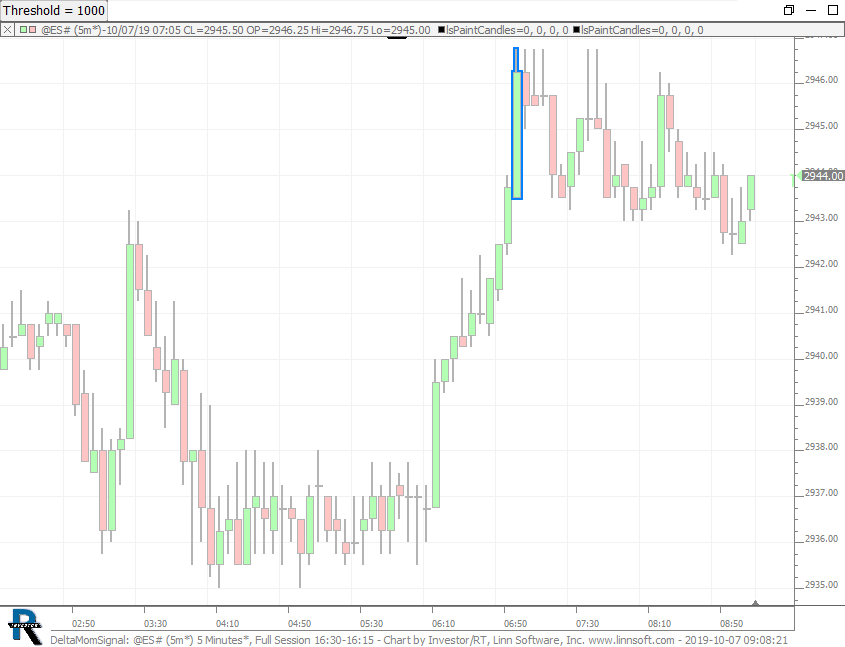 |
DeltaMomSignal (@ES#) cpayne [totalcount]
6 years 9 months ago
Delta Momentum Signals. This chart was uploaded by Investor/RT 13.6.1 showing symbol: @ES#. |
View |
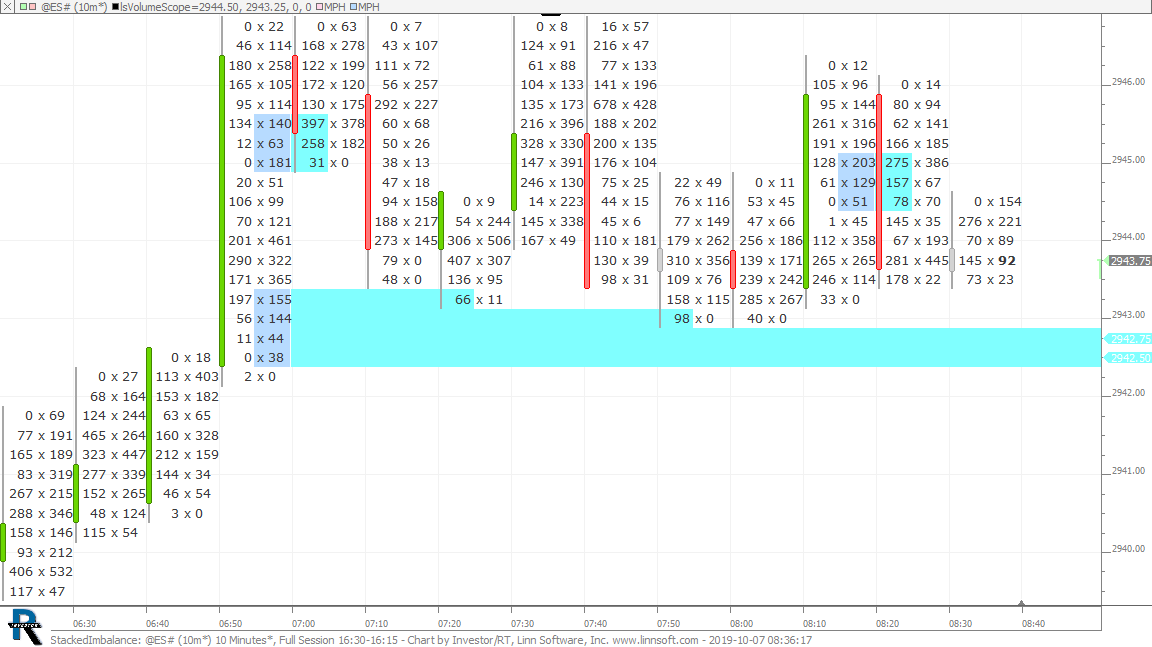 |
StackedImbalance (@ES#) cpayne [totalcount]
6 years 9 months ago
Stacked Imbalance. This chart was uploaded by Investor/RT 13.6.1 showing symbol: @ES#. |
View |