 |
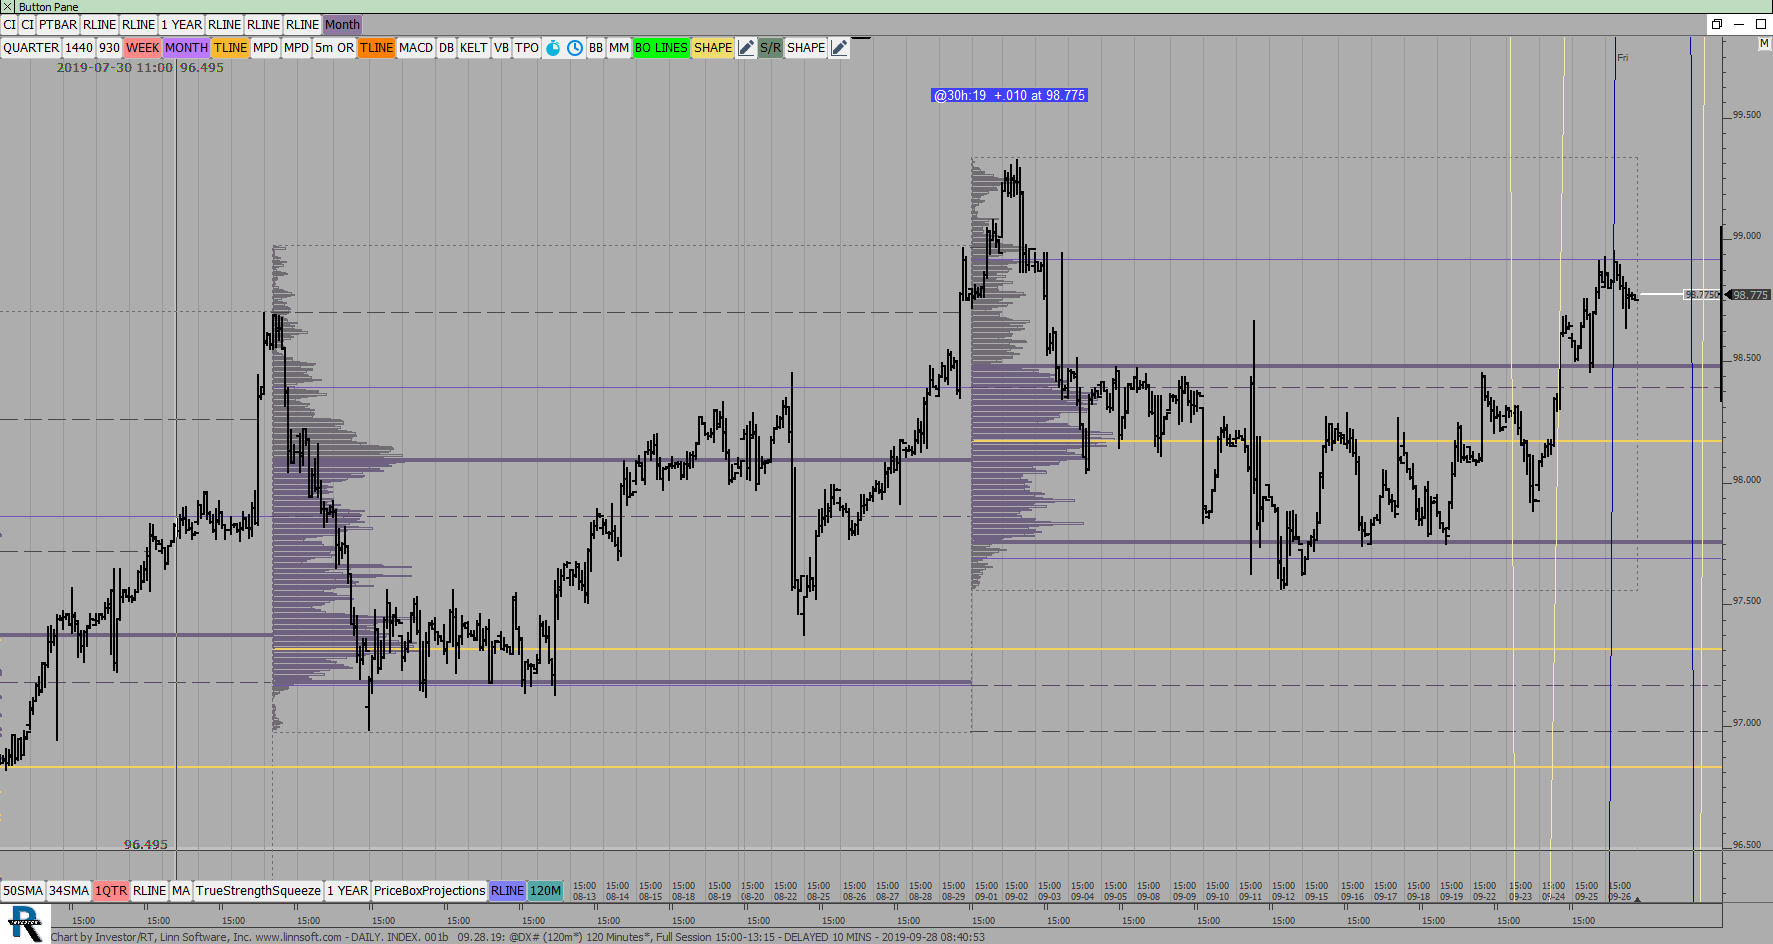
DAILY INDEX 001b (@DX#) ES42 [totalcount]
6 years 10 months ago
YEN Chart. This chart was uploaded by Investor/RT 13.6.3 showing symbol: @DX#. |
View |
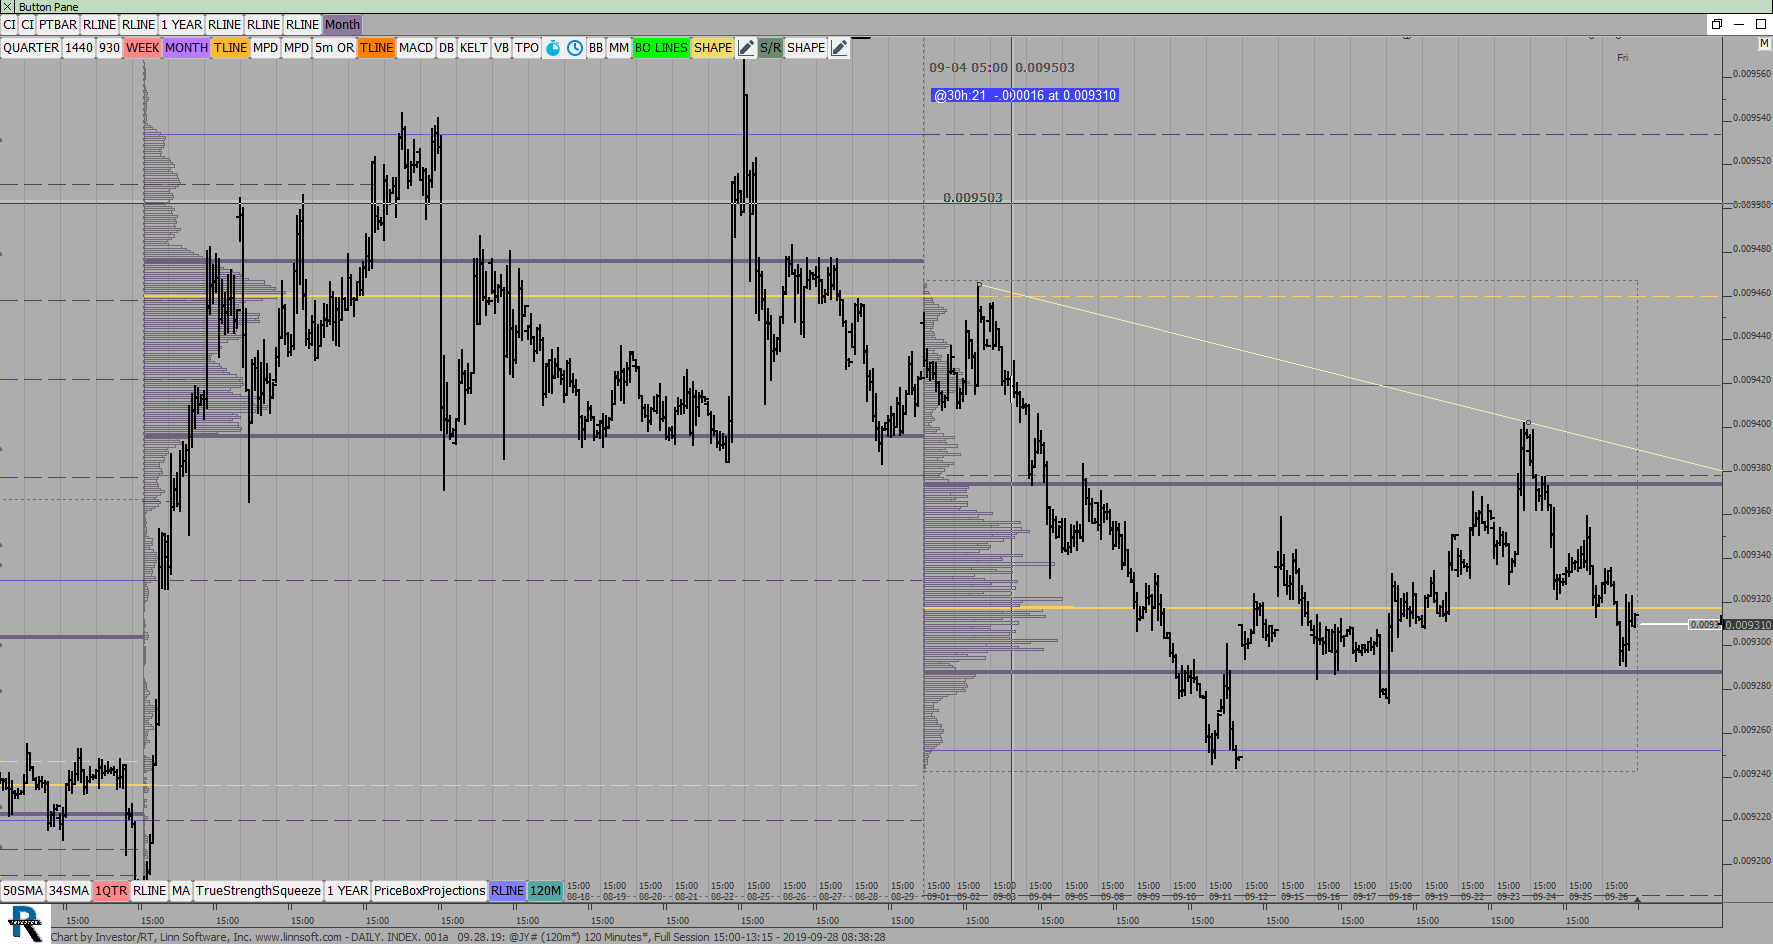 |
DAILY INDEX 001a (@JY#) ES42 [totalcount]
6 years 10 months ago
YEN Chart. This chart was uploaded by Investor/RT 13.6.3 showing symbol: @JY#. |
View |
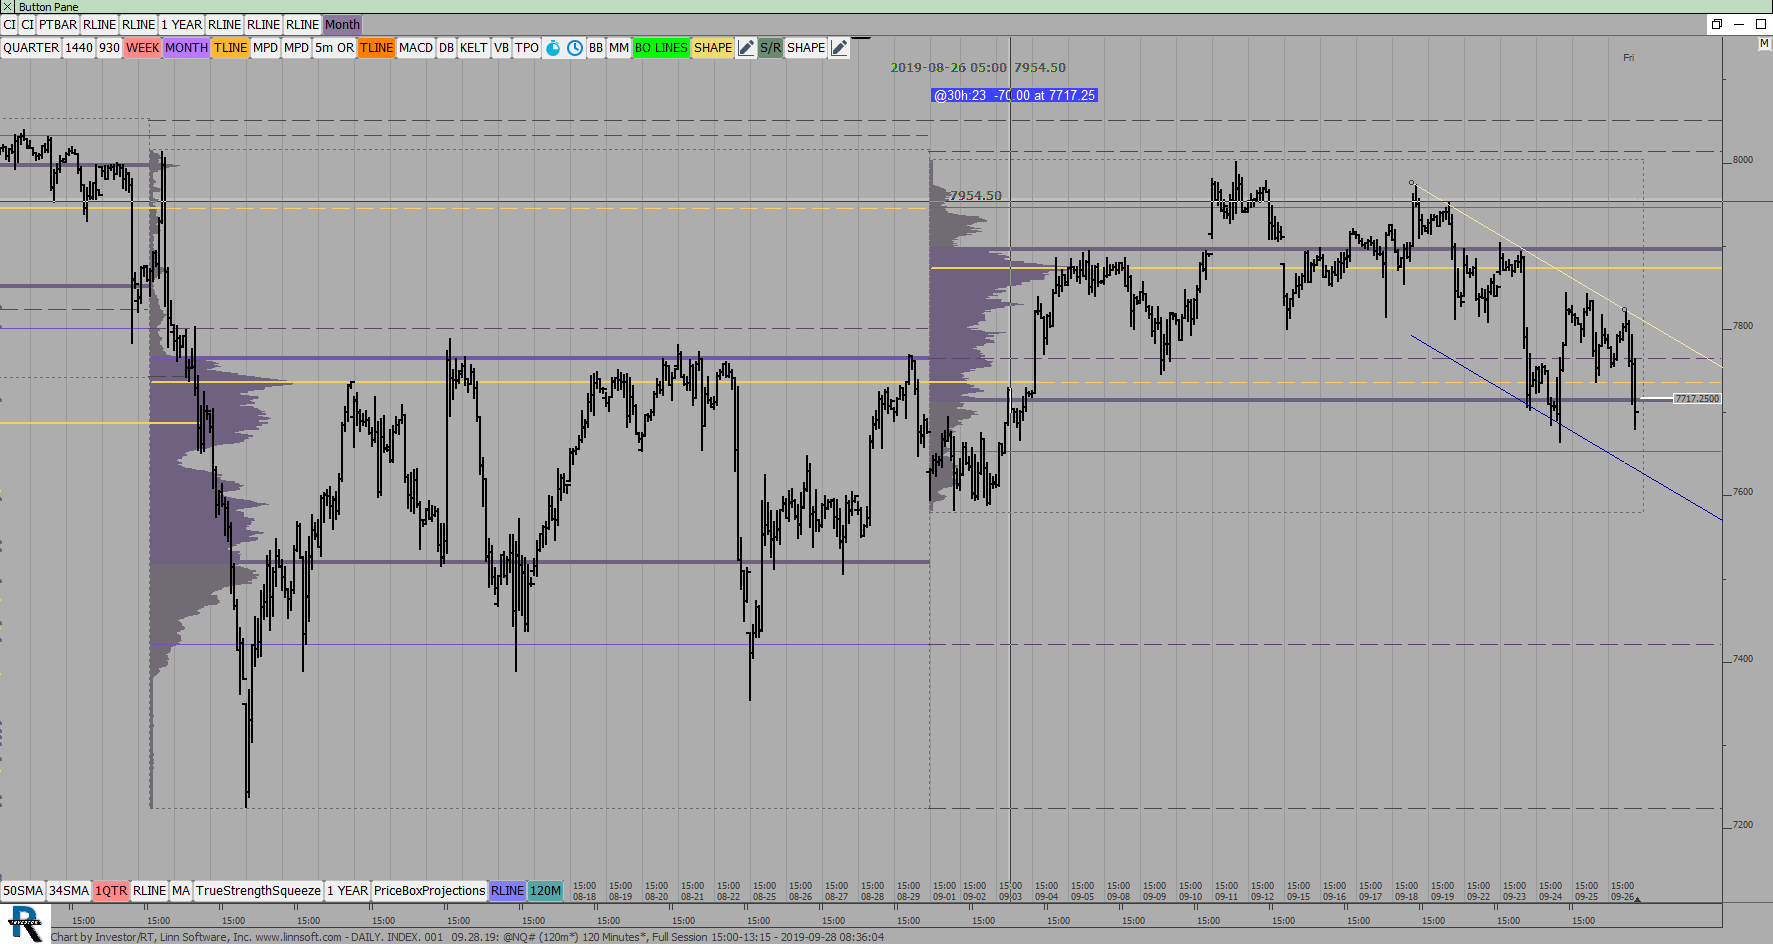 |
DAILY INDEX 001 (@NQ#) ES42 [totalcount]
6 years 10 months ago
NQ Chart. This chart was uploaded by Investor/RT 13.6.3 showing symbol: @NQ#. |
View |
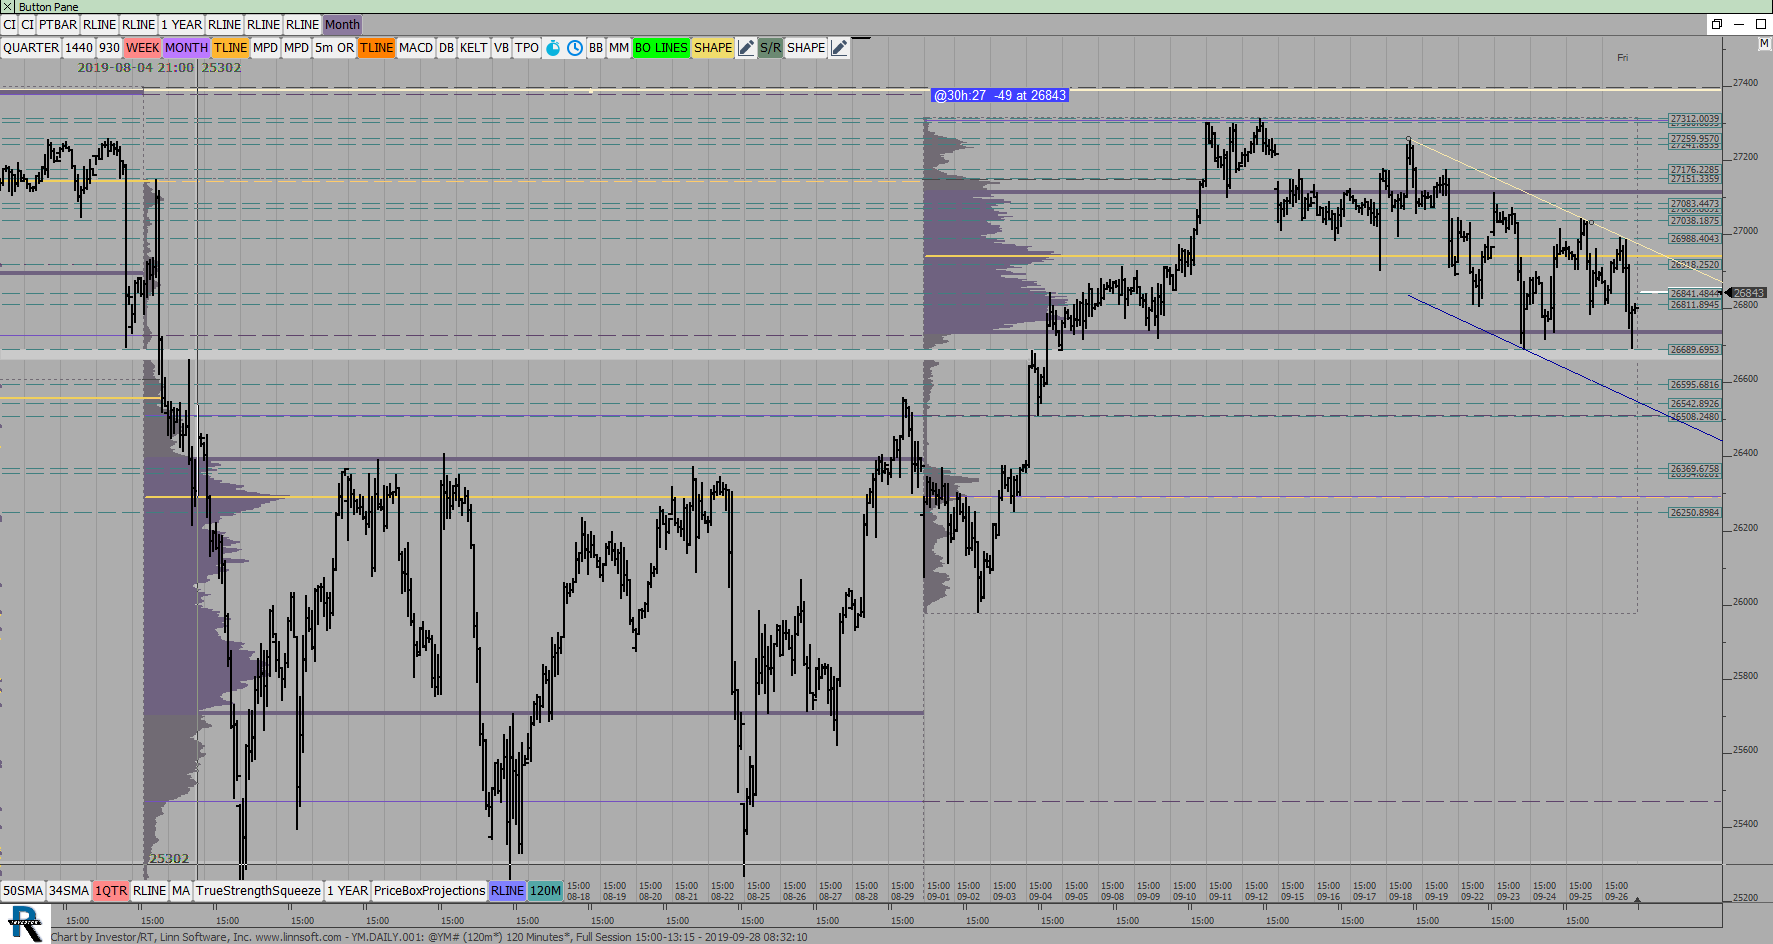 |
YMDAILY (@YM#) ES42 [totalcount]
6 years 10 months ago
This chart was uploaded by Investor/RT 13.6.3 showing symbol: @YM#. |
View |
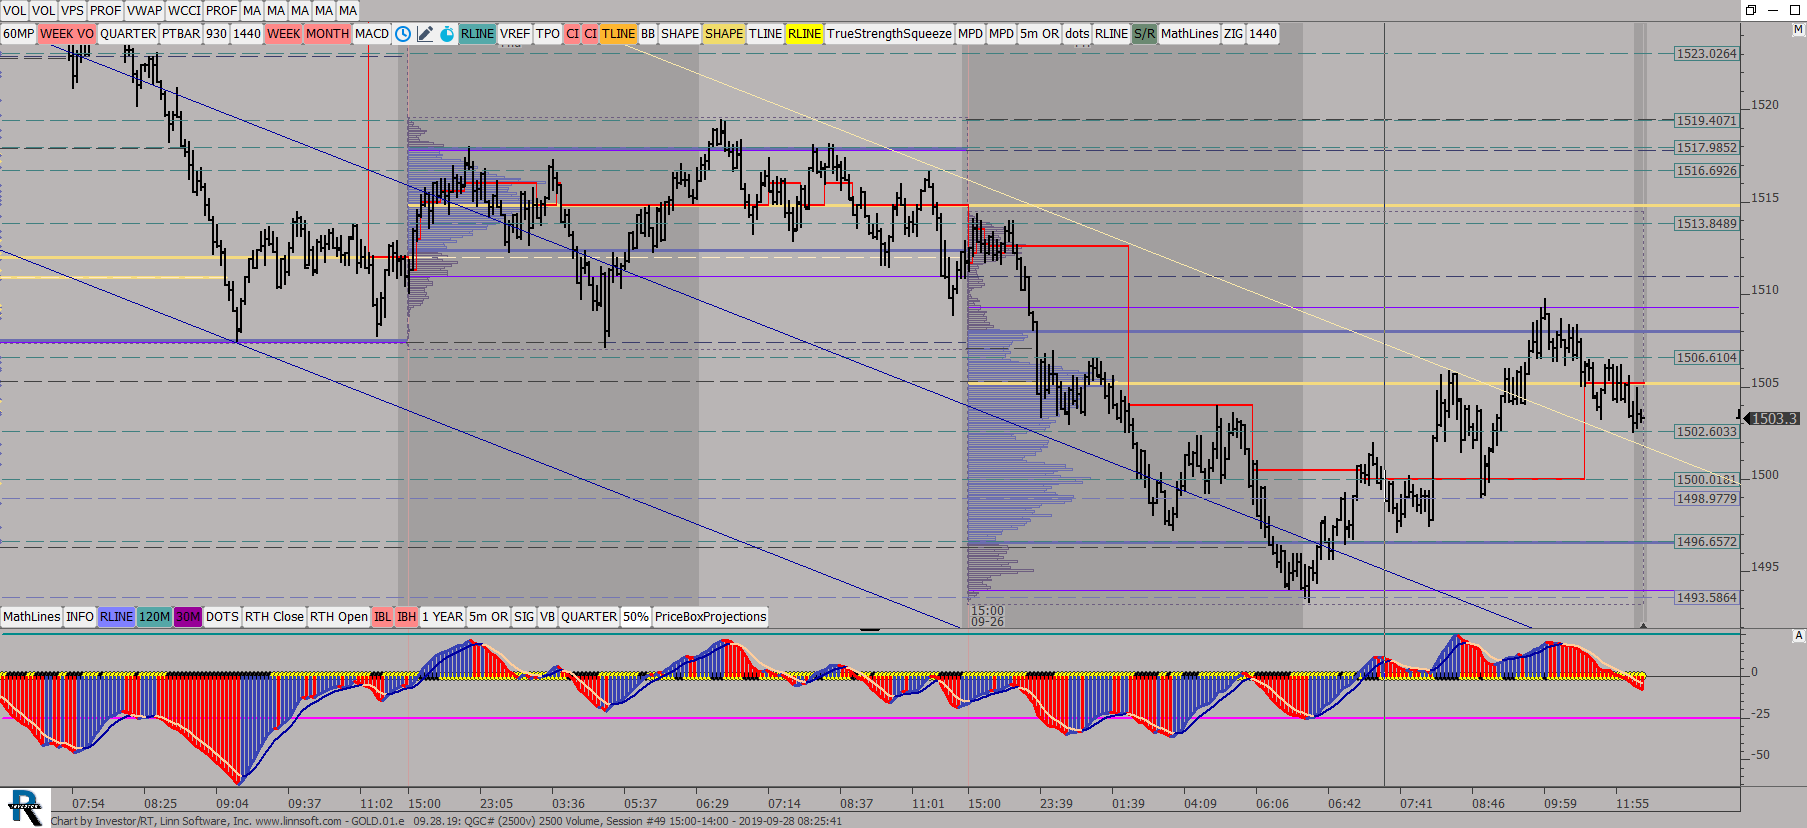 |
GOLD01e (QGC#) ES42 [totalcount]
6 years 10 months ago
Daily VP, Entry Candles. This chart was uploaded by Investor/RT 13.6.3 showing symbol: QGC#. |
View |
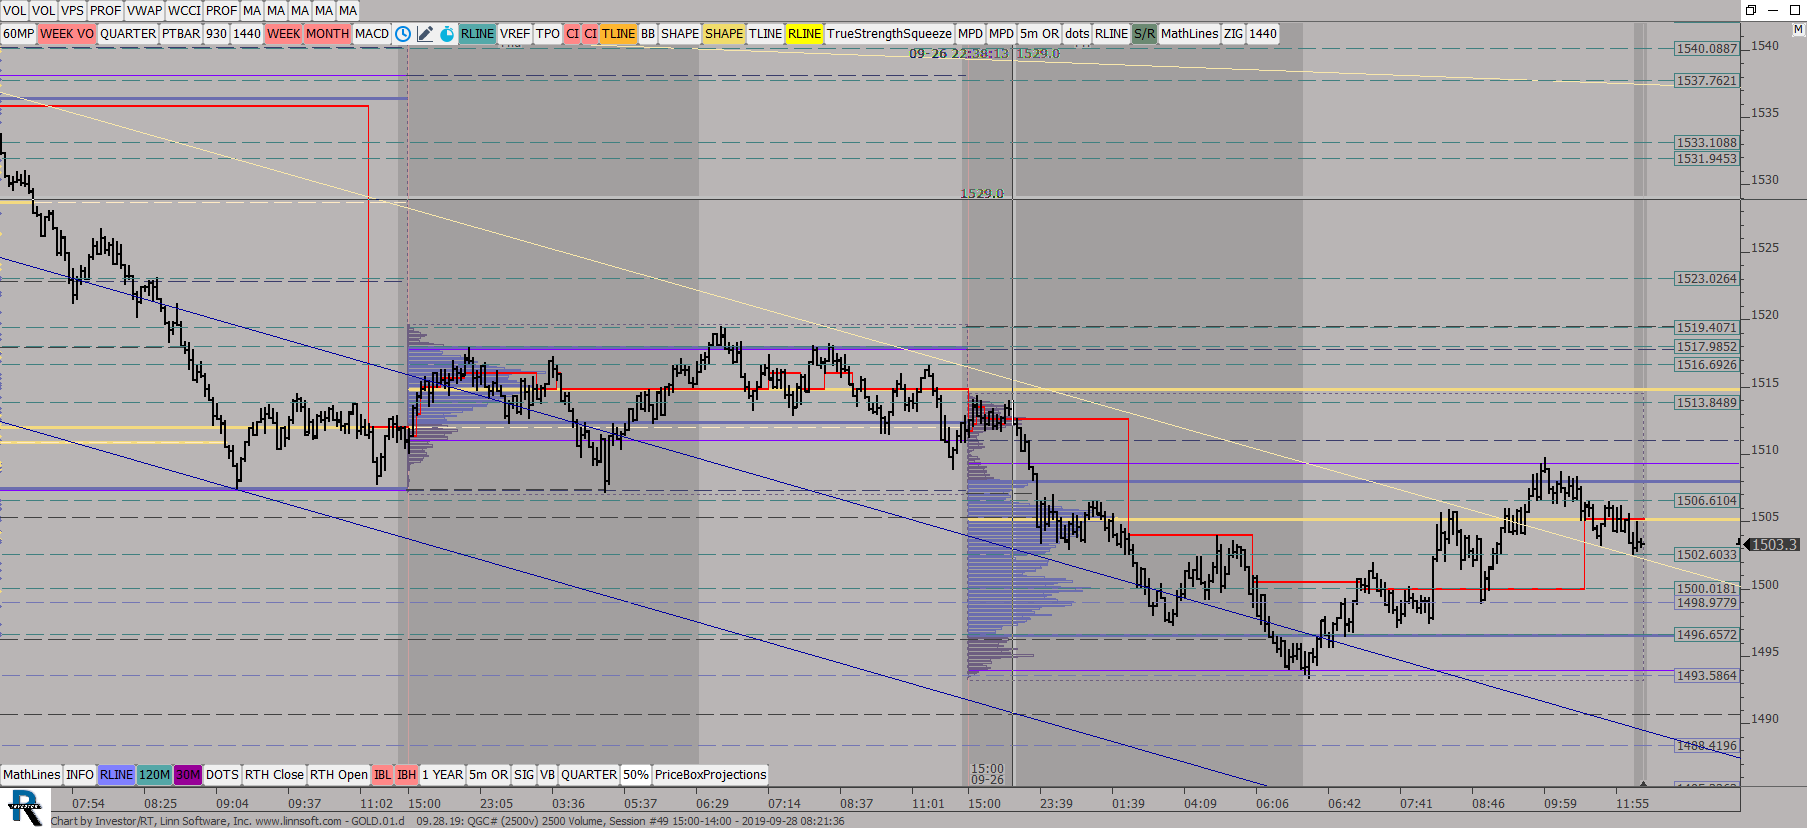 |
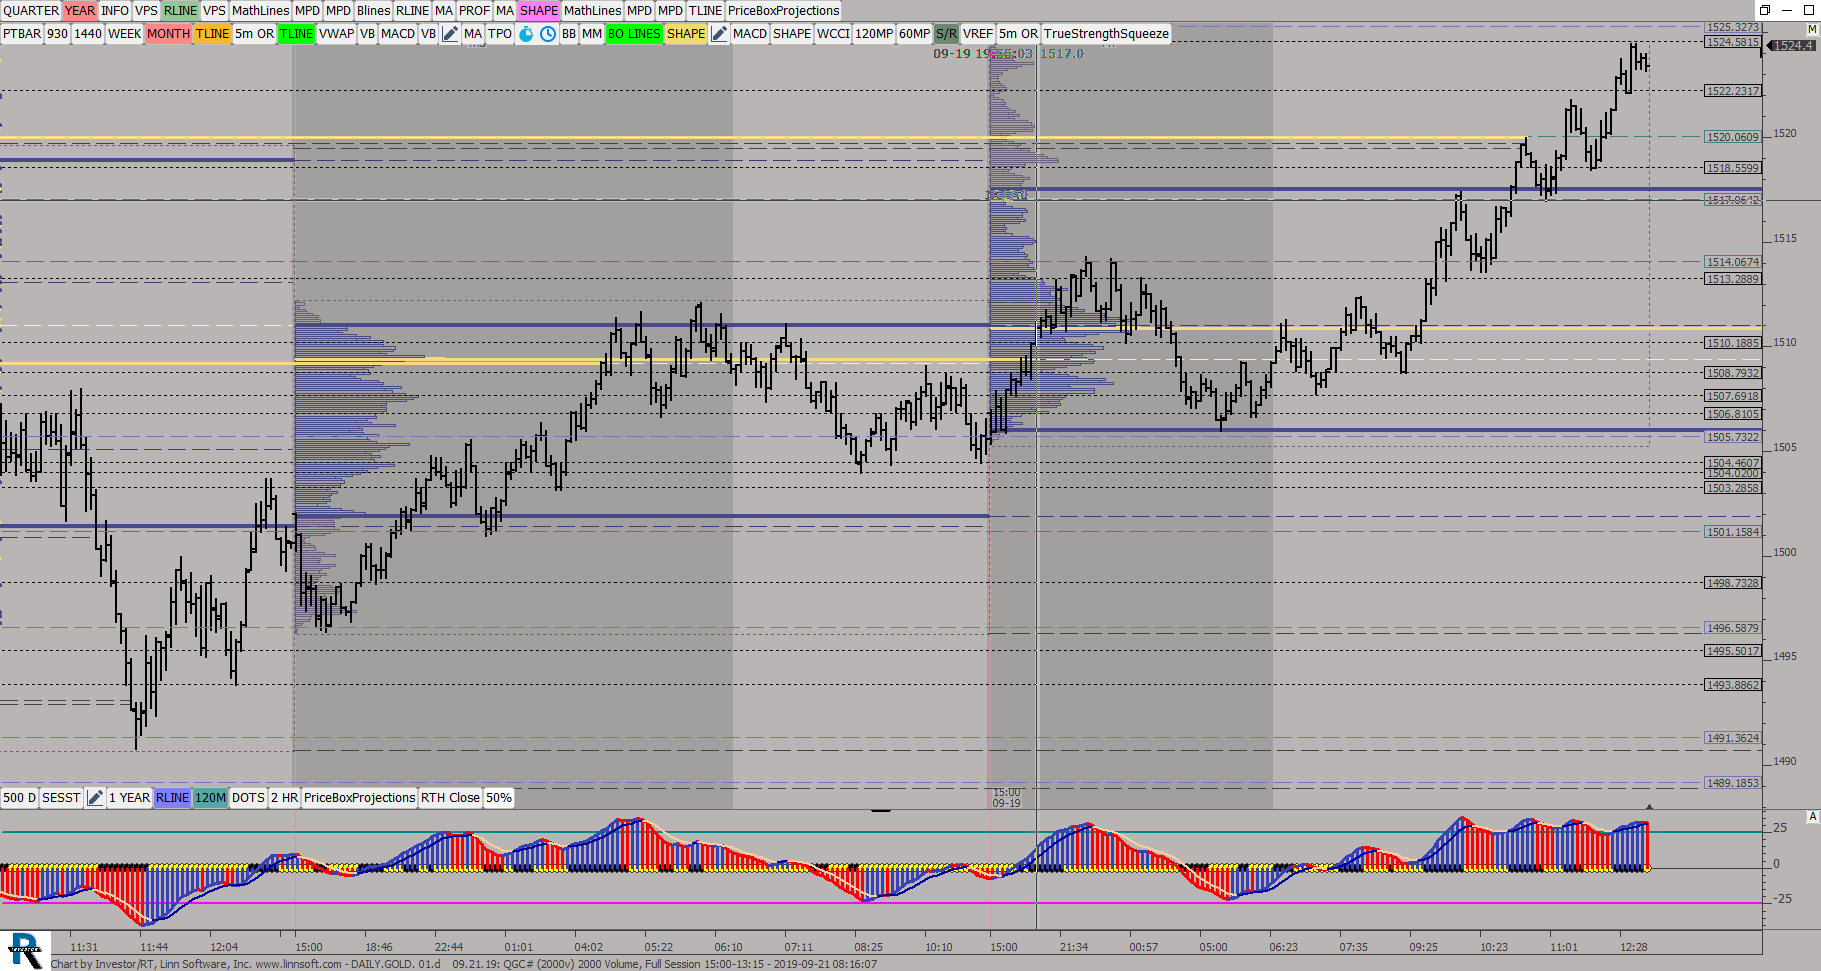
GOLD01d (QGC#) ES42 [totalcount]
6 years 10 months ago
Daily VP, Entry Candles. This chart was uploaded by Investor/RT 13.6.3 showing symbol: QGC#. |
View |
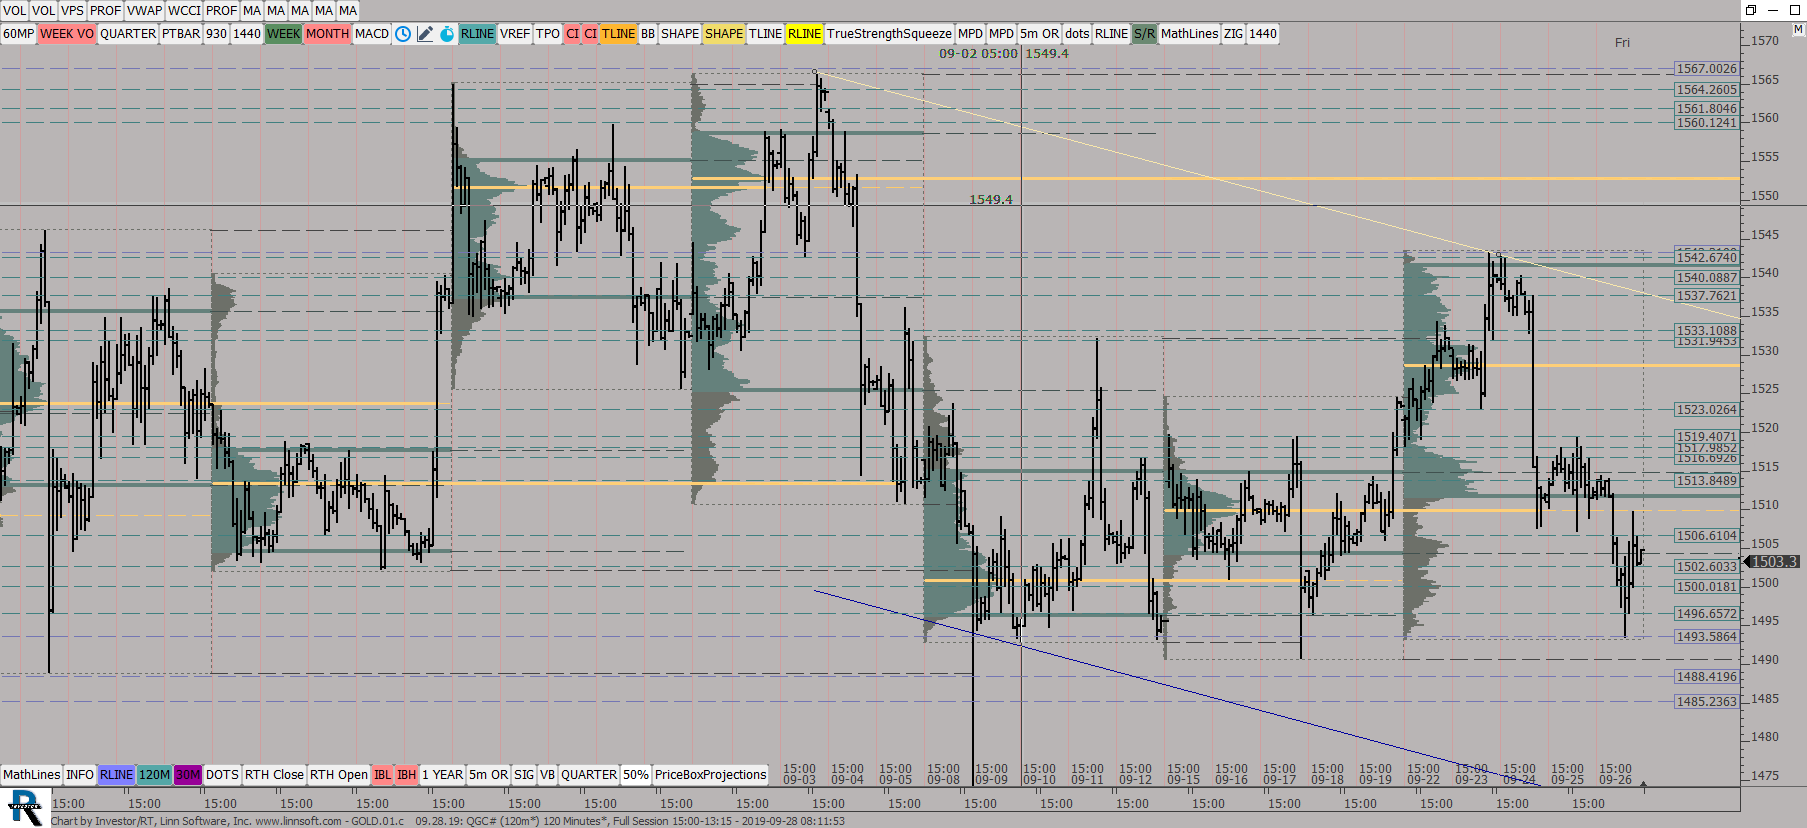 |
GOLD01c (QGC#) ES42 [totalcount]
6 years 10 months ago
Weekly VP, 12 Min Bars. This chart was uploaded by Investor/RT 13.6.3 showing symbol: QGC#. |
View |
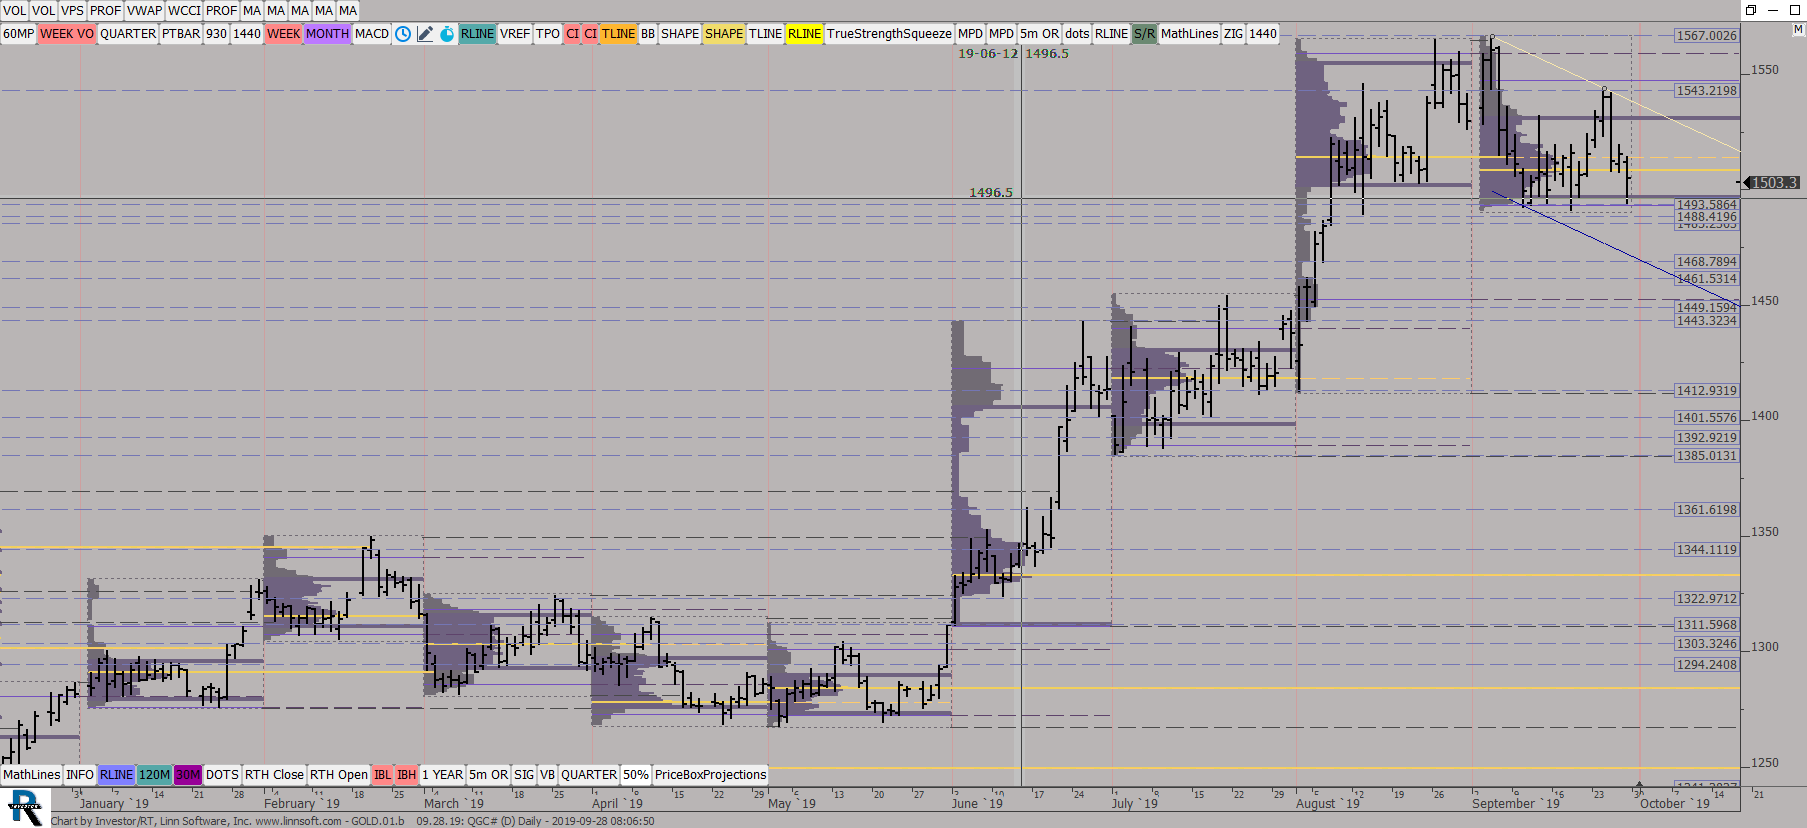 |
GOLD01b (QGC#) ES42 [totalcount]
6 years 10 months ago
Monthly VP, Daily Bars. This chart was uploaded by Investor/RT 13.6.3 showing symbol: QGC#. |
View |
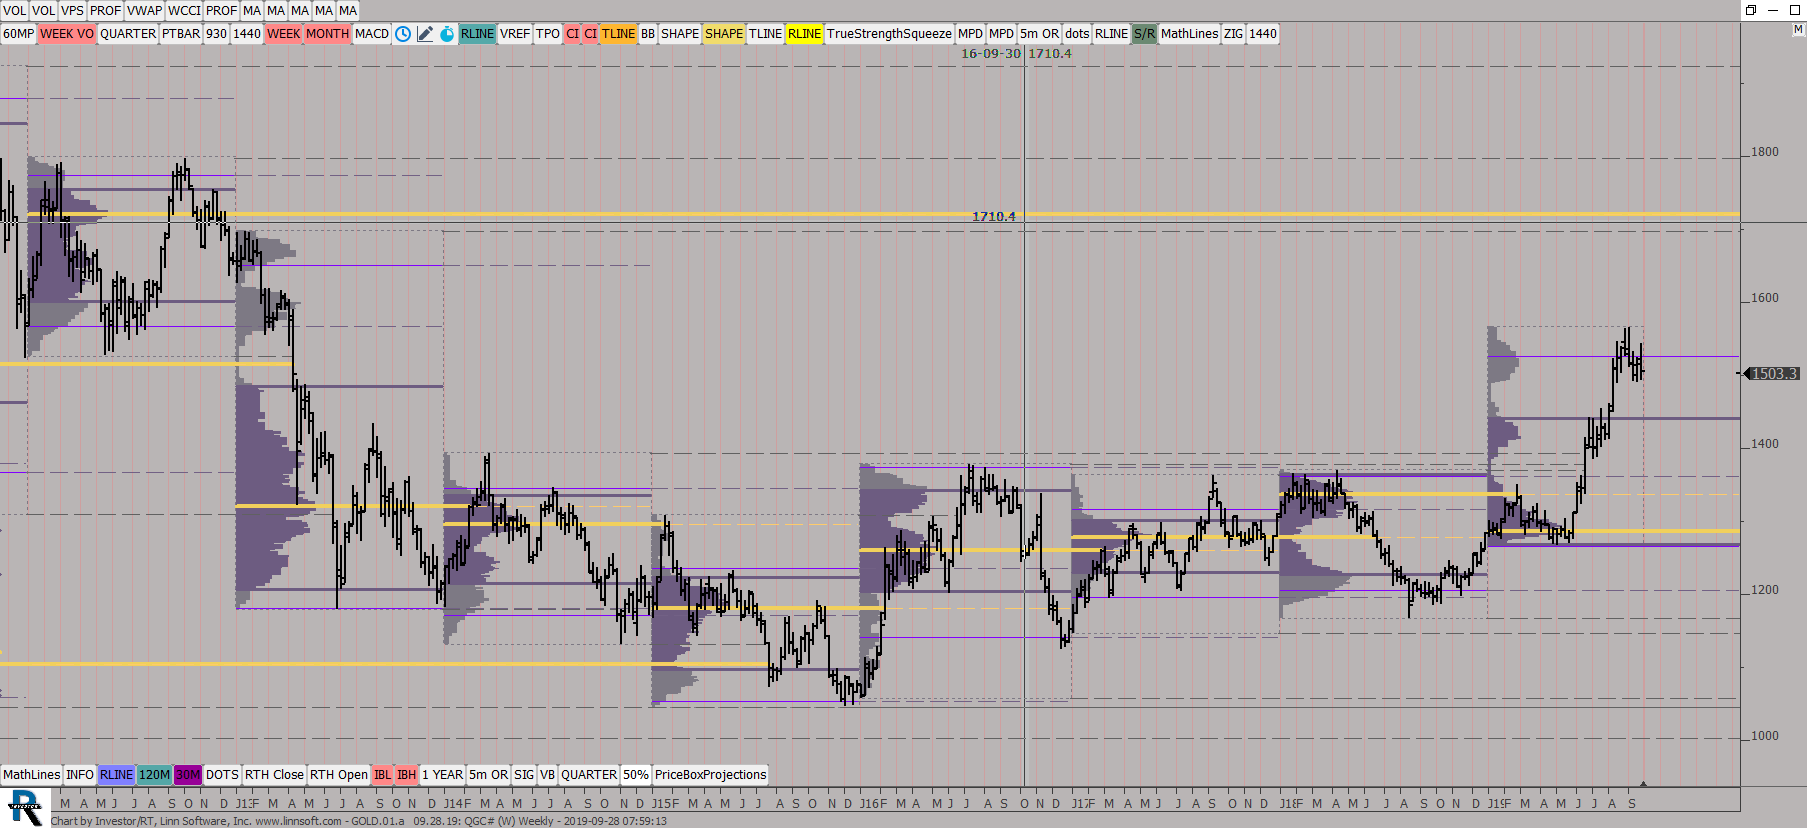 |
GOLD01a (QGC#) ES42 [totalcount]
6 years 10 months ago
Yearly Profiles, weekly bars. This chart was uploaded by Investor/RT 13.6.3 showing symbol: QGC#. |
View |
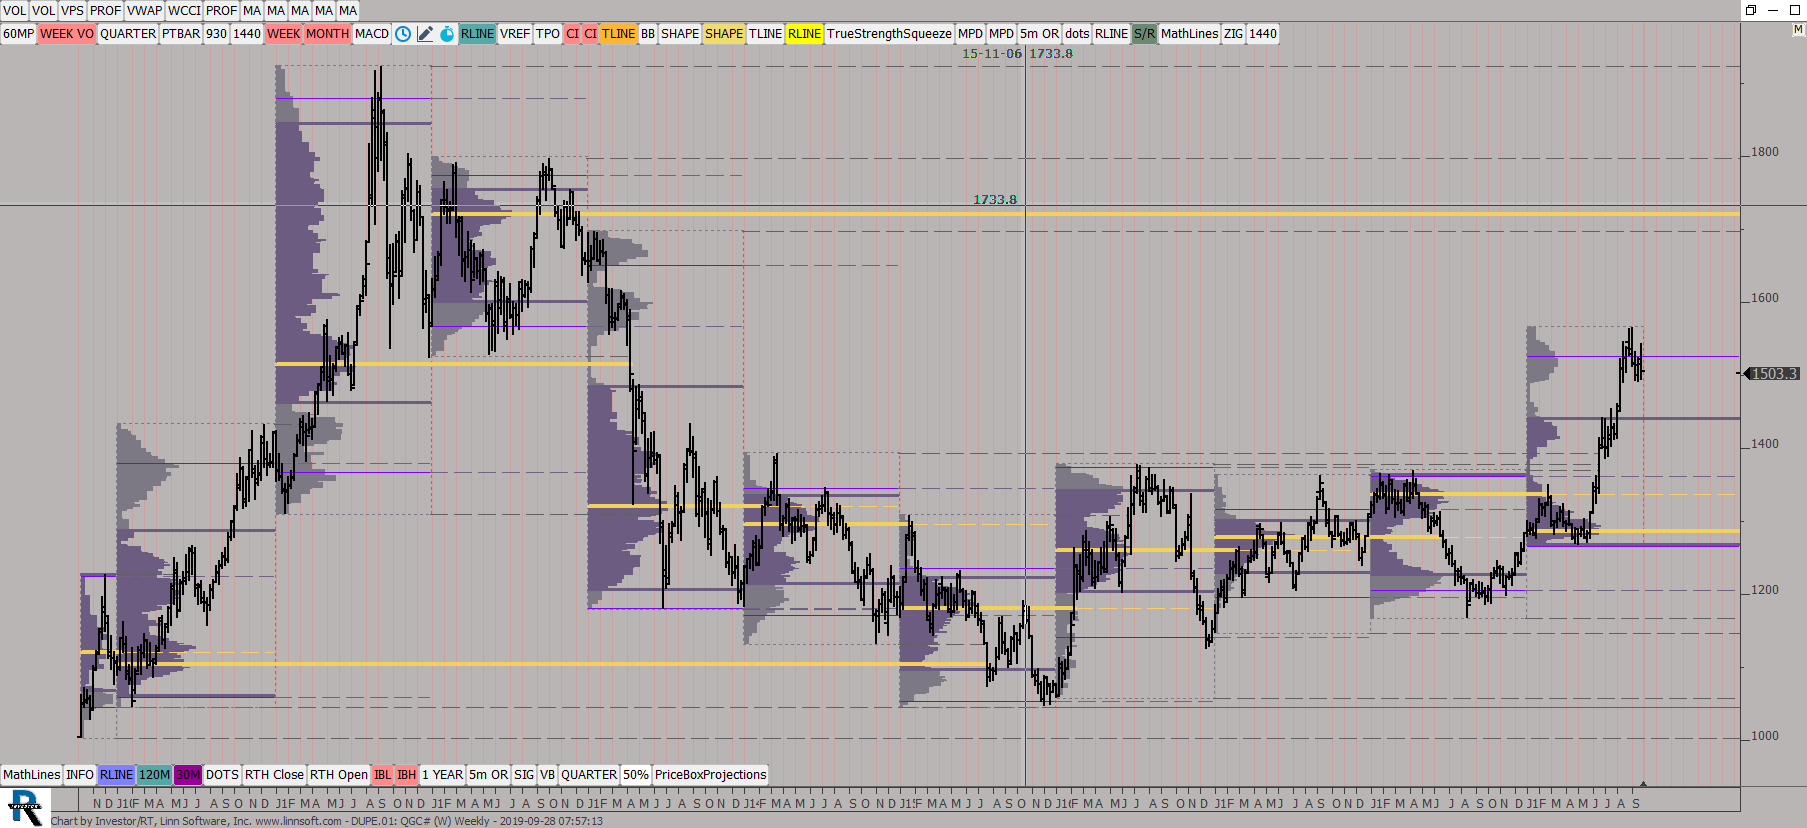 |
DUPE (QGC#) ES42 [totalcount]
6 years 10 months ago
This chart was uploaded by Investor/RT 13.6.3 showing symbol: QGC#. |
View |
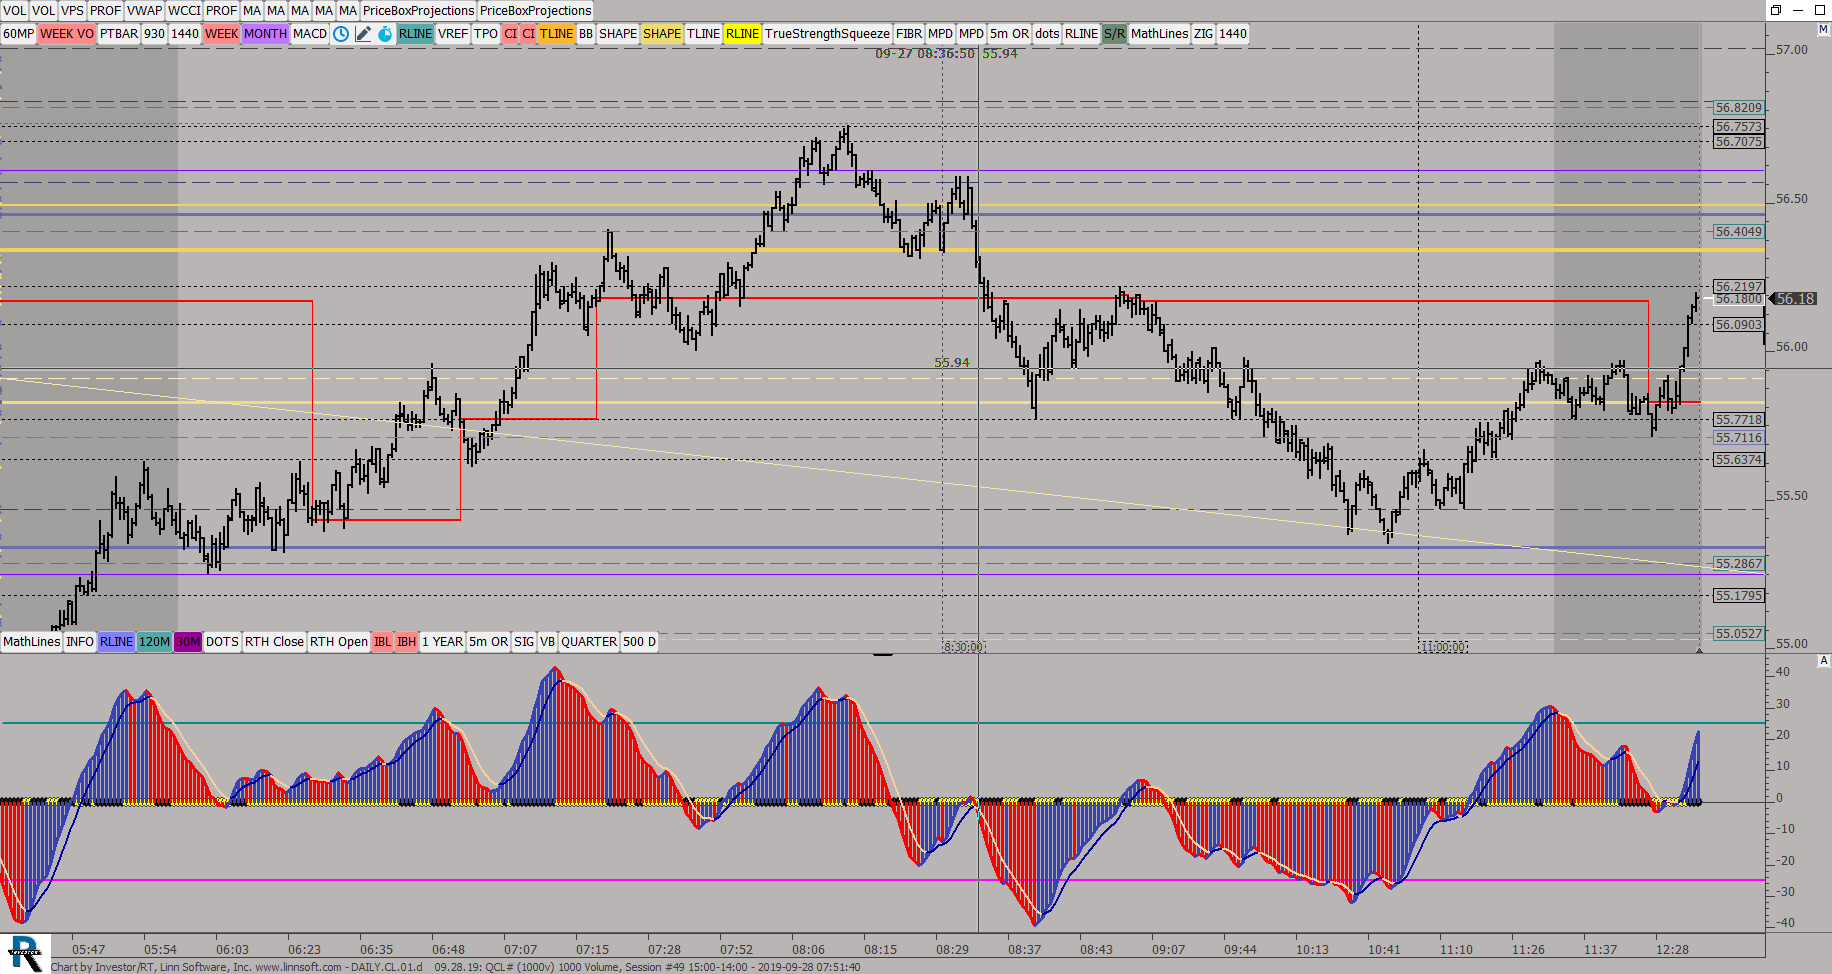 |
DAILYCL01d (QCL#) ES42 [totalcount]
6 years 10 months ago
Daily VP, 30 Min Candles. This chart was uploaded by Investor/RT 13.6.2 showing symbol: QCL#. |
View |
 |
DAILYCL01c (QCL#) ES42 [totalcount]
6 years 10 months ago
Daily VP, 30 Min Candles. This chart was uploaded by Investor/RT 13.6.2 showing symbol: QCL#. |
View |
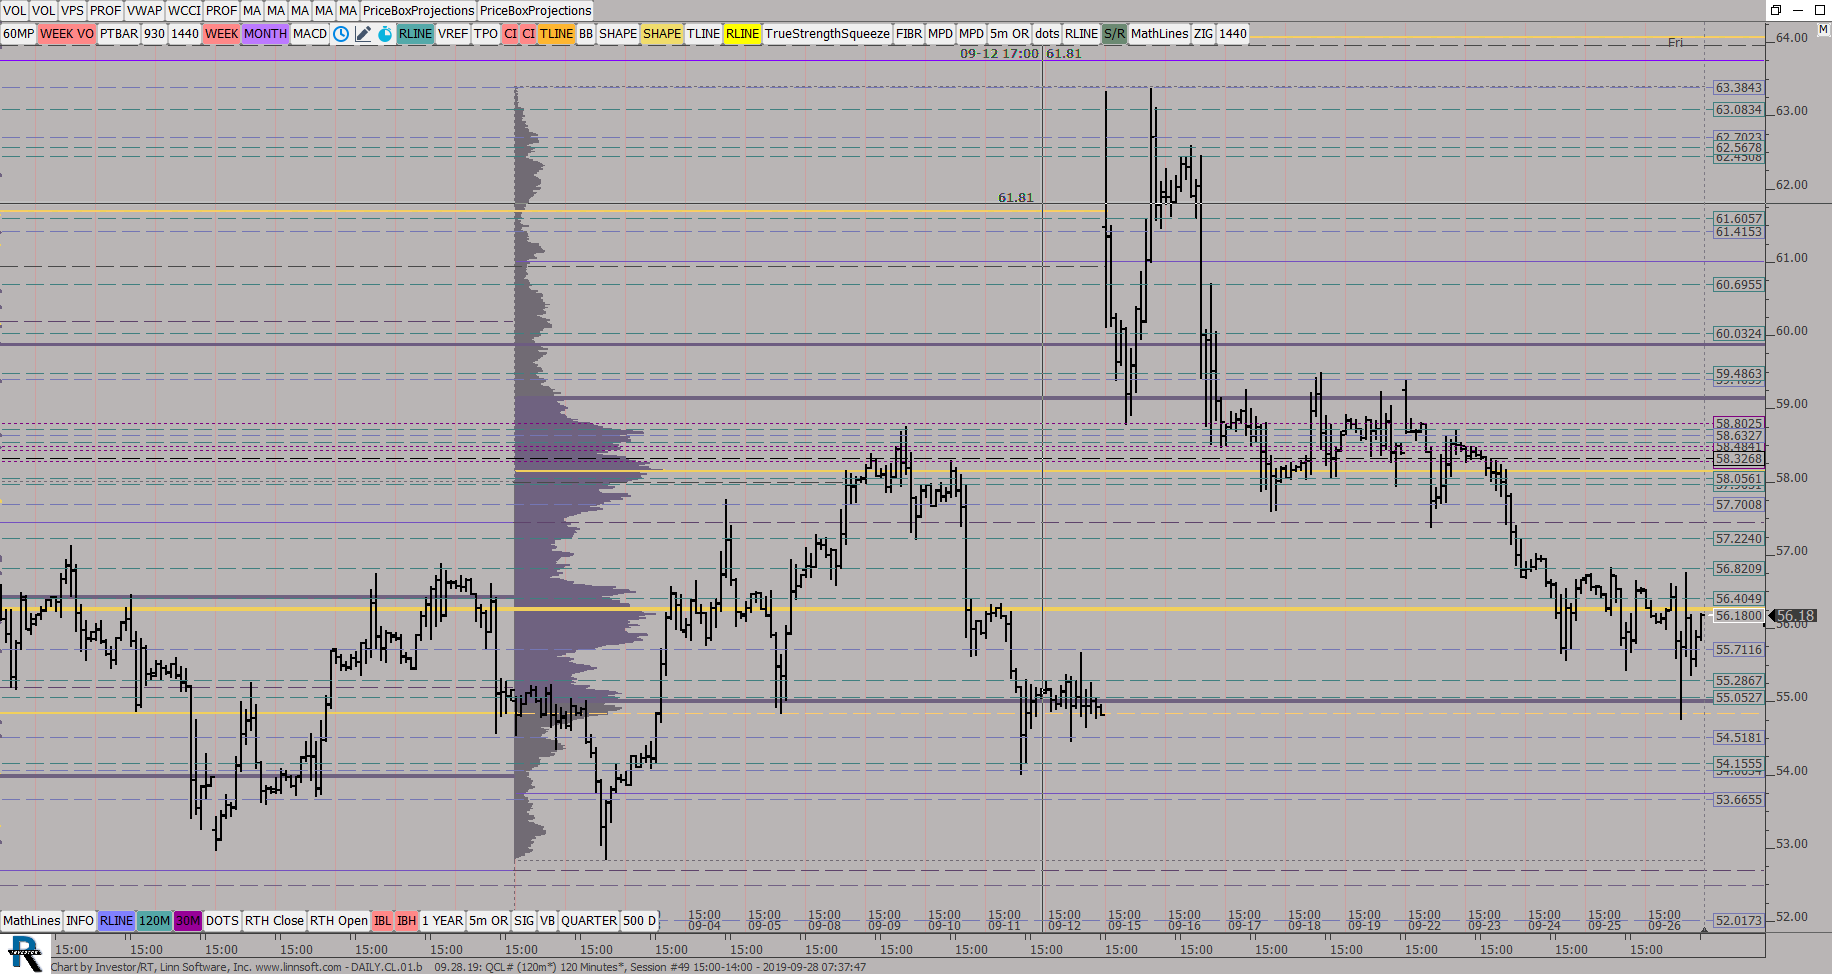 |
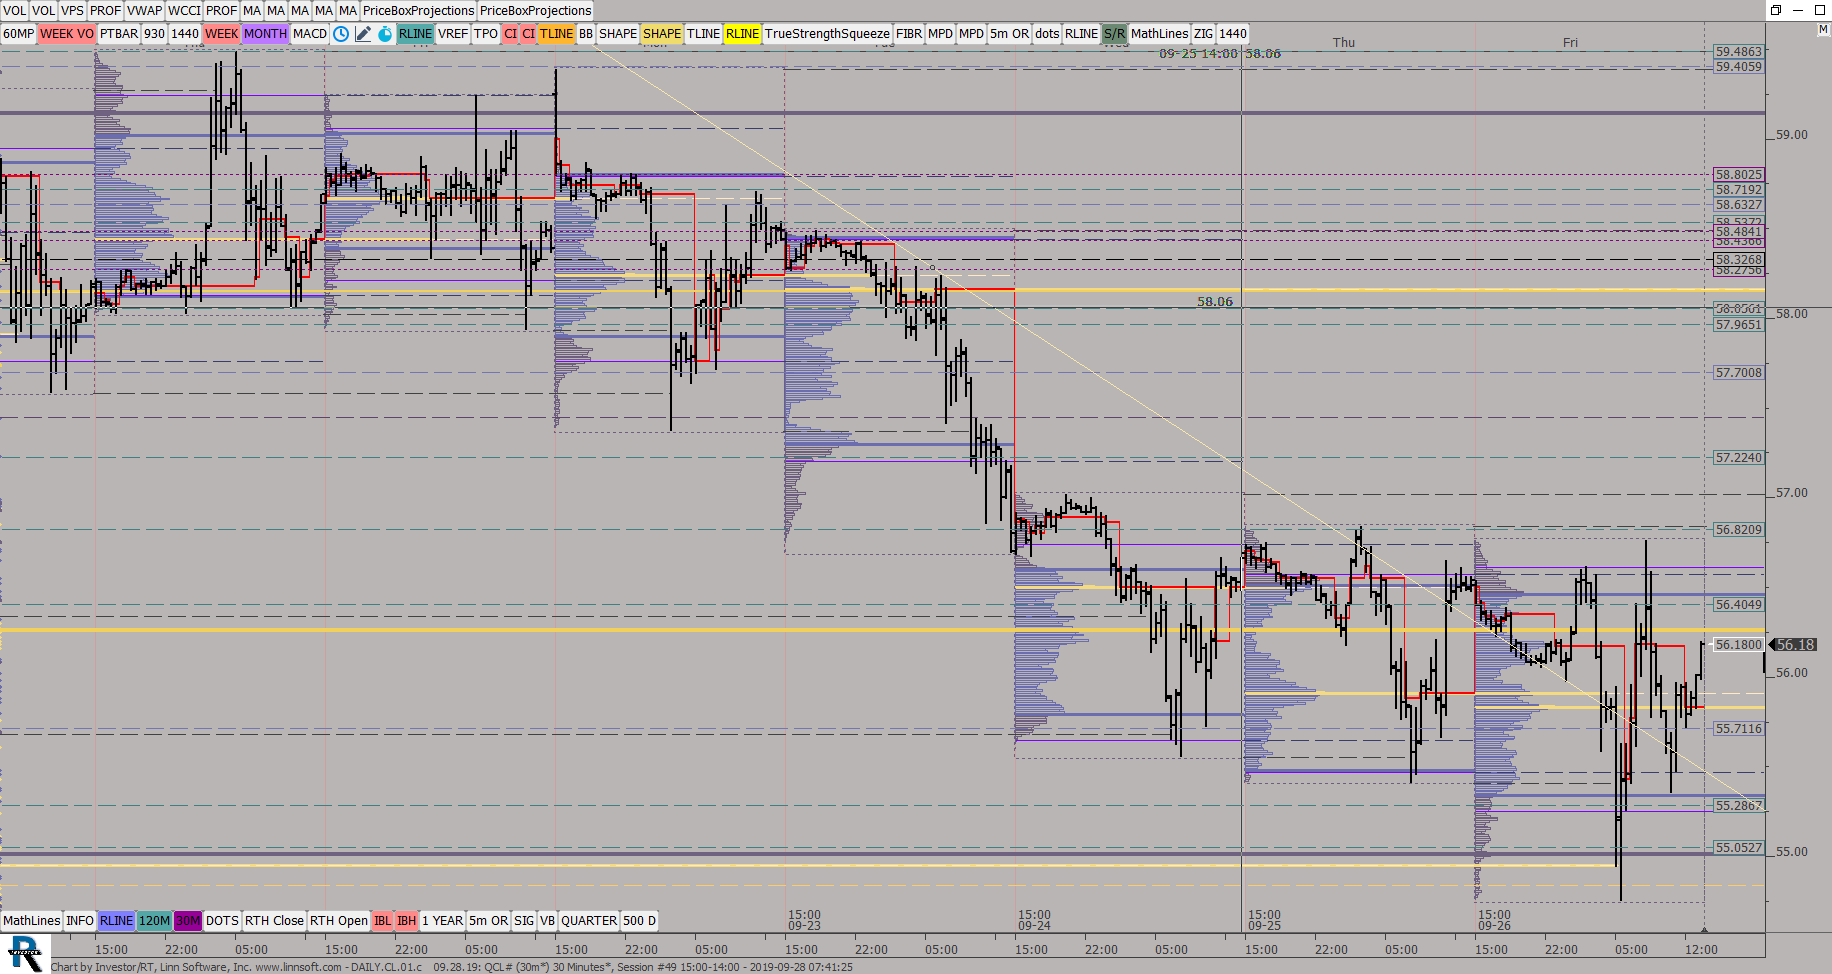
DAILYCL01b (QCL#) ES42 [totalcount]
6 years 10 months ago
Weekly VP, 120 min Candles. This chart was uploaded by Investor/RT 13.6.2 showing symbol: QCL#. |
View |
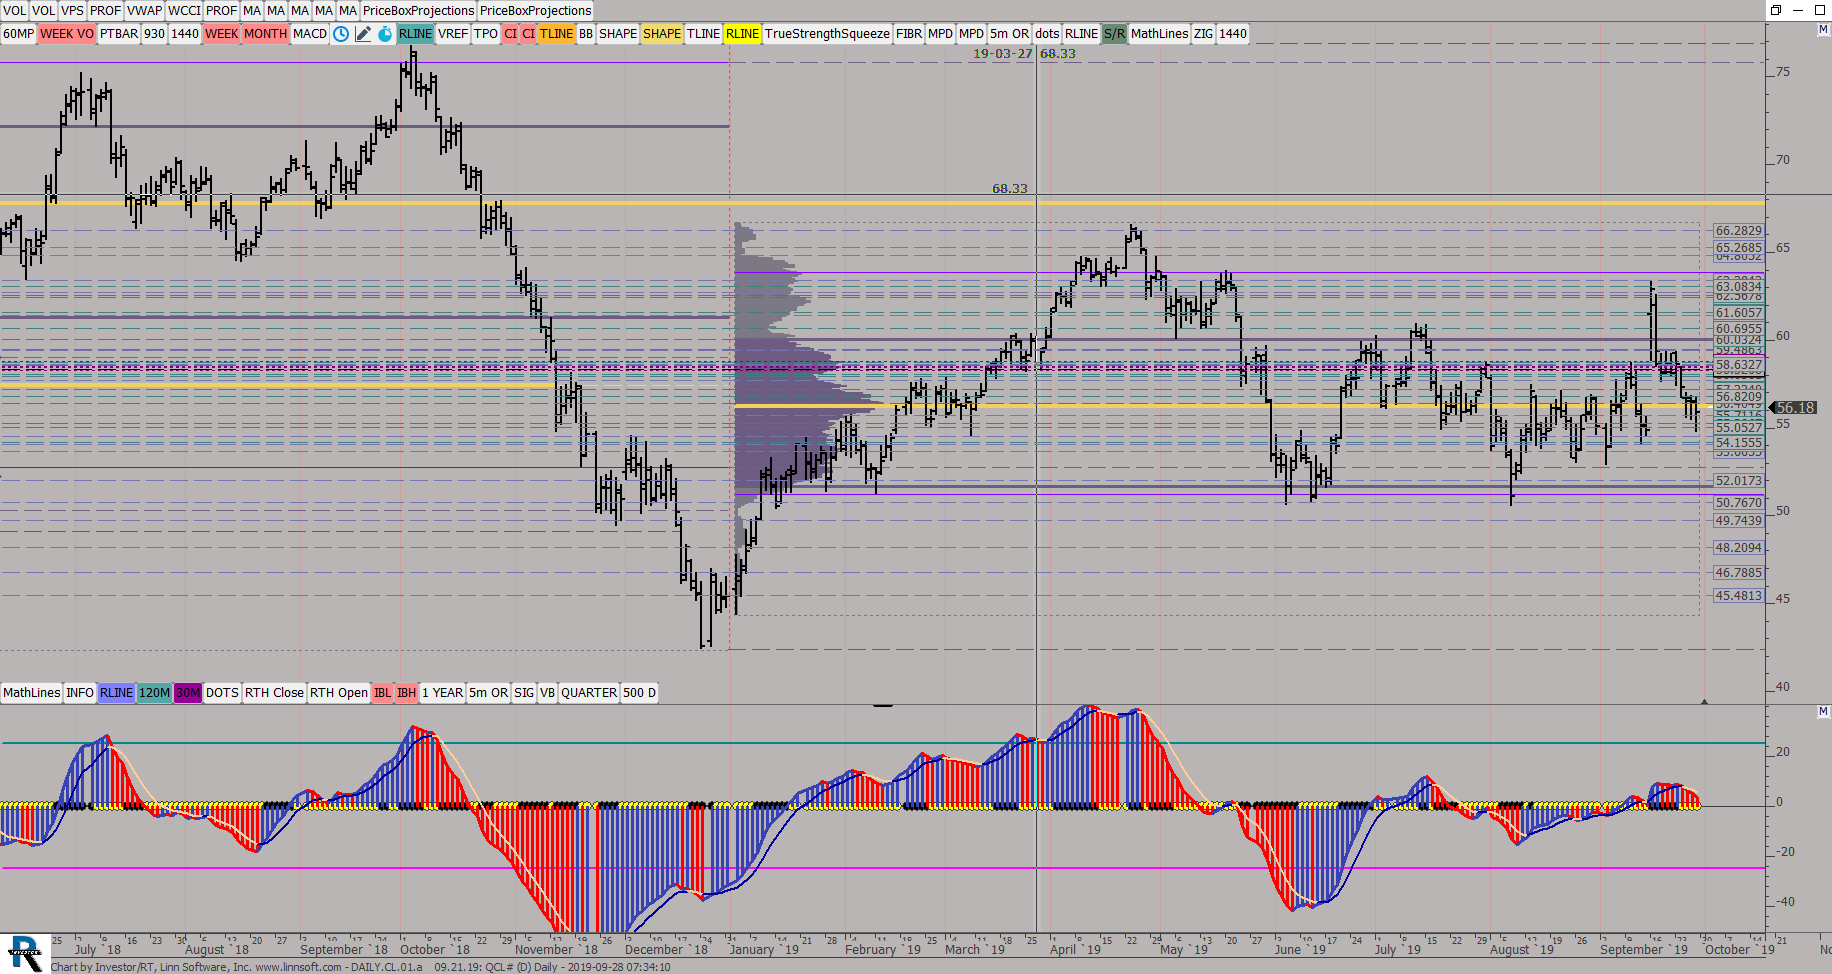 |
DAILYCL01a (QCL#) ES42 [totalcount]
6 years 10 months ago
Yearly VP, Daily Candles. This chart was uploaded by Investor/RT 13.6.2 showing symbol: QCL#. |
View |
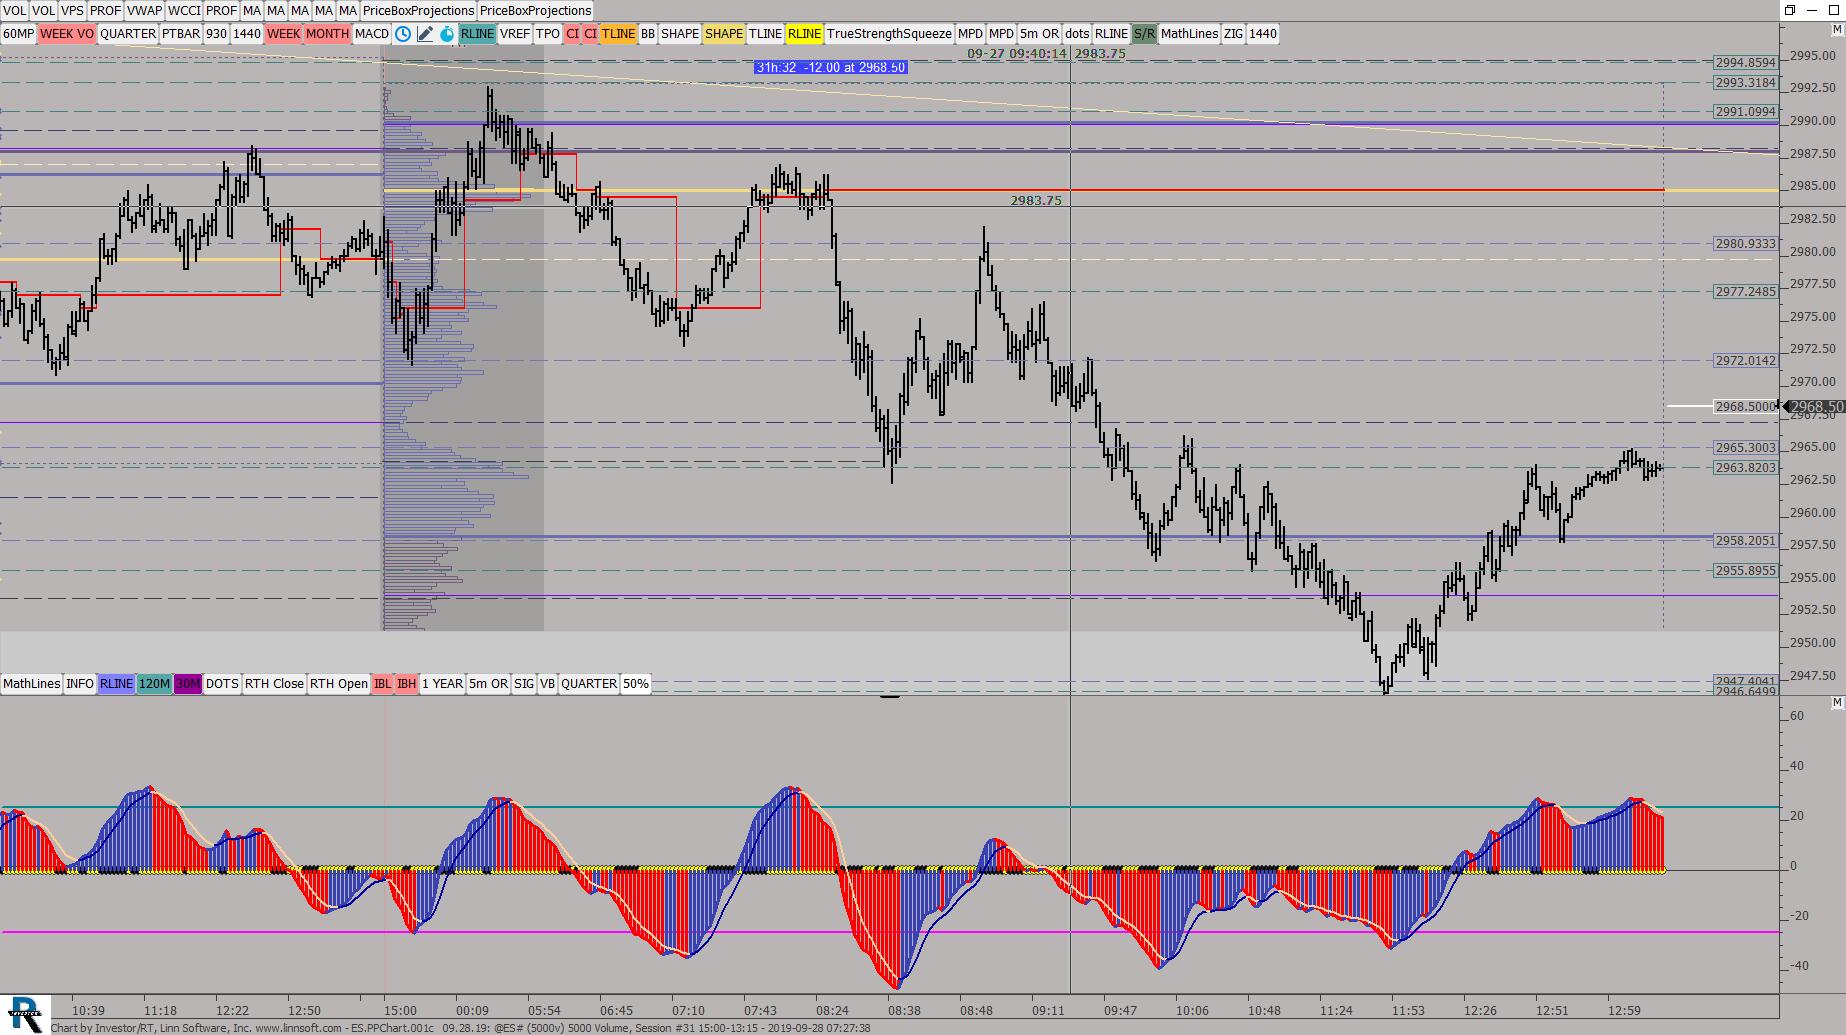 |
ESPPChart001c (@ES#) ES42 [totalcount]
6 years 10 months ago
This chart was uploaded by Investor/RT 13.6.3 showing symbol: @ES#. |
View |
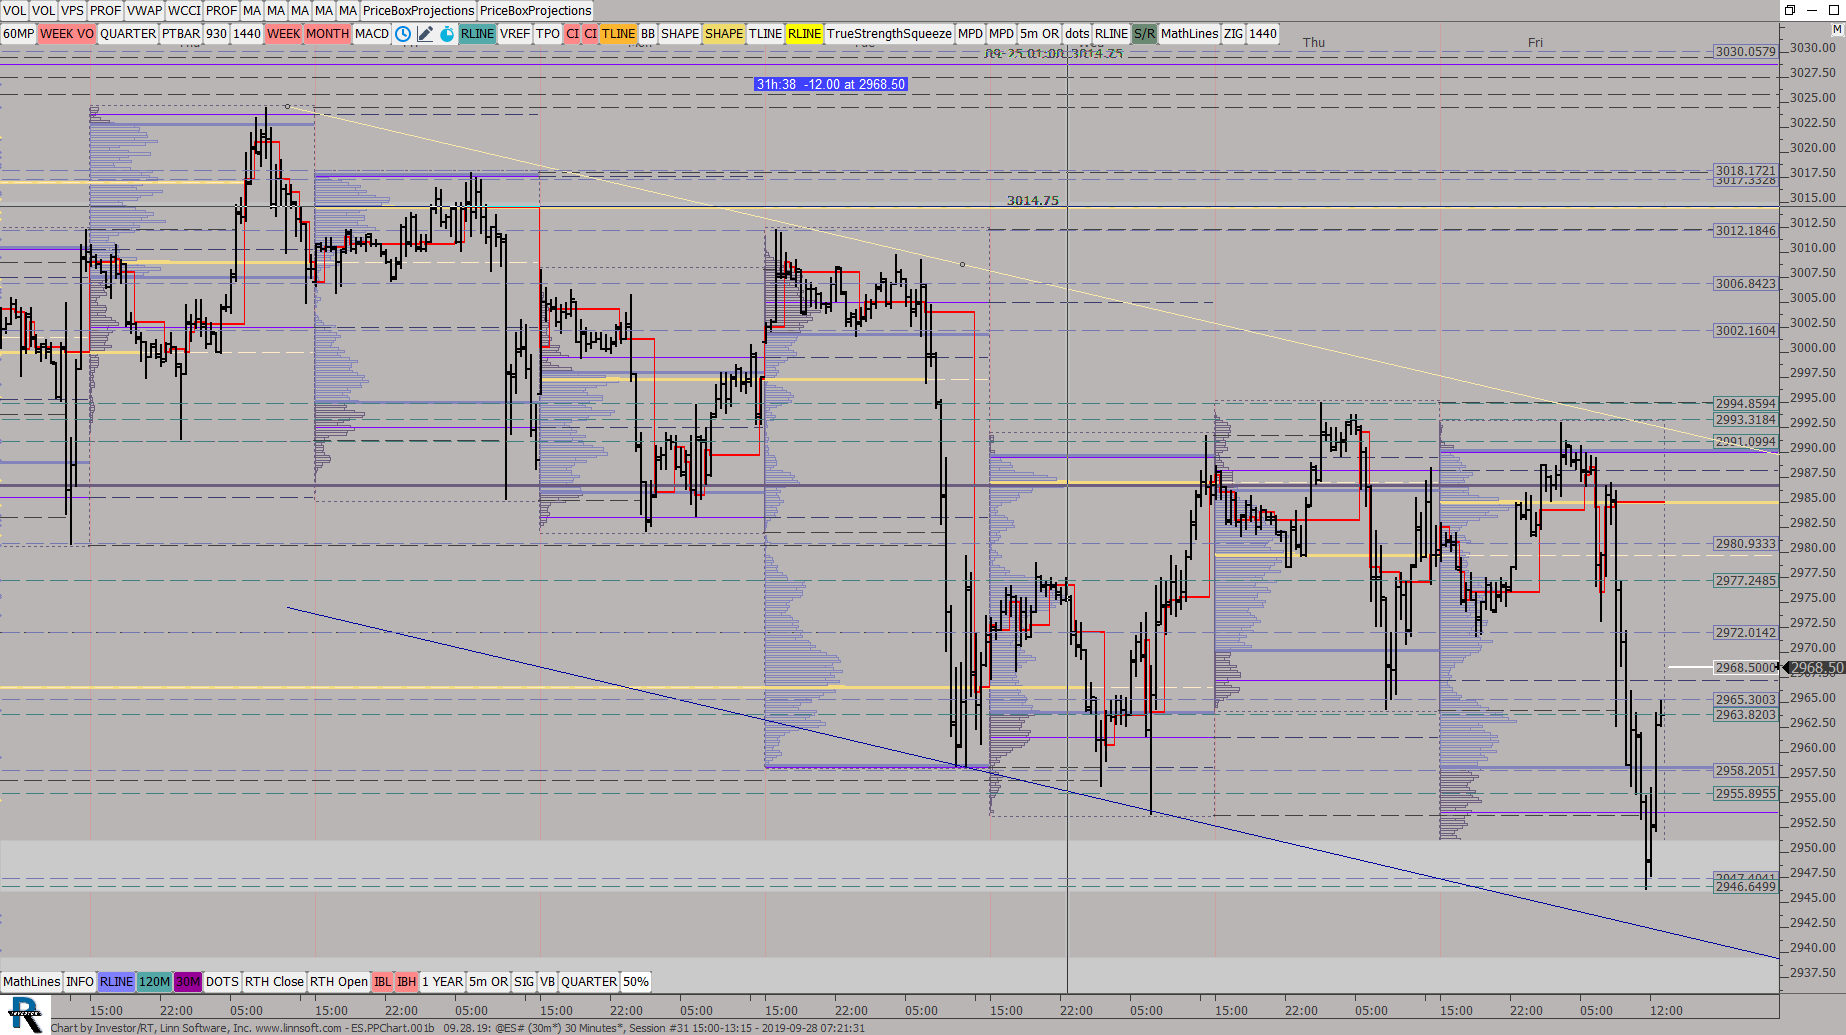 |
ESPPChart001b (@ES#) ES42 [totalcount]
6 years 10 months ago
This chart was uploaded by Investor/RT 13.6.3 showing symbol: @ES#. |
View |
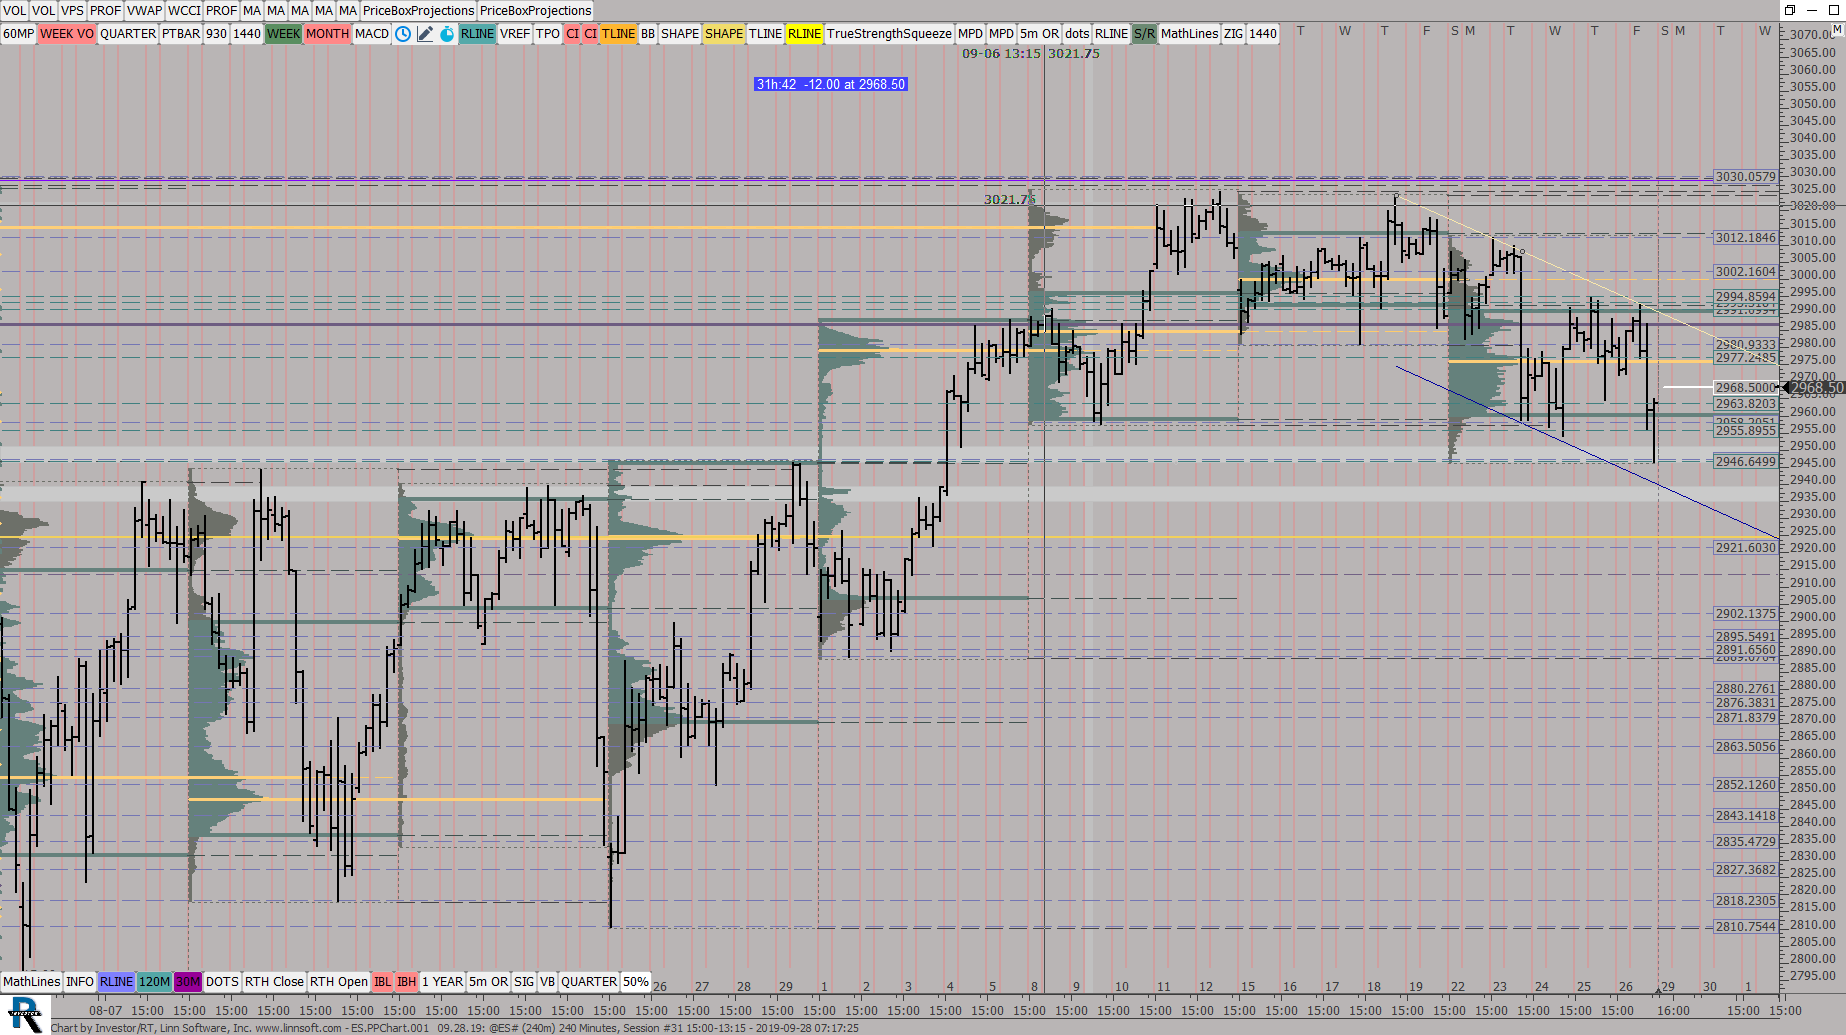 |
ESPPChart001 (@ES#) ES42 [totalcount]
6 years 10 months ago
This chart was uploaded by Investor/RT 13.6.3 showing symbol: @ES#. |
View |
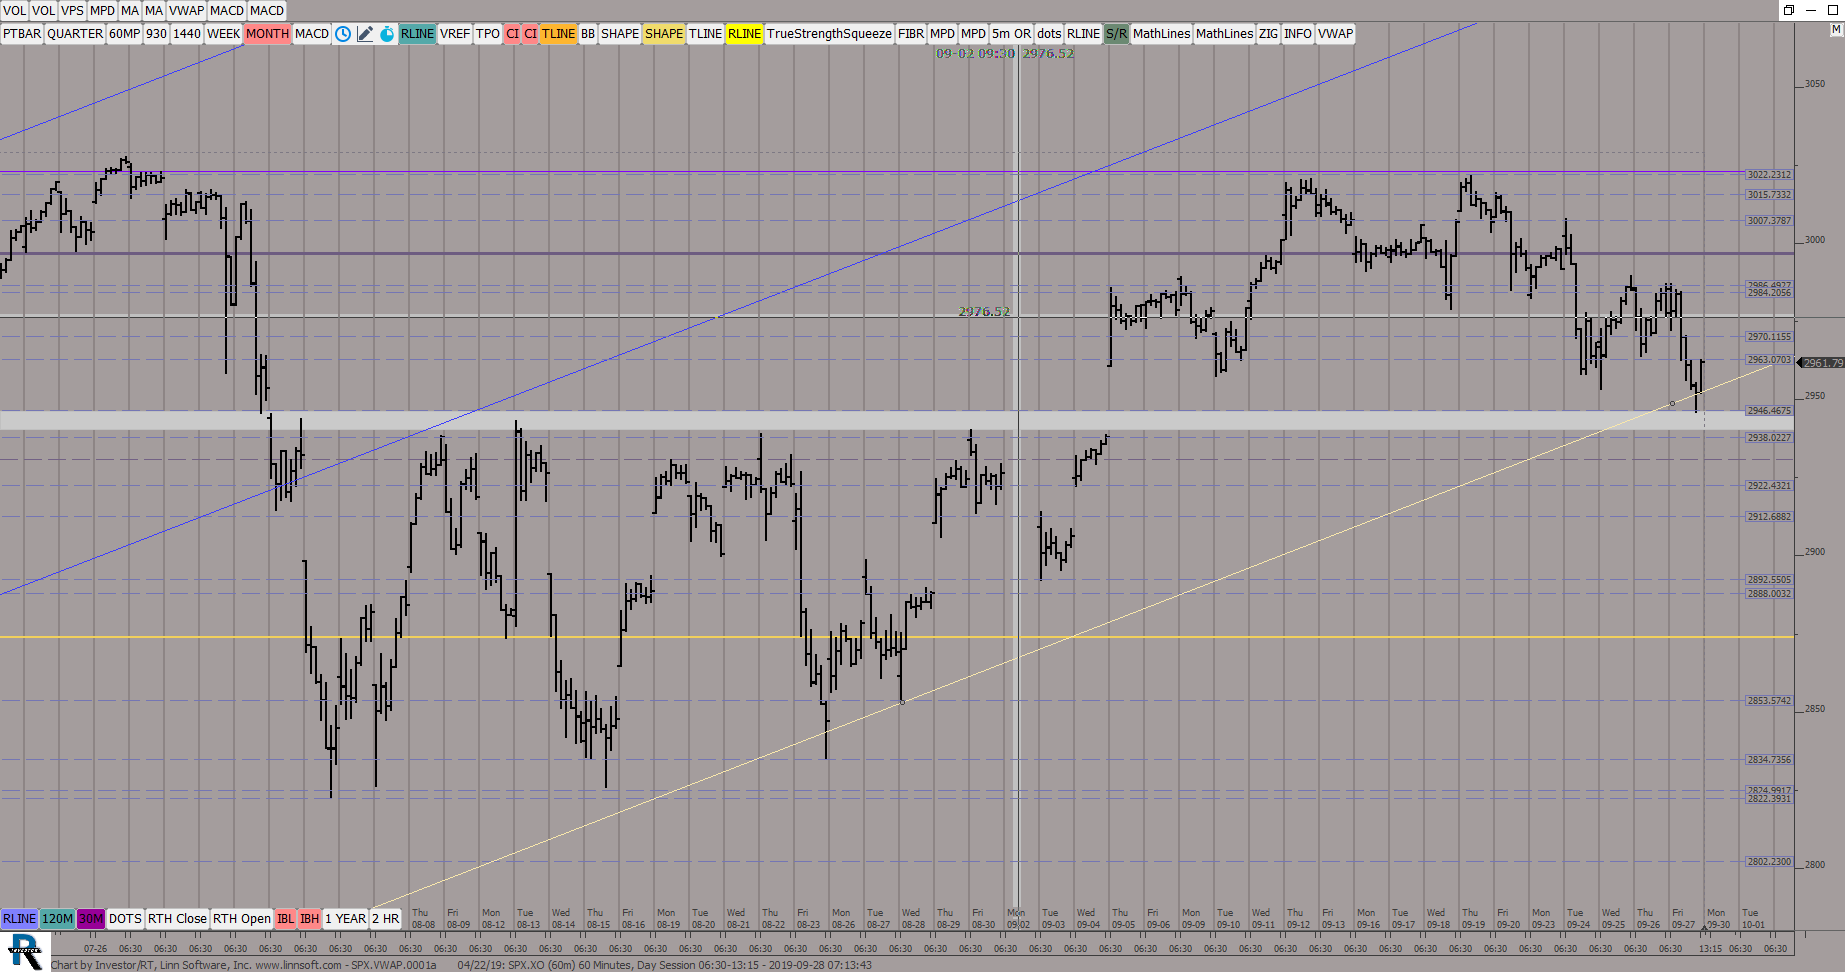 |
SPXVWAP0001a 04 22 (SPX.XO) ES42 [totalcount]
6 years 10 months ago
This chart was uploaded by Investor/RT 13.6.3 showing symbol: SPX.XO. |
View |
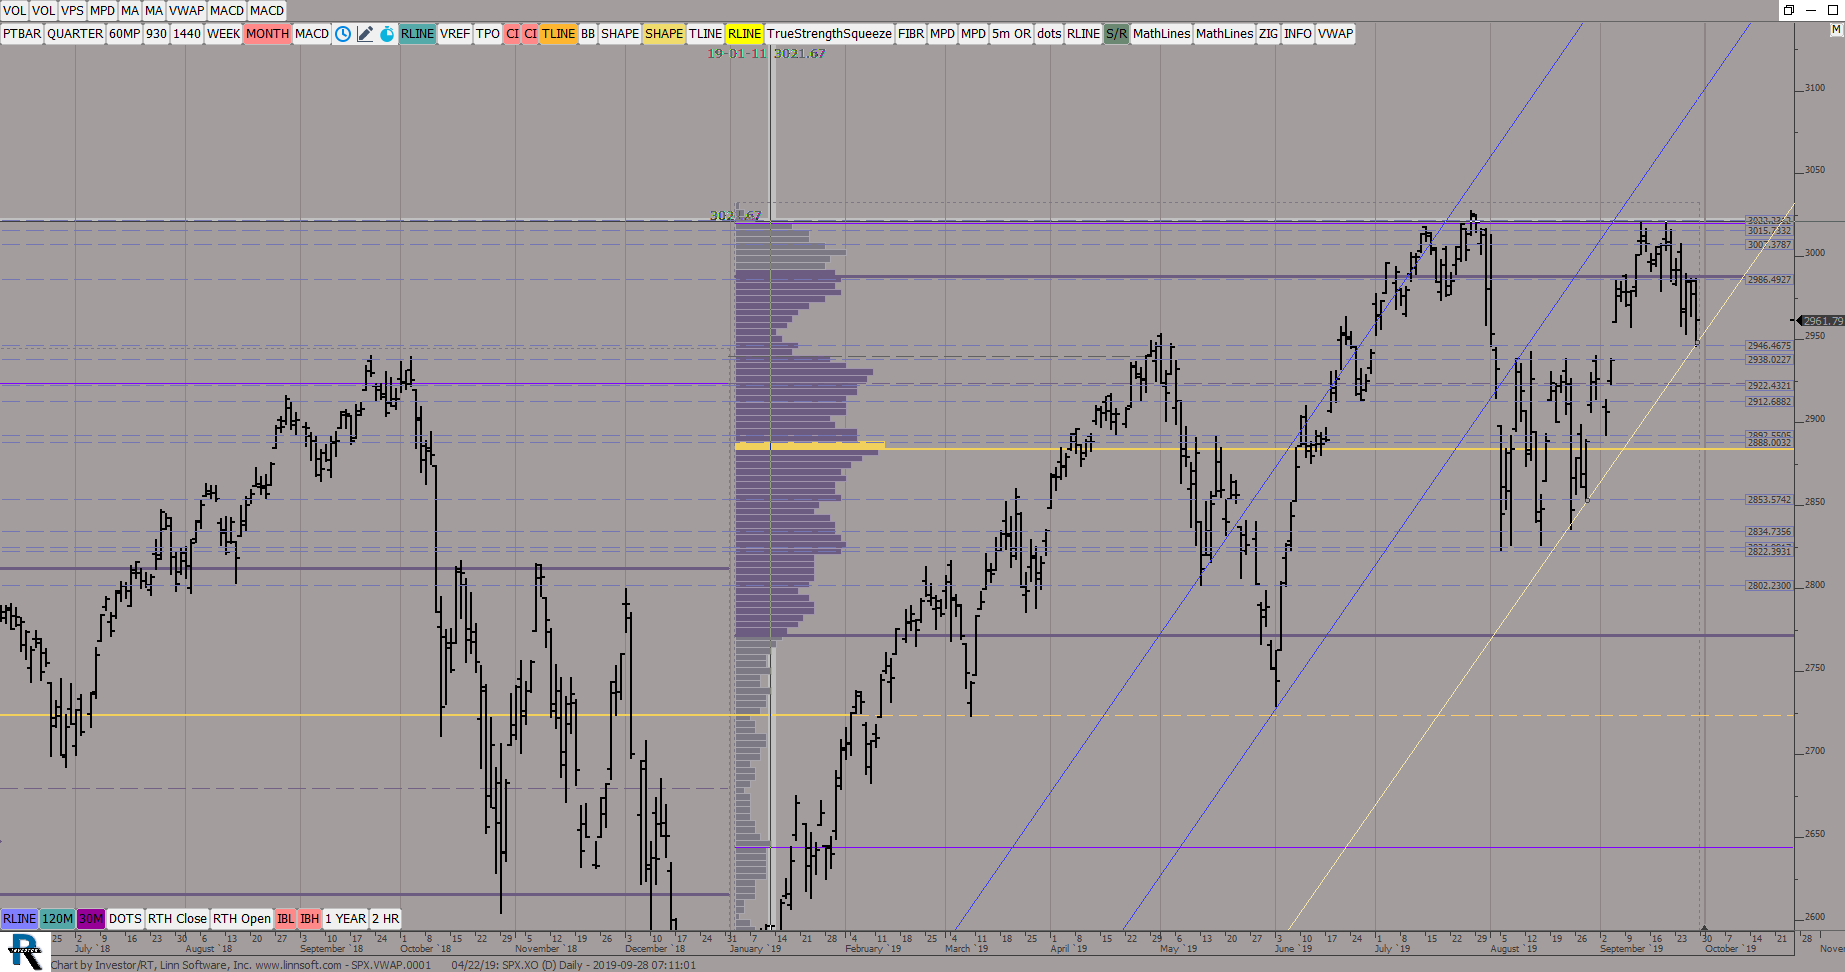 |
SPXVWAP0001 04 22 (SPX.XO) ES42 [totalcount]
6 years 10 months ago
YEARLY MP, WEEKLY Candles. This chart was uploaded by Investor/RT 13.5.24 showing symbol: SPX.XO. |
View |
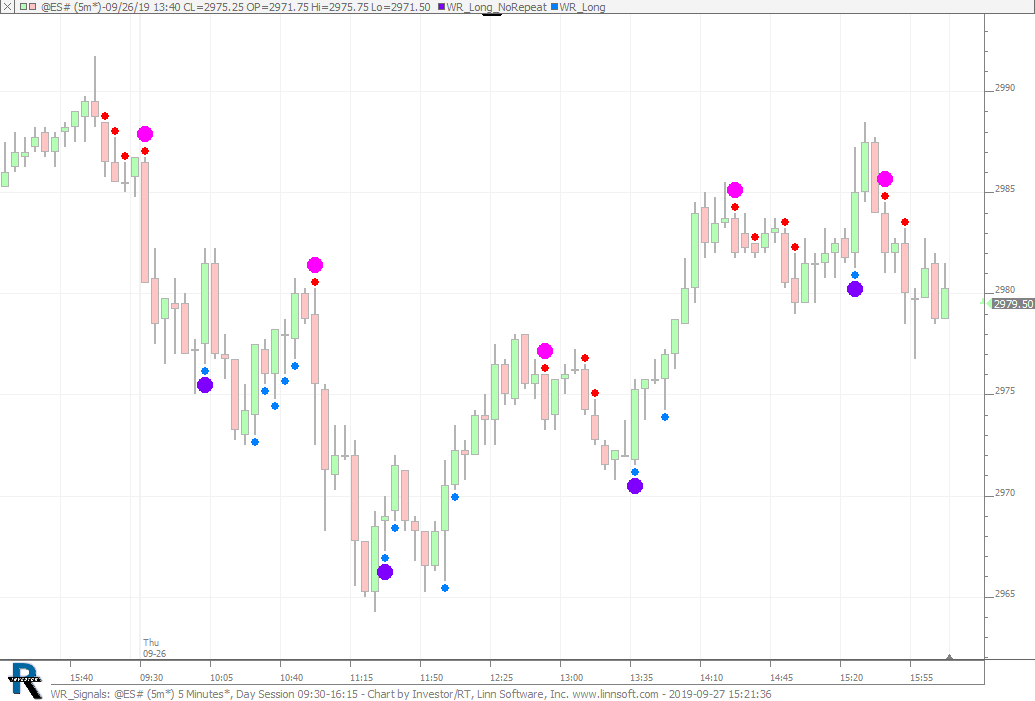 |
WR Signals (@ES#) cpayne [totalcount]
6 years 10 months ago
Wade Romine - How to alternate signals... This chart was uploaded by Investor/RT 13.6.1 showing symbol: @ES#. |
View |
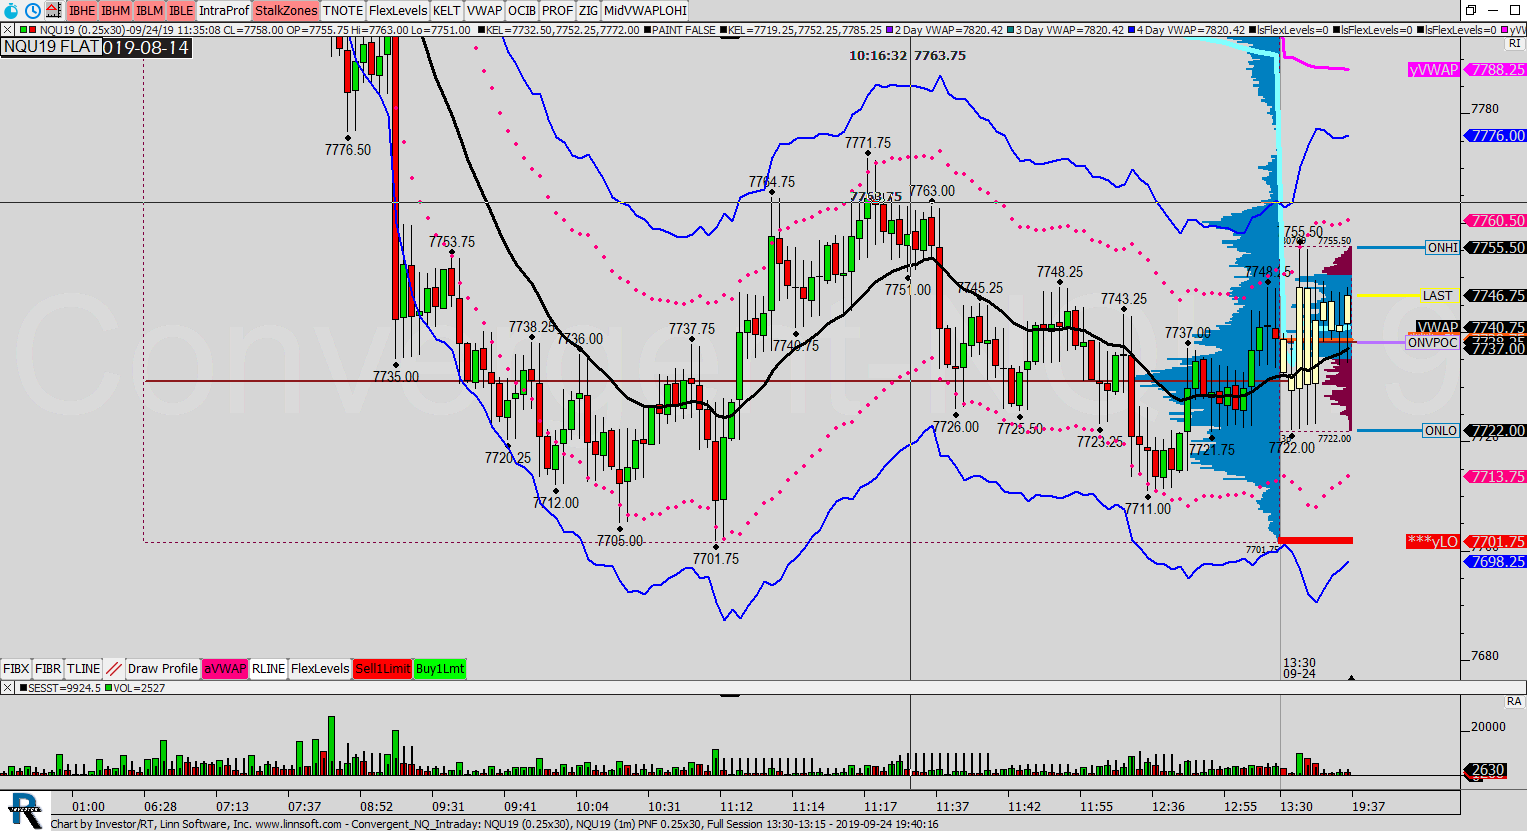 |
Convergent NQ Intraday (ESM19) kcho6391 [totalcount]
6 years 10 months ago
This chart was uploaded by Investor/RT 13.6.3 showing symbol: ESM19. |
View |
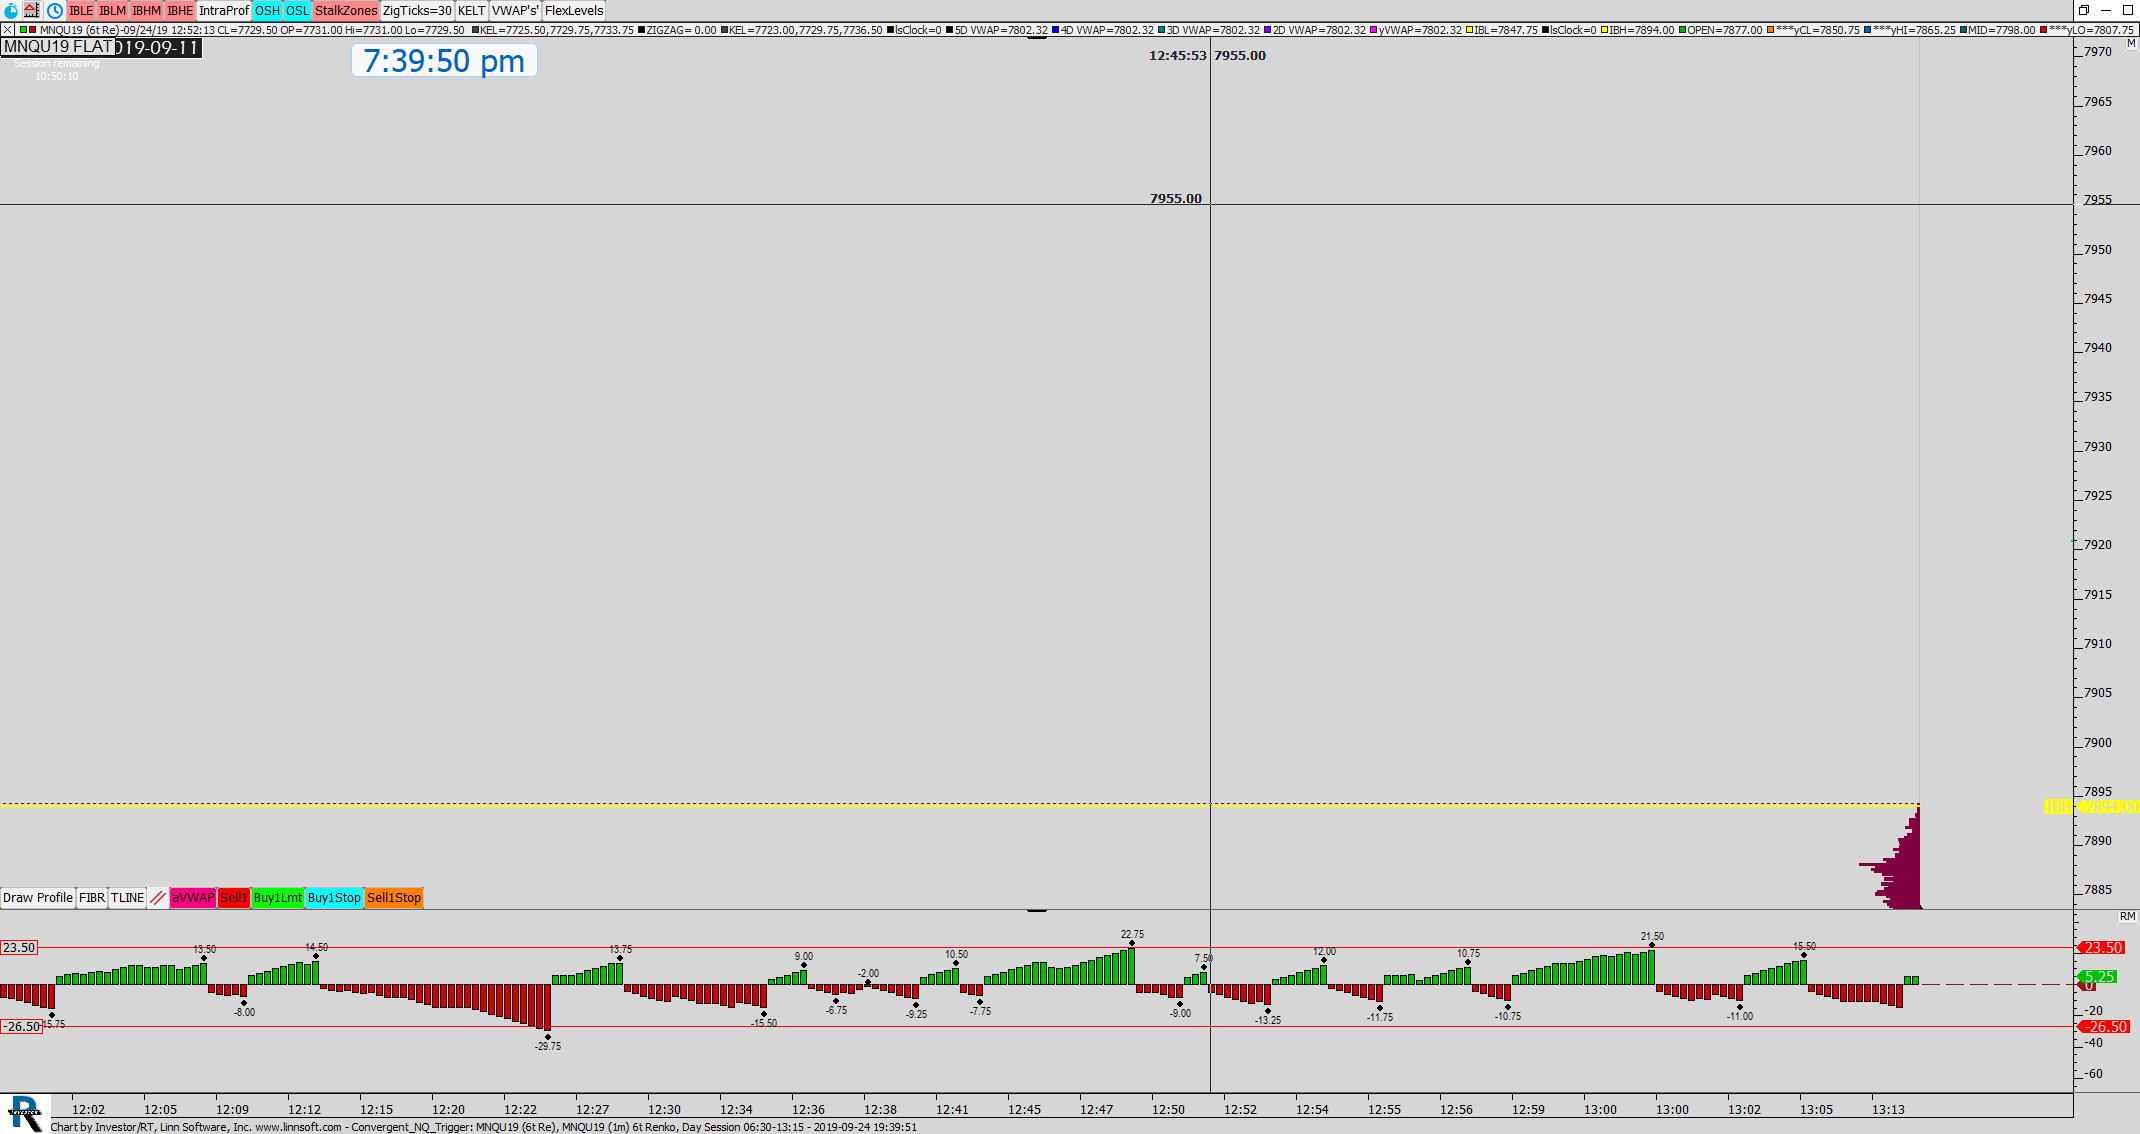 |
Convergent NQ Trigger (ESM19) kcho6391 [totalcount]
6 years 10 months ago
This chart was uploaded by Investor/RT 13.6.3 showing symbol: ESM19. |
View |
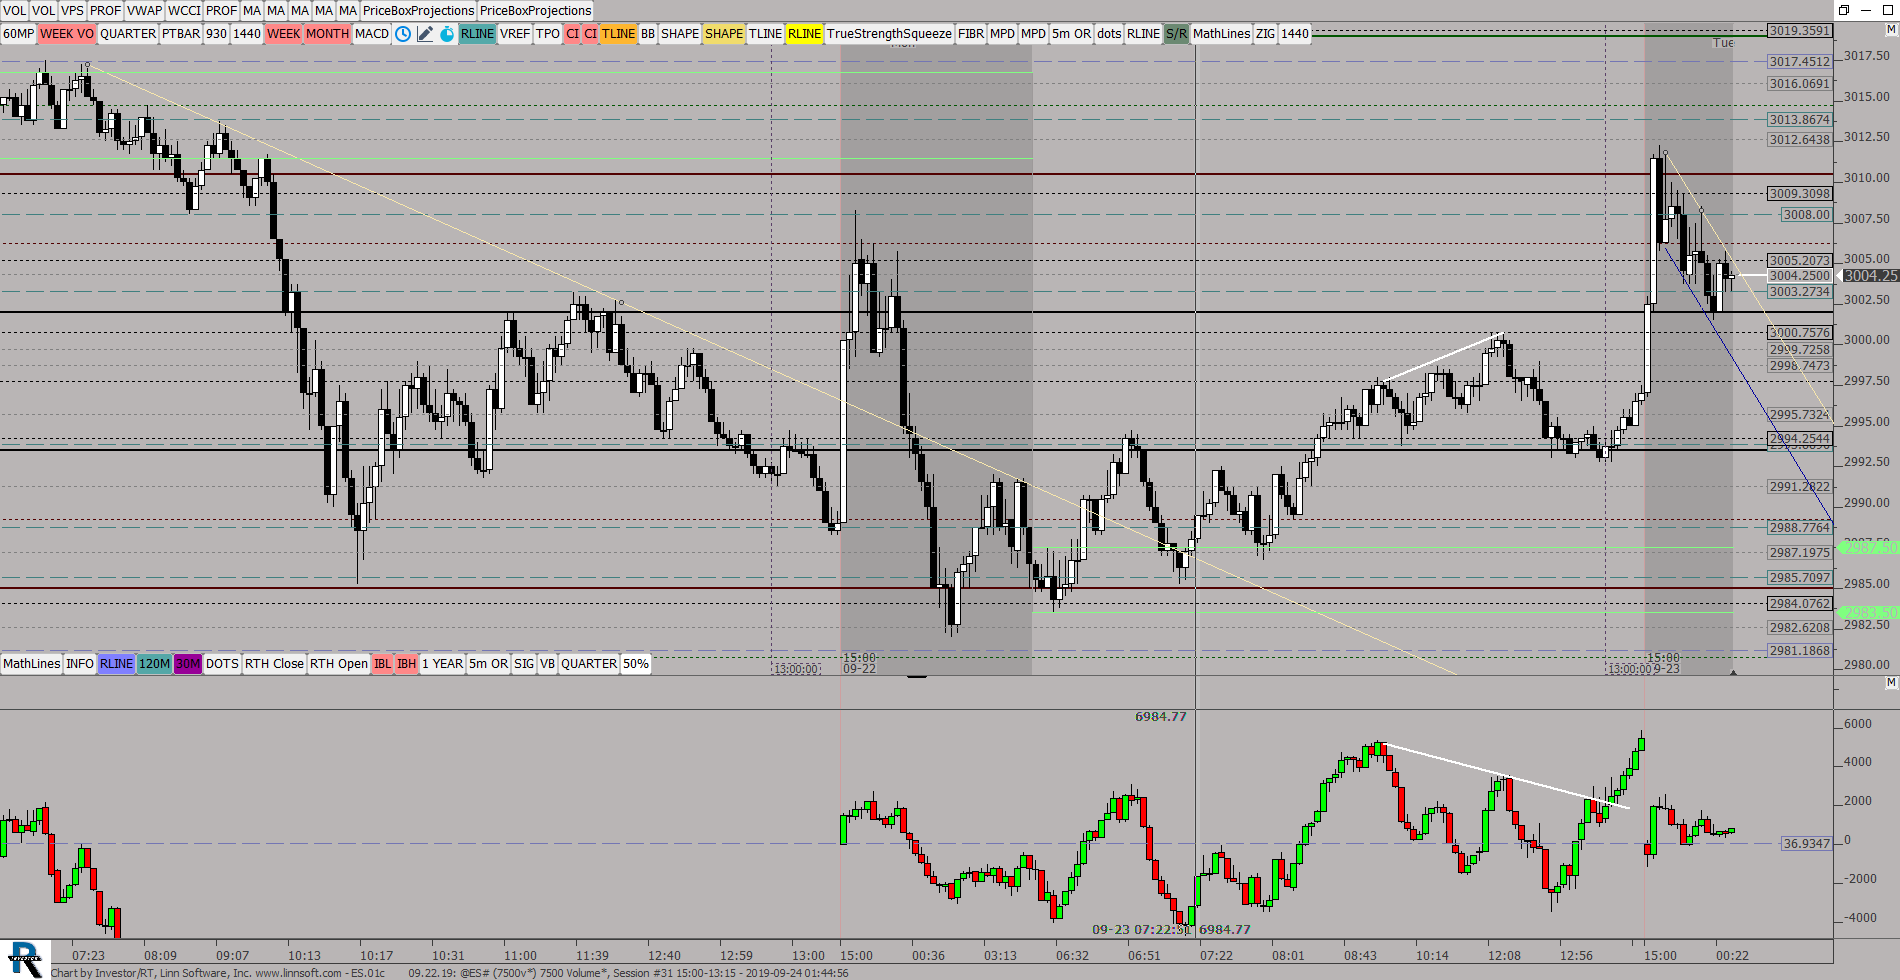 |
ES01c (@ES#) ES42 [totalcount]
6 years 10 months ago
This chart was uploaded by Investor/RT 13.6.3 showing symbol: @ES#. |
View |
 |
DAILYGOLD 01d (QGC#) ES42 [totalcount]
6 years 10 months ago
Daily VP, Entry Candles. This chart was uploaded by Investor/RT 13.6.2 showing symbol: QGC#. |
View |
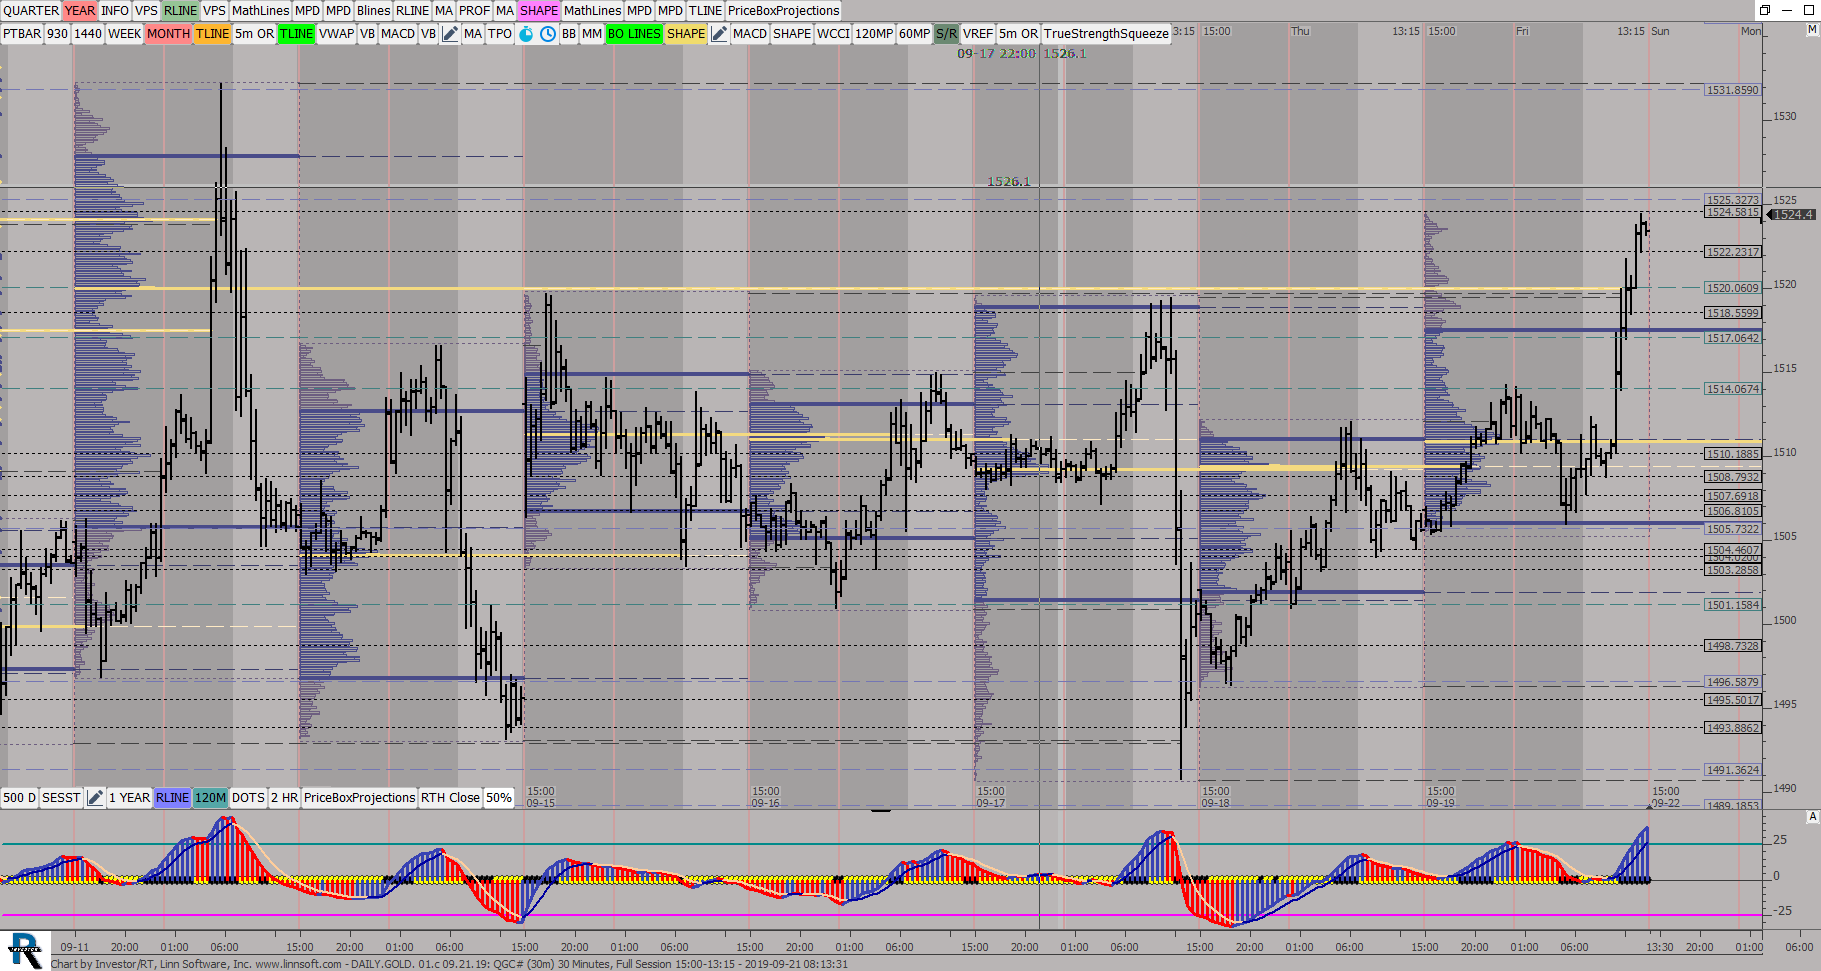 |
DAILYGOLD 01c (QGC#) ES42 [totalcount]
6 years 10 months ago
Daily VP, 30 Min Candles. This chart was uploaded by Investor/RT 13.6.2 showing symbol: QGC#. |
View |