 |
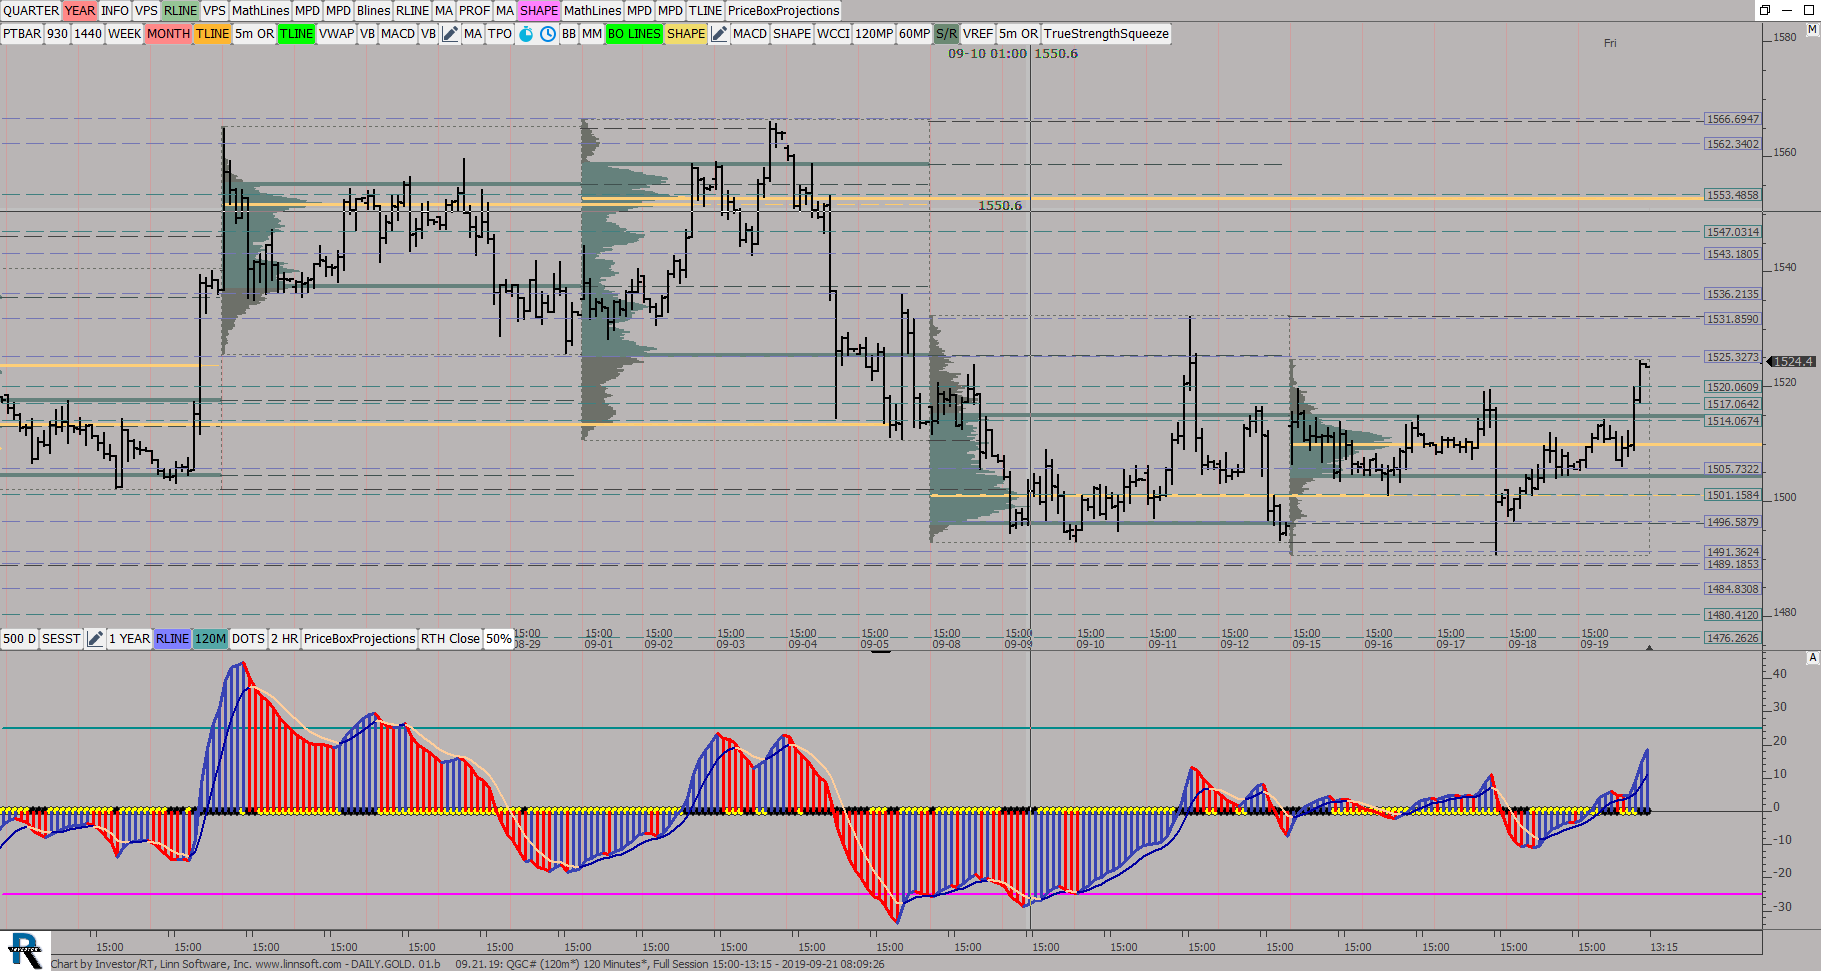
DAILYGOLD 01b (QGC#) ES42 [totalcount]
6 years 10 months ago
Weekly VP, 120 Min Candles. This chart was uploaded by Investor/RT 13.6.2 showing symbol: QGC#. |
View |
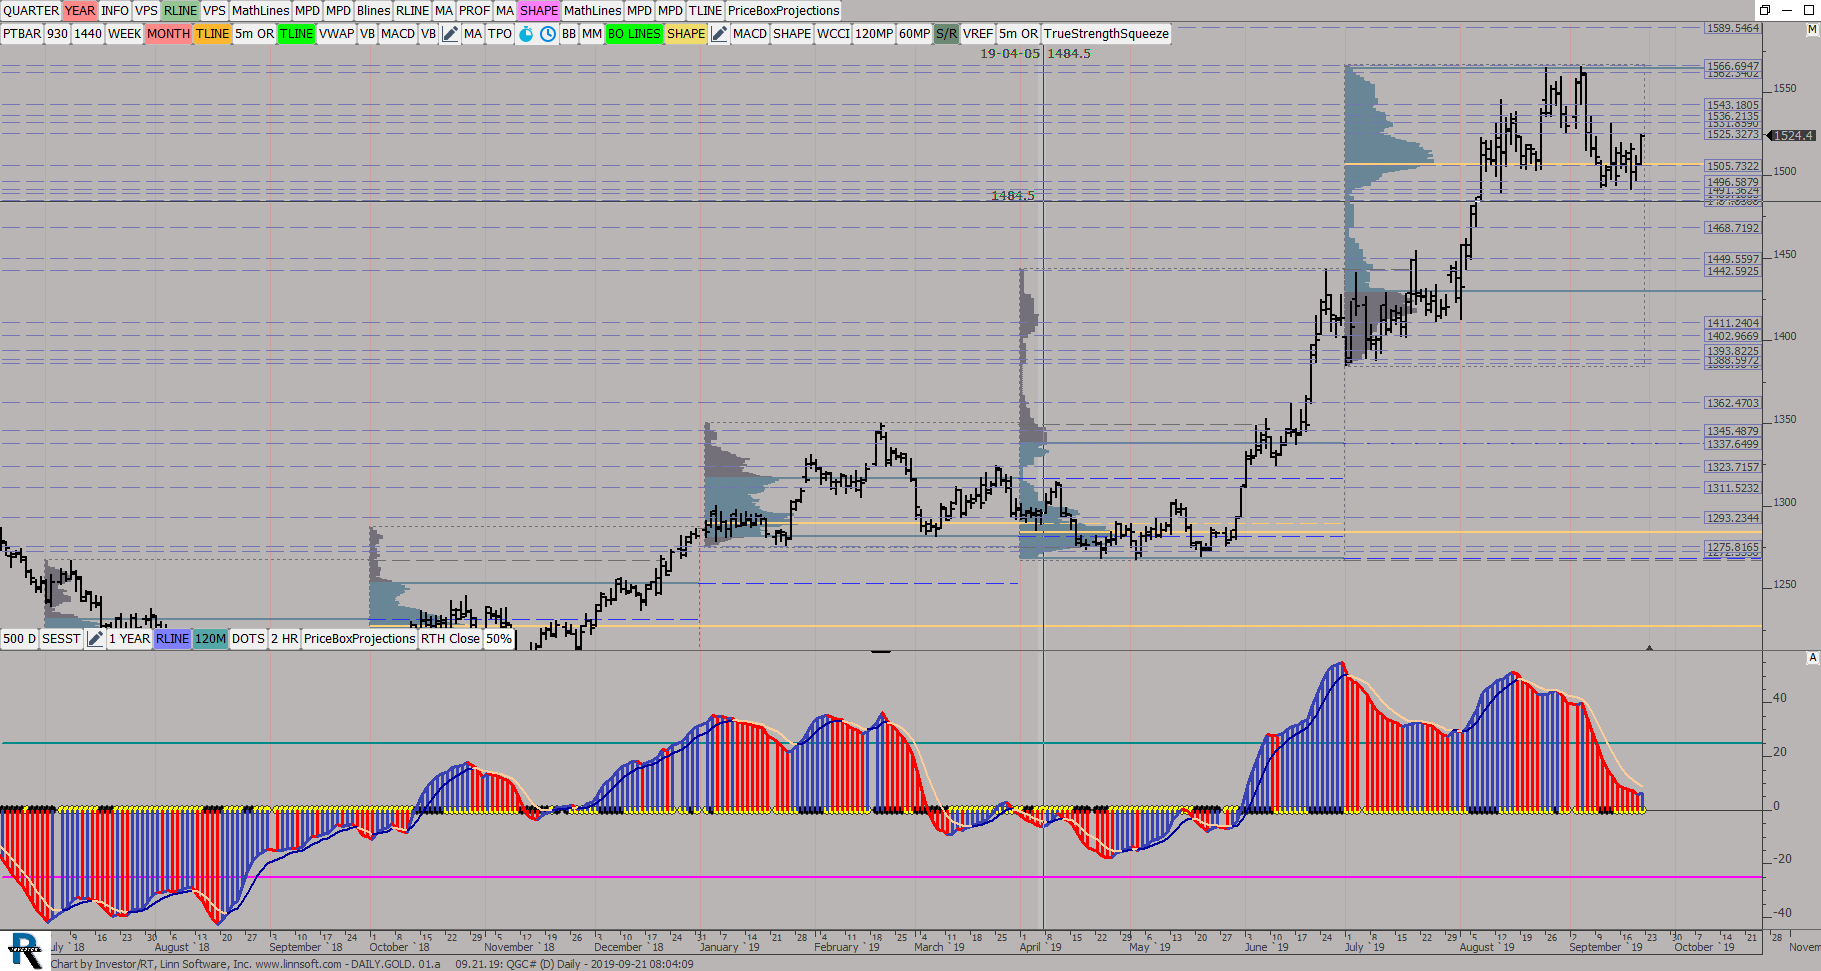 |
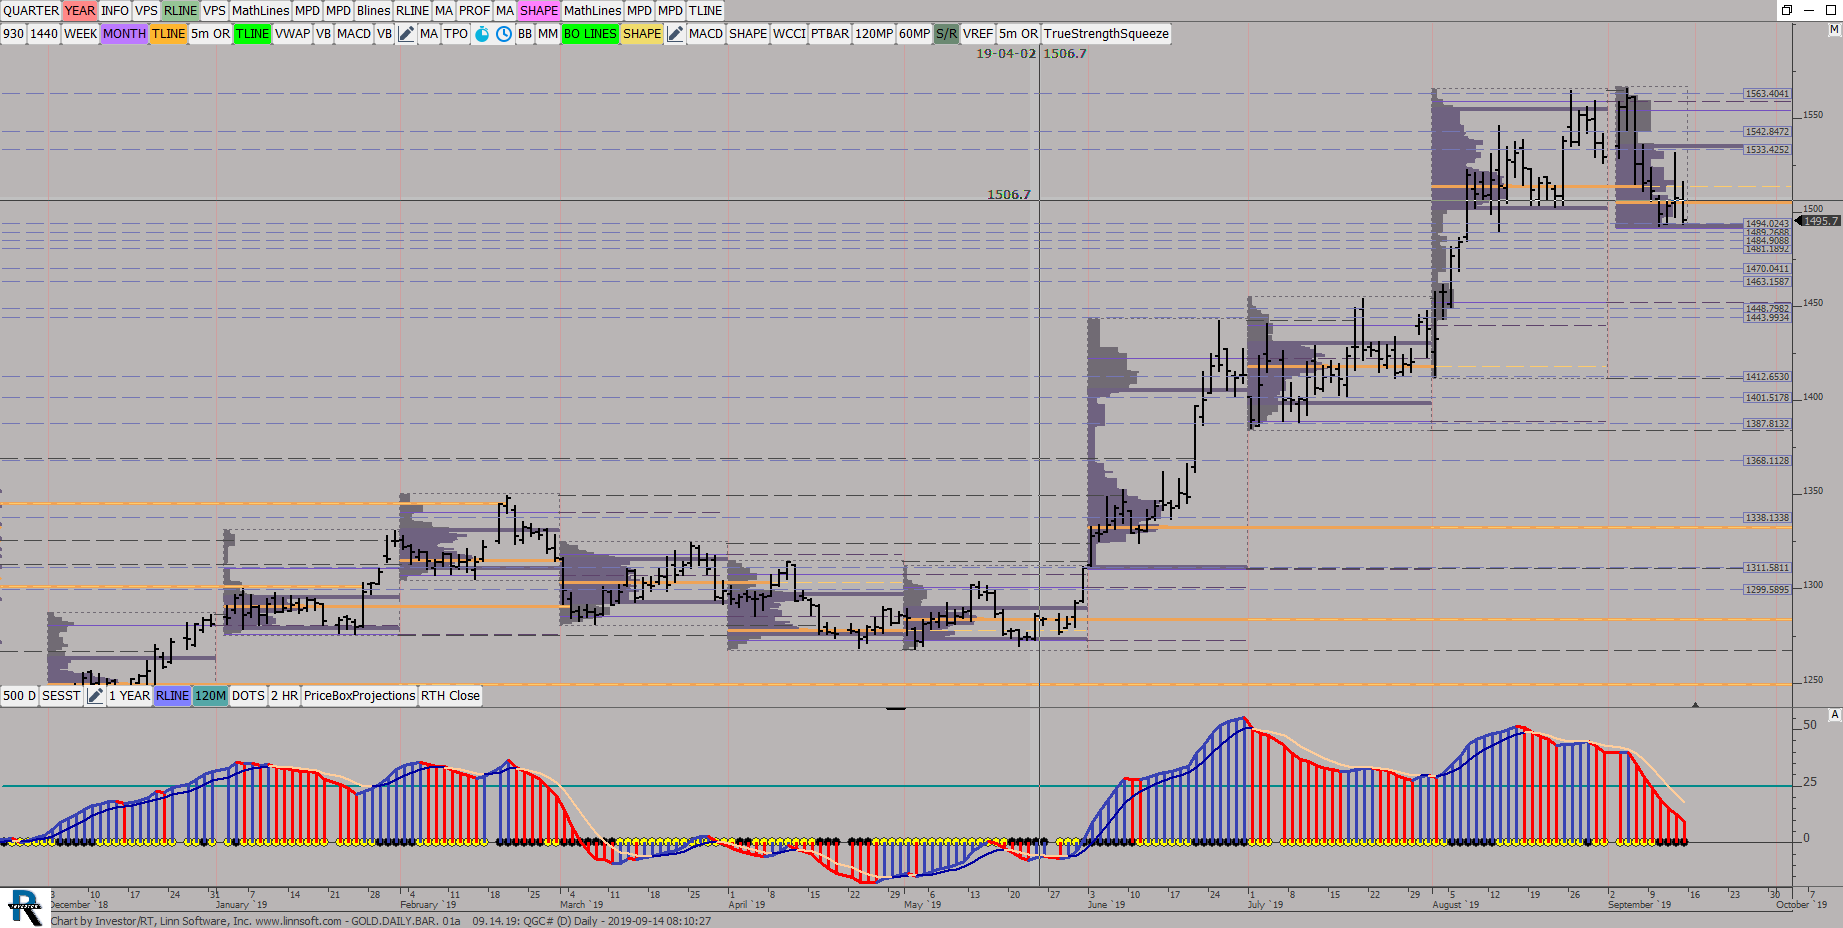
DAILYGOLD 01a (QGC#) ES42 [totalcount]
6 years 10 months ago
Quartly VP, Daily Candles. This chart was uploaded by Investor/RT 13.6.2 showing symbol: QGC#. |
View |
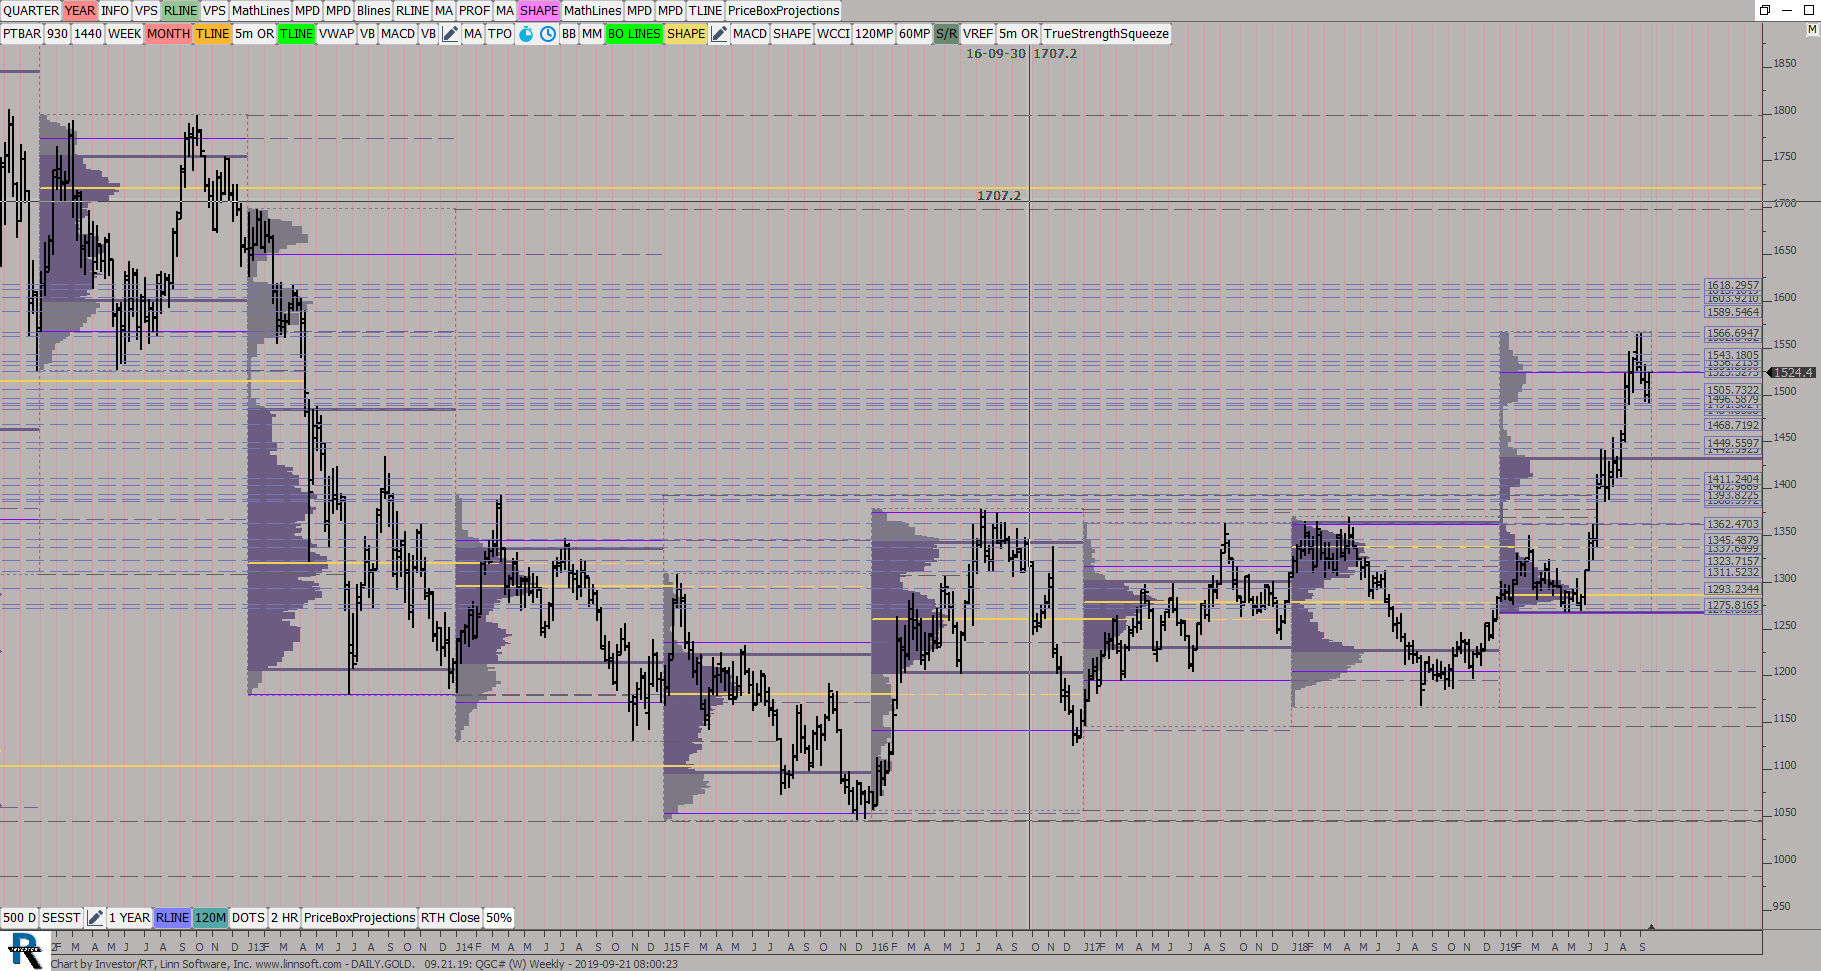 |
DAILYGOLD (QGC#) ES42 [totalcount]
6 years 10 months ago
YEARLY VP, Weekly Candles. This chart was uploaded by Investor/RT 13.6.2 showing symbol: QGC#. |
View |
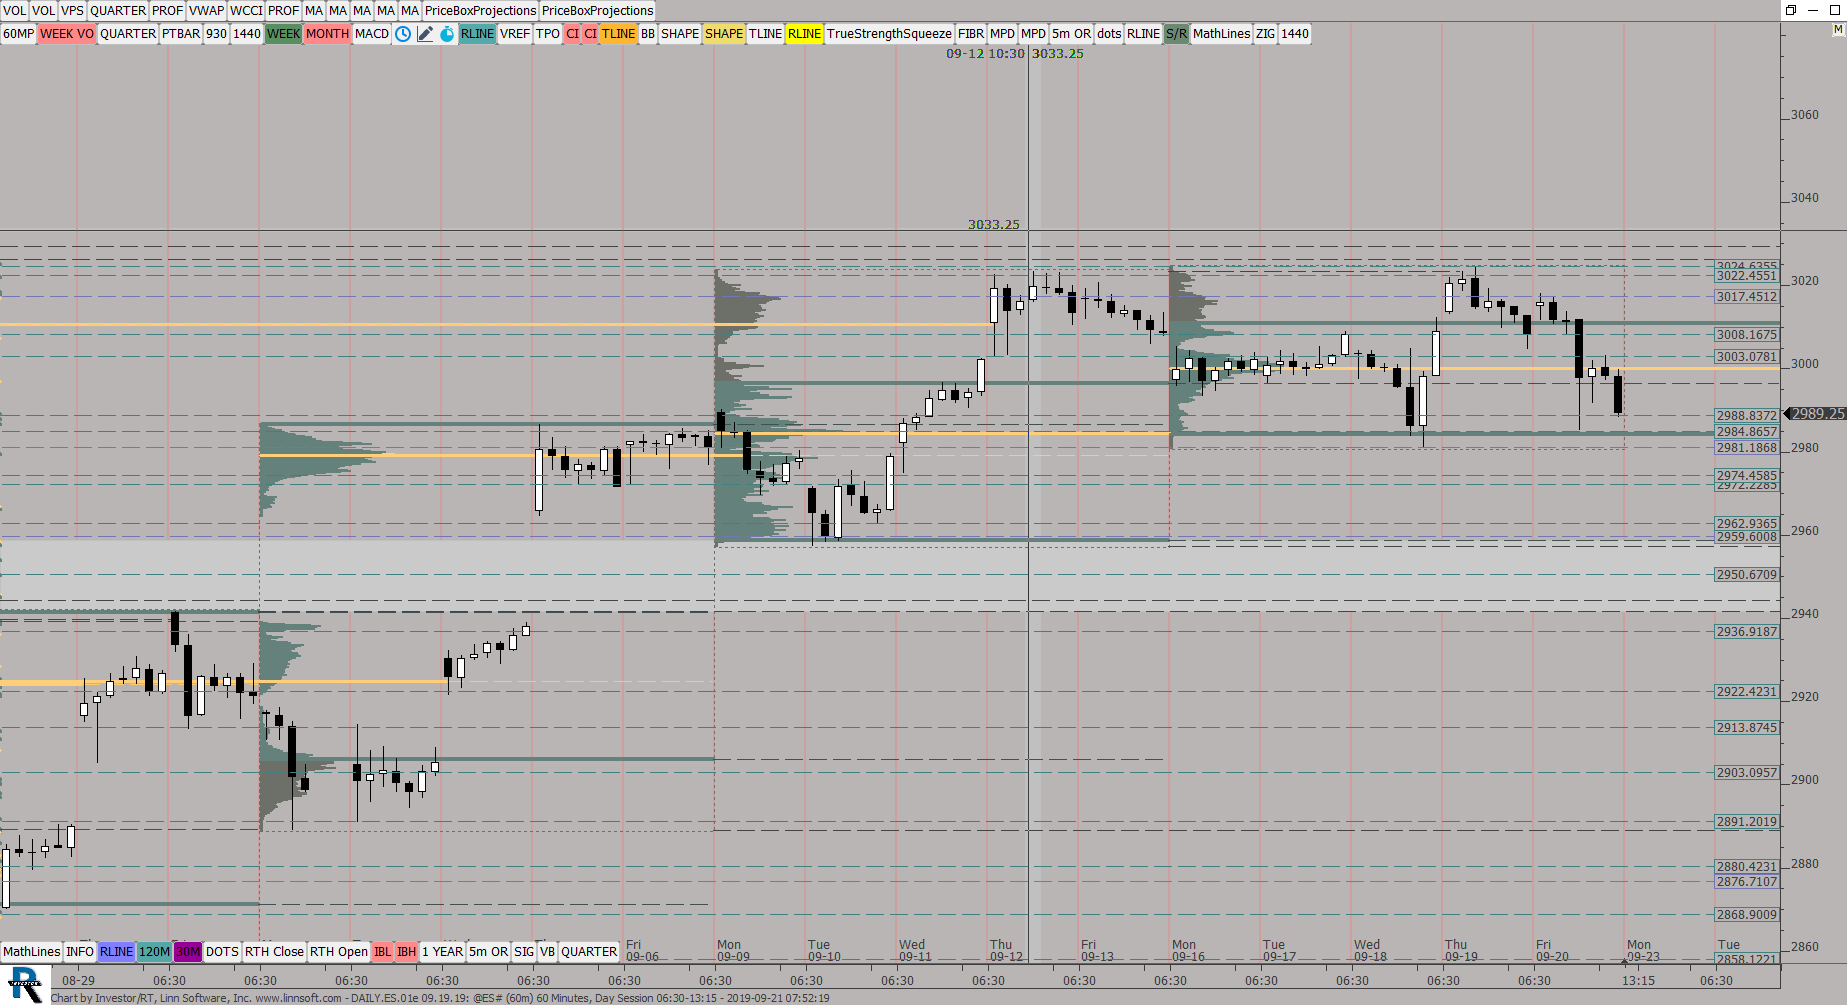 |
DAILYES01e (@ES#) ES42 [totalcount]
6 years 10 months ago
Weekly VP, 60 Min Candles. This chart was uploaded by Investor/RT 13.6.2 showing symbol: @ES#. |
View |
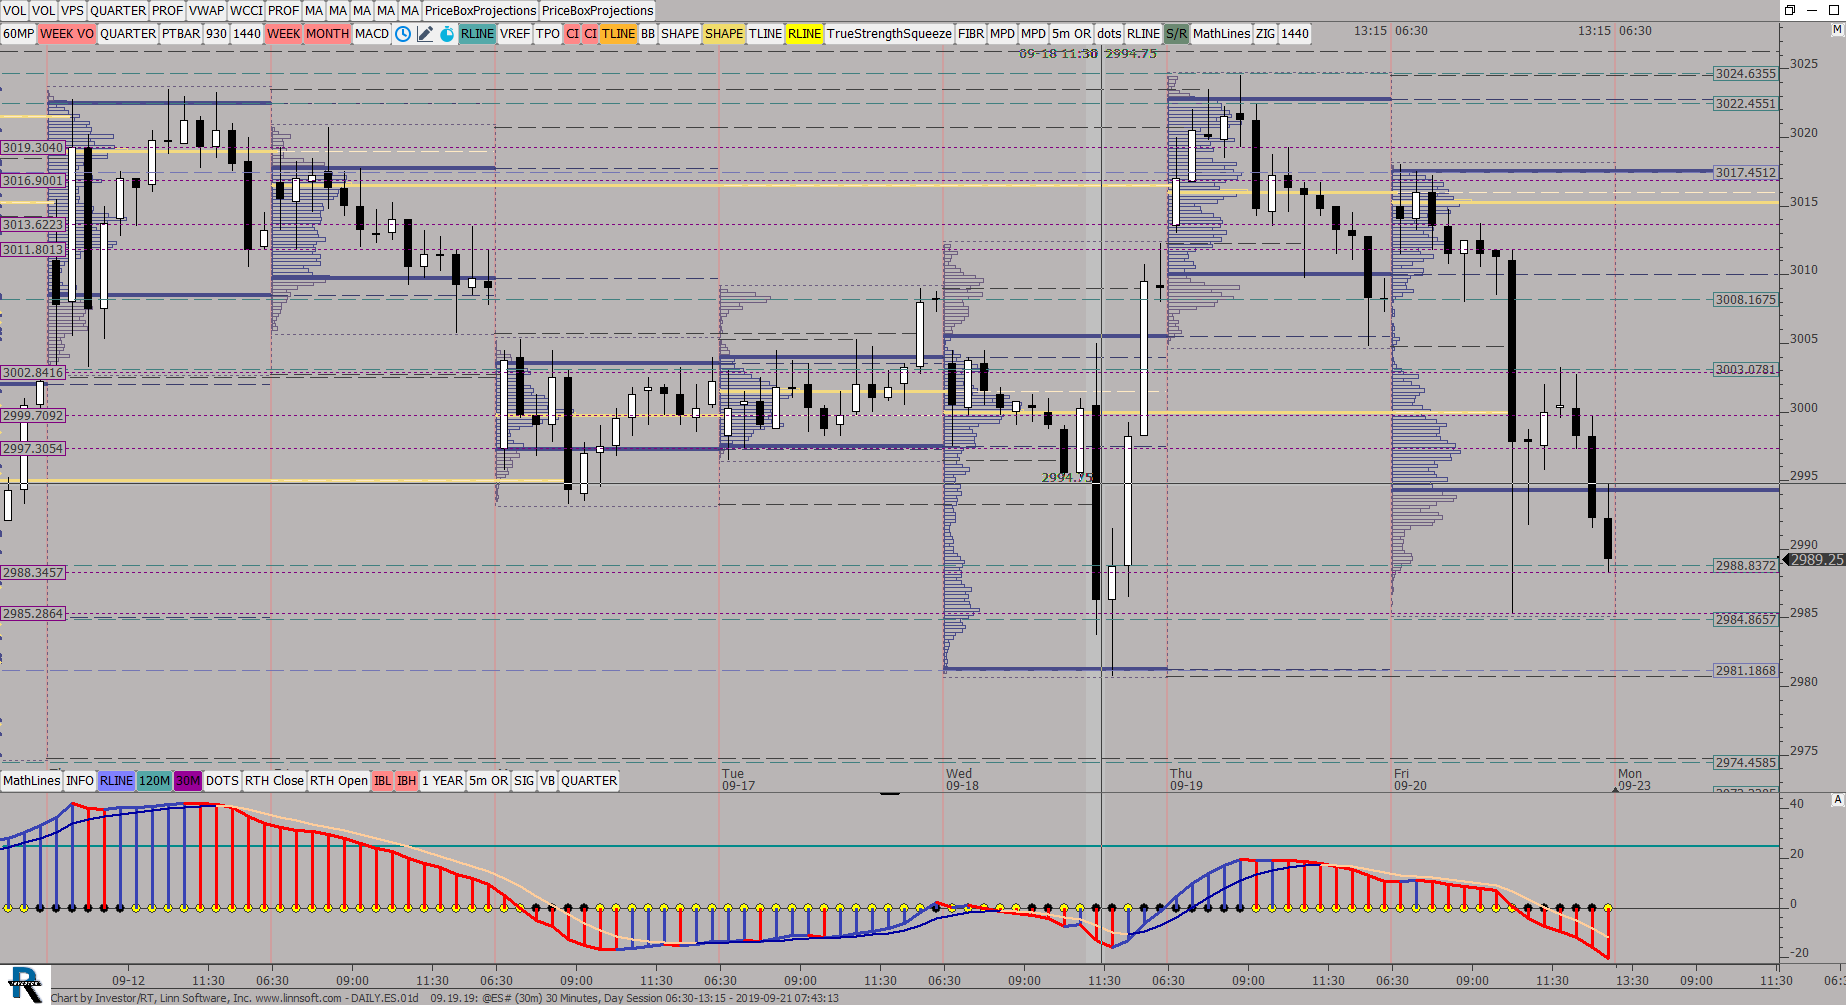 |
DAILYES01d (@ES#) ES42 [totalcount]
6 years 10 months ago
Daily VP, 30 Min Candles. This chart was uploaded by Investor/RT 13.6.2 showing symbol: @ES#. |
View |
 |
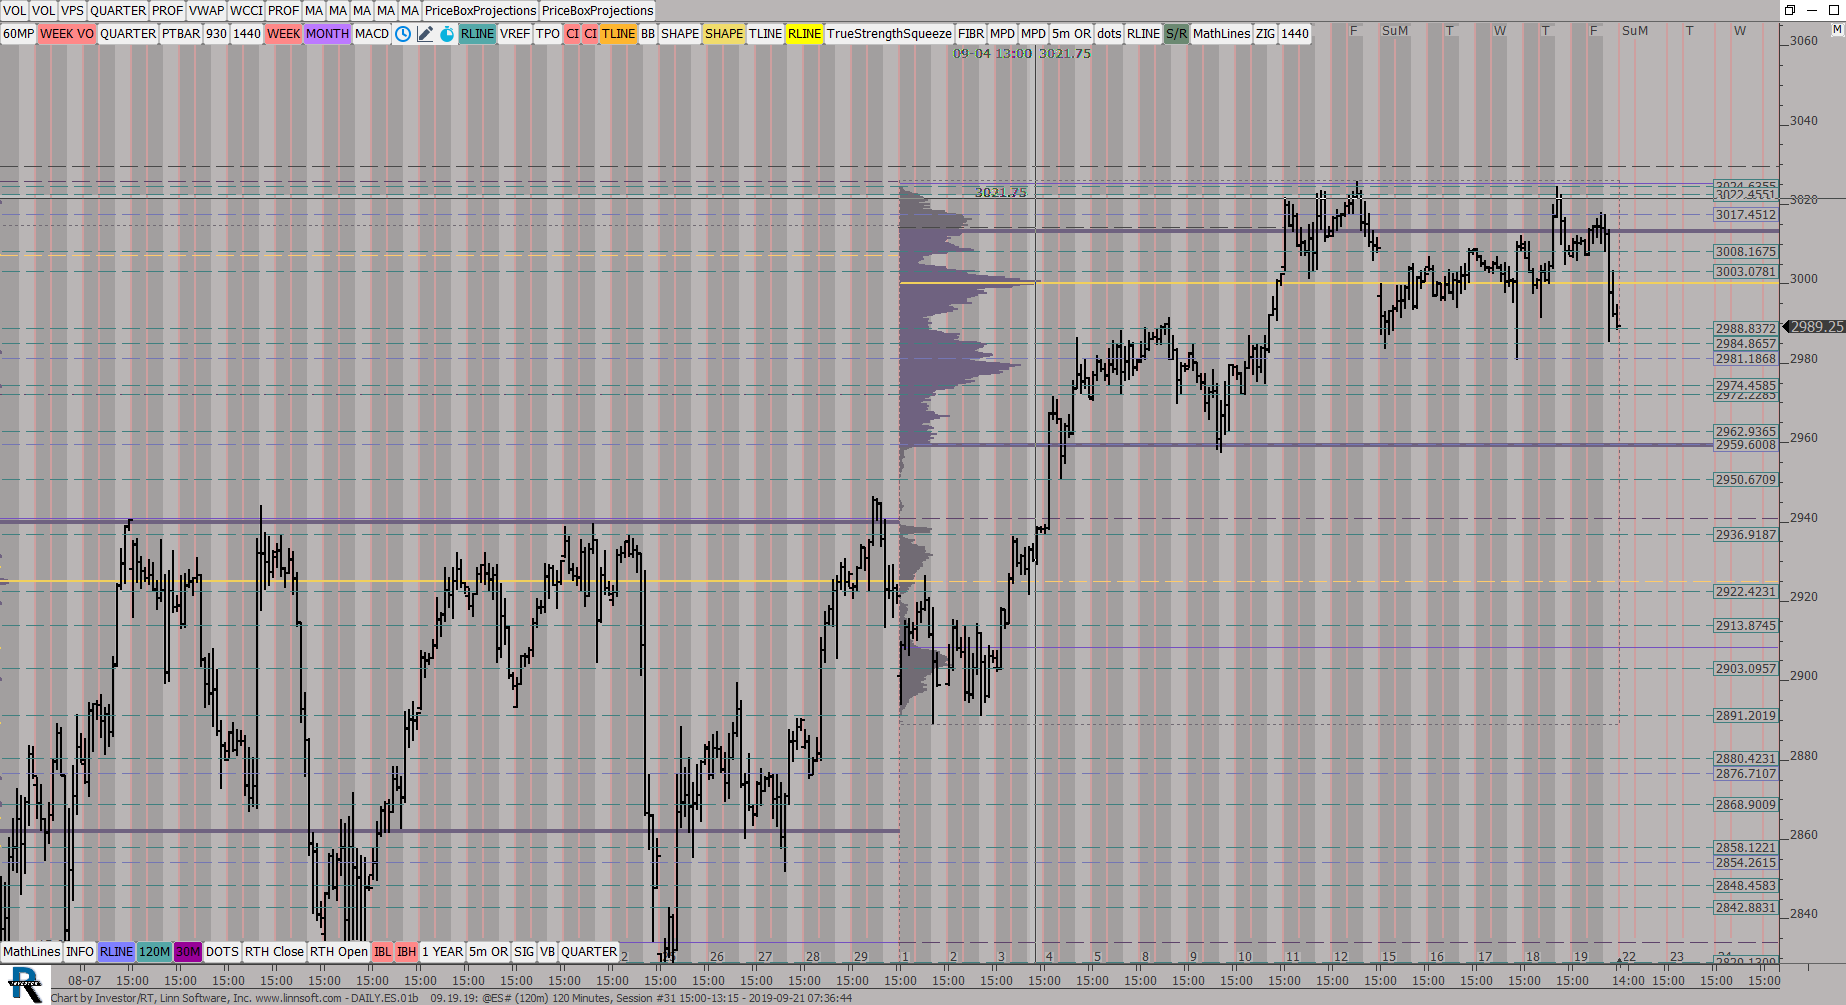
DAILYES01c (@ES#) ES42 [totalcount]
6 years 10 months ago
Monthly VP, 120 Min Candles. This chart was uploaded by Investor/RT 13.6.2 showing symbol: @ES#. |
View |
 |
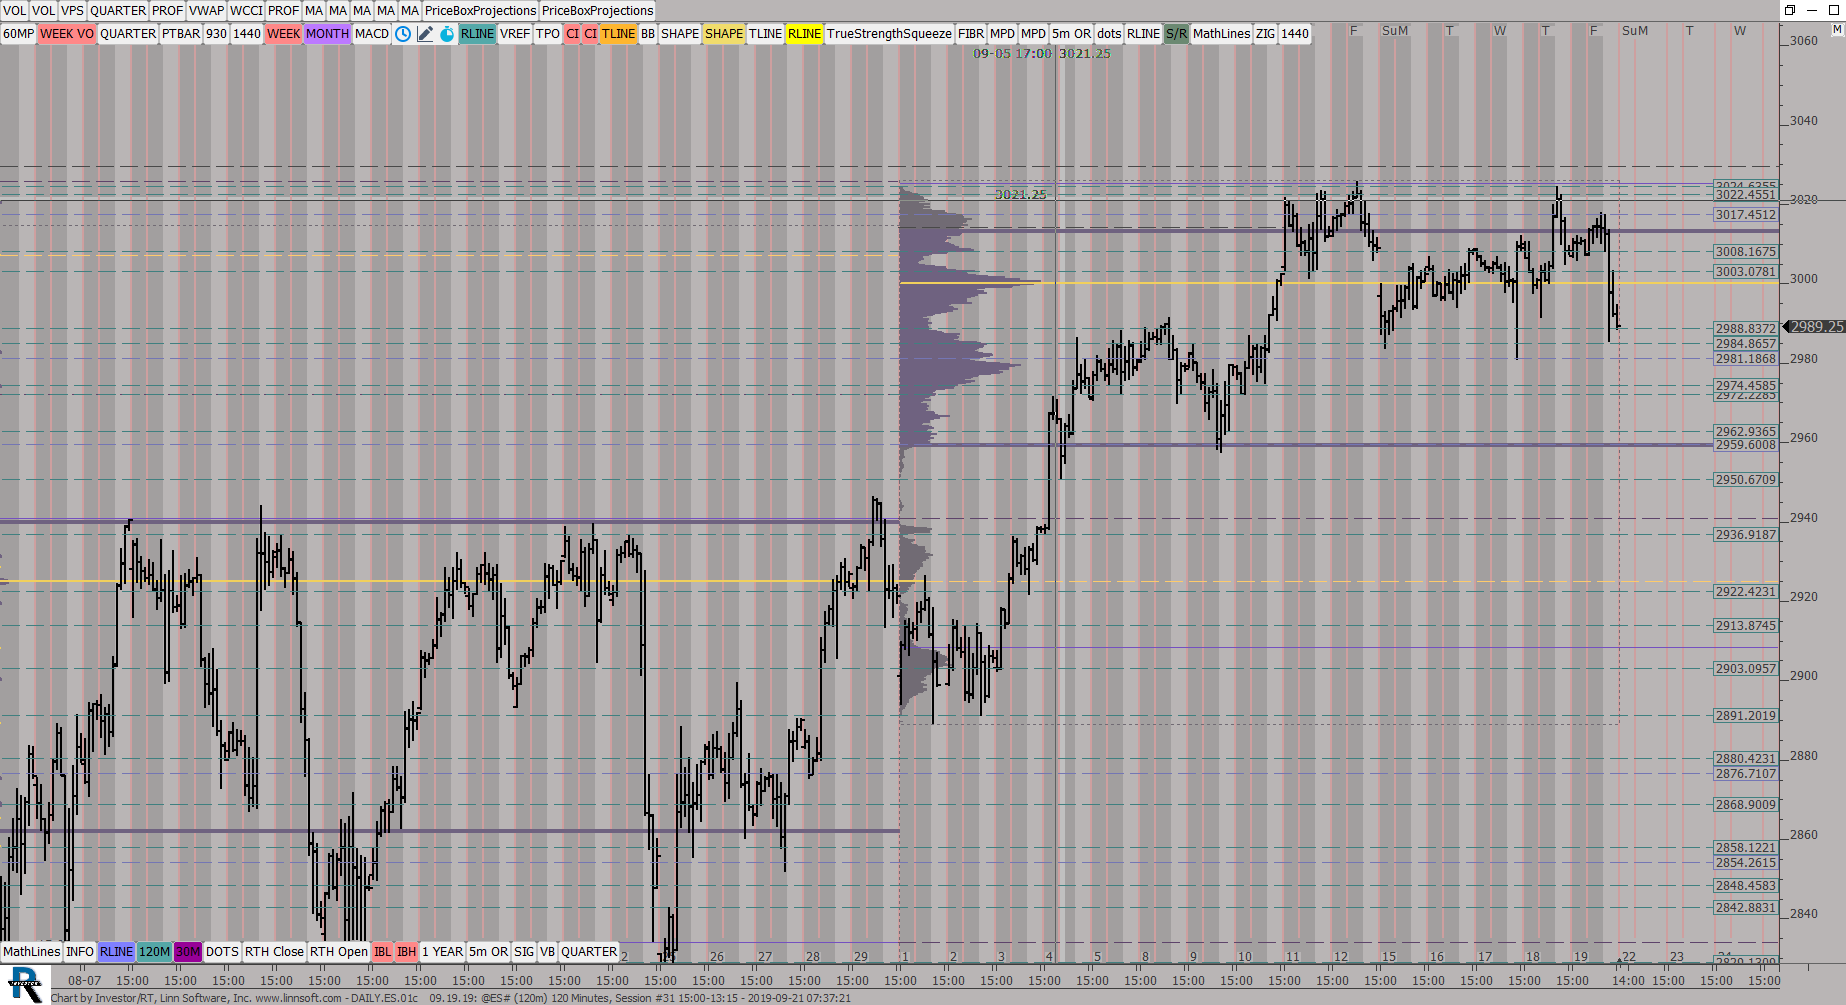
DAILYES01b (@ES#) ES42 [totalcount]
6 years 10 months ago
Weekly VP, 120 Min Candles. This chart was uploaded by Investor/RT 13.6.2 showing symbol: @ES#. |
View |
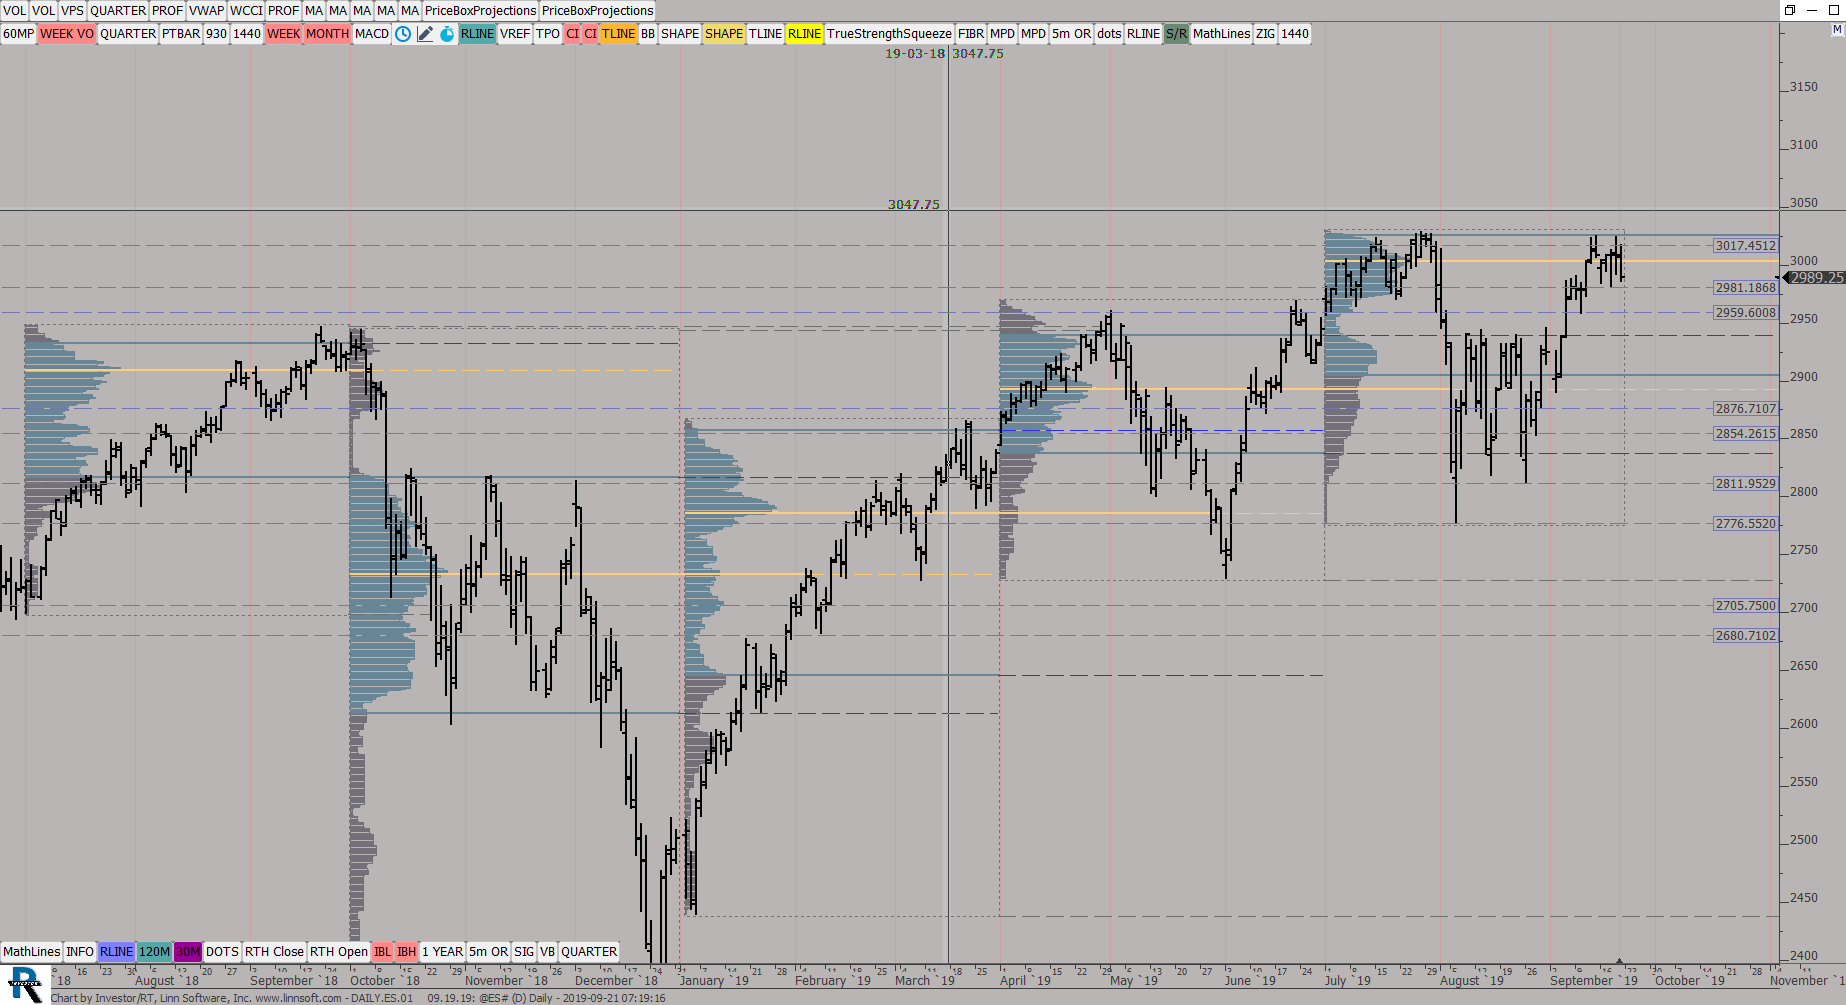 |
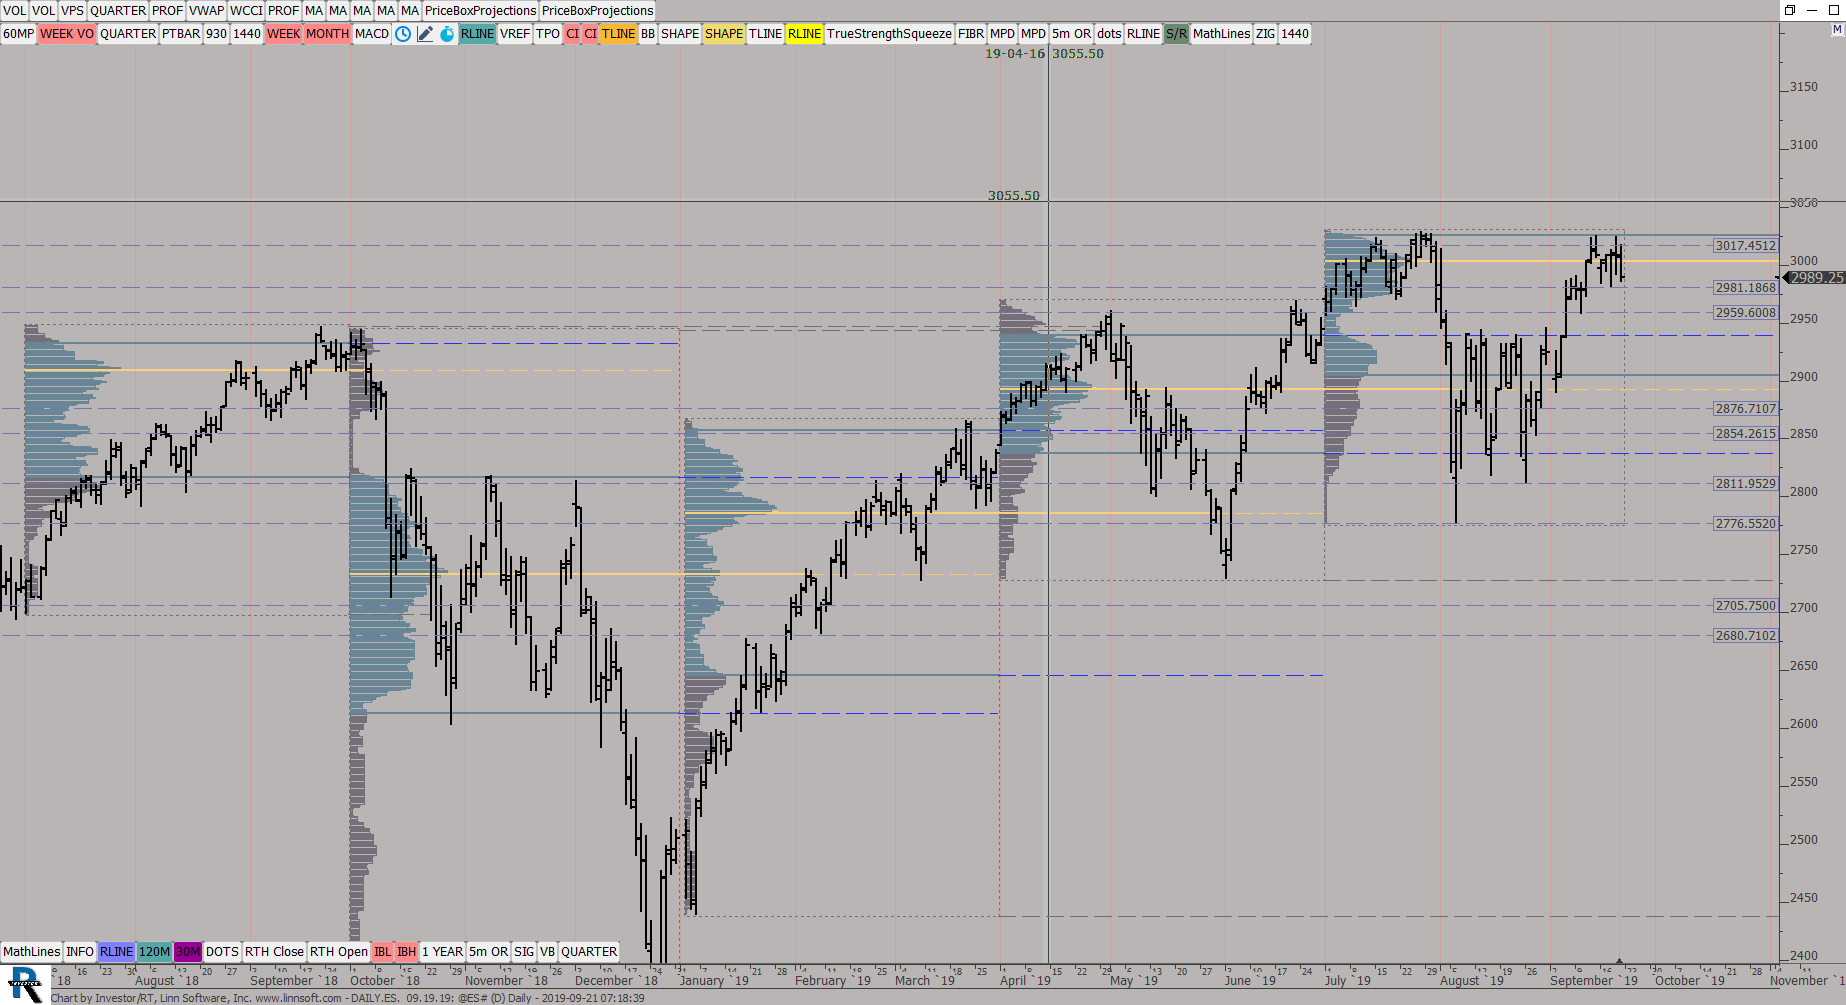
DAILYES01 (@ES#) ES42 [totalcount]
6 years 10 months ago
Quartly VP, Daily Candles. This chart was uploaded by Investor/RT 13.6.2 showing symbol: @ES#. |
View |
 |
DAILYES (@ES#) ES42 [totalcount]
6 years 10 months ago
Yearly VP, Daily Candles. This chart was uploaded by Investor/RT 13.6.2 showing symbol: @ES#. |
View |
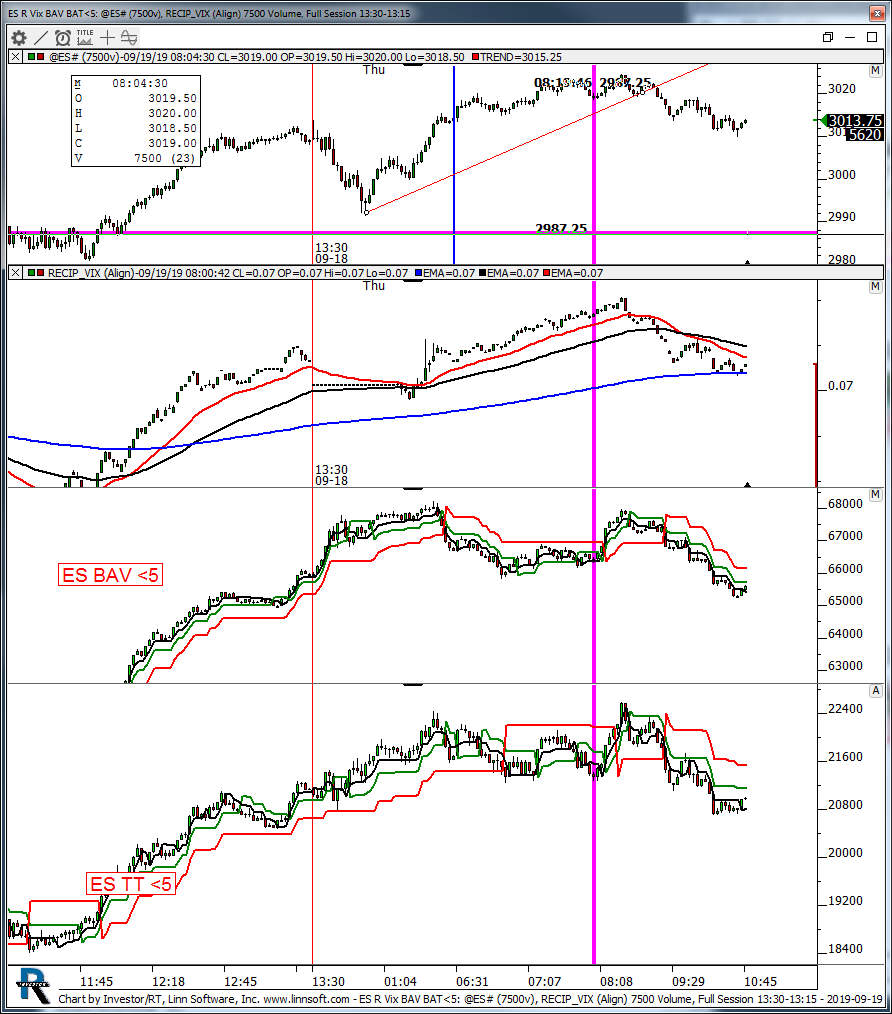 |
ES R Vix BAV BAT5 (@ES#) kencassorla [totalcount]
6 years 10 months ago
bav vs TT. This chart was uploaded by Investor/RT 13.6.1 showing symbol: @ES#. |
View |
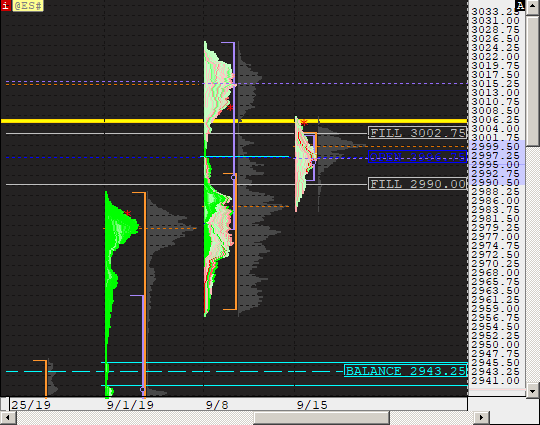 |
WEEKLY 24hr TPO (@ES#) aldica [totalcount]
6 years 10 months ago
WEEKLY 24HR TPO. This chart was uploaded by Investor/RT 13.6.1 showing symbol: @ES#. |
View |
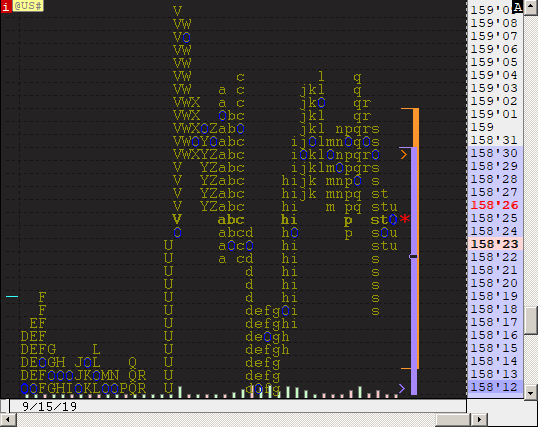 |
3 BONDS TPO (@US#) aldica [totalcount]
6 years 10 months ago
BONDS TPO. This chart was uploaded by Investor/RT 13.6.1 showing symbol: @US#. |
View |
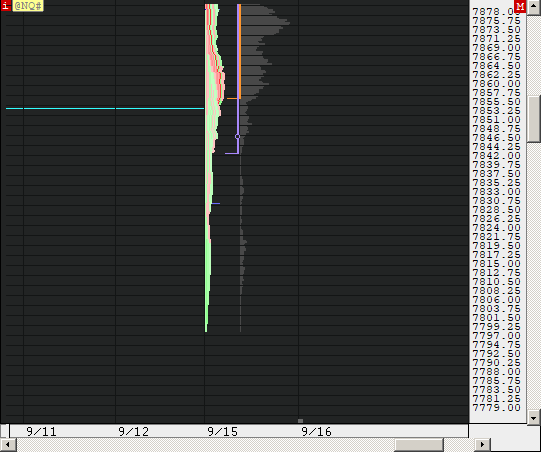 |
3 NQ 100 TPO (@NQ#) aldica [totalcount]
6 years 10 months ago
NQ TPO. This chart was uploaded by Investor/RT 13.6.1 showing symbol: @NQ#. |
View |
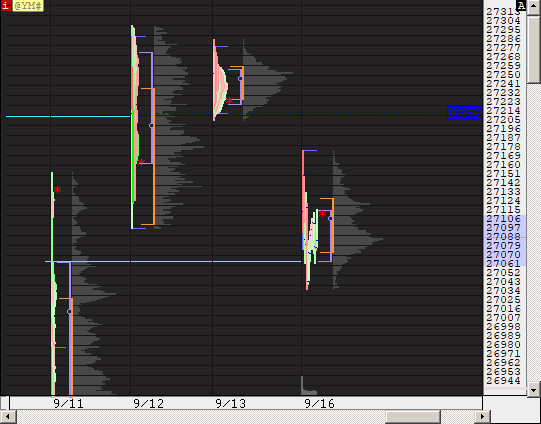 |
3 YM TPO (@YM#) aldica [totalcount]
6 years 10 months ago
YM TPO. This chart was uploaded by Investor/RT 13.6.1 showing symbol: @YM#. |
View |
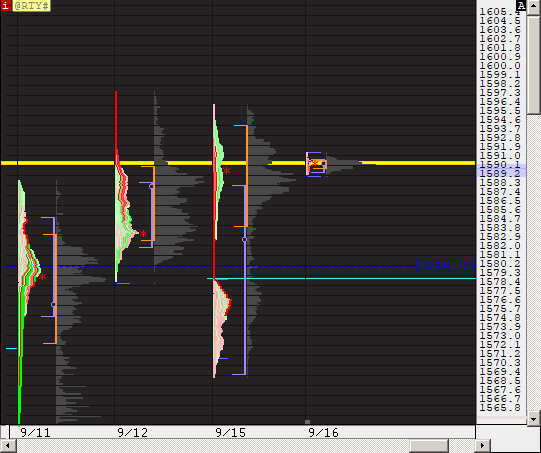 |
3 RTY TPO (@RTY#) aldica [totalcount]
6 years 10 months ago
RTY TPO. This chart was uploaded by Investor/RT 13.6.1 showing symbol: @RTY#. |
View |
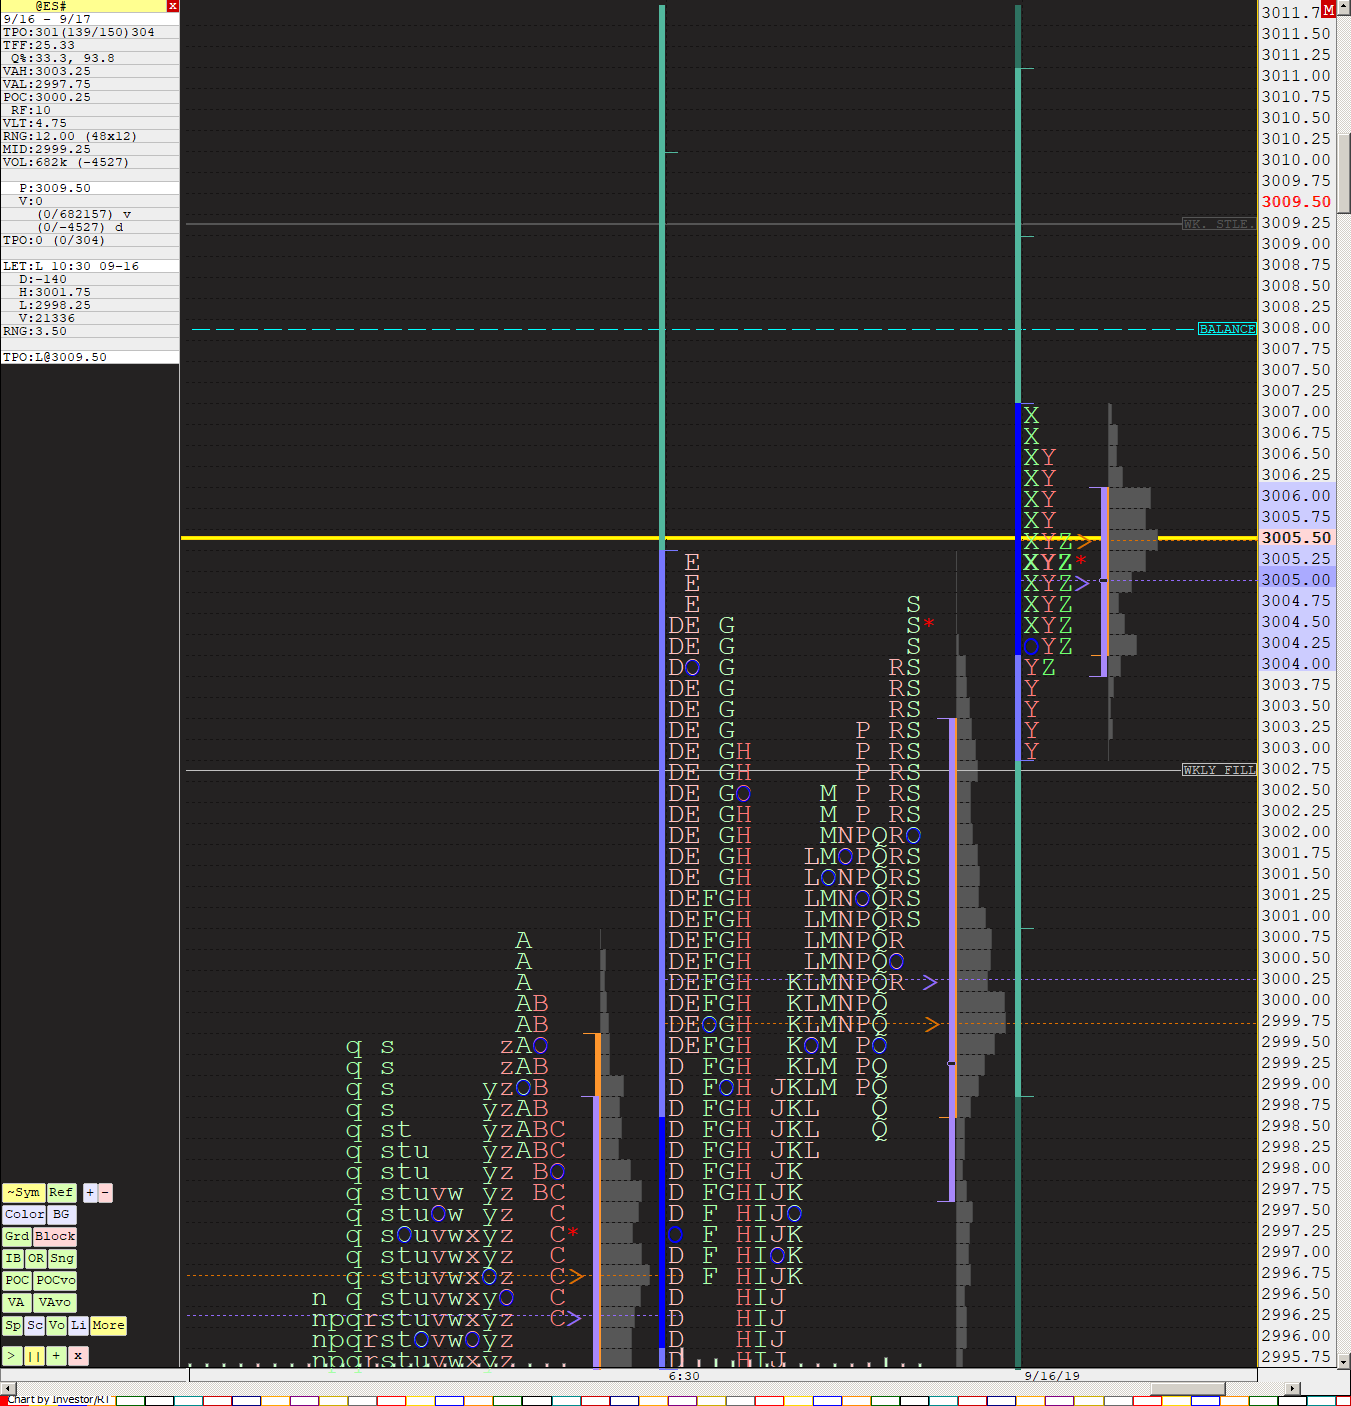 |
24hr TPO (@ES#) aldica [totalcount]
6 years 10 months ago
24 HOUR TPO. This chart was uploaded by Investor/RT 13.6.1 showing symbol: @ES#. |
View |
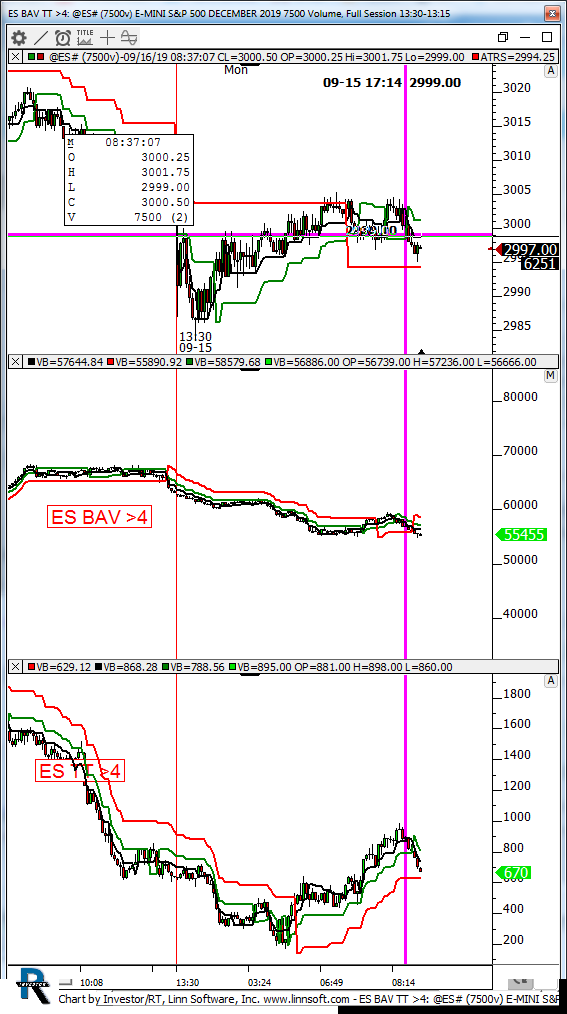 |
ES BAV TT 4 (@ES#) kencassorla [totalcount]
6 years 10 months ago
bav vs tt. This chart was uploaded by Investor/RT 13.6.1 showing symbol: @ES#. |
View |
 |
GCMPWEEKLY 01a (QGC#) ES42 [totalcount]
6 years 10 months ago
Weekly MP , and 120 min candles. This chart was uploaded by Investor/RT 13.5.24 showing symbol: QGC#. |
View |
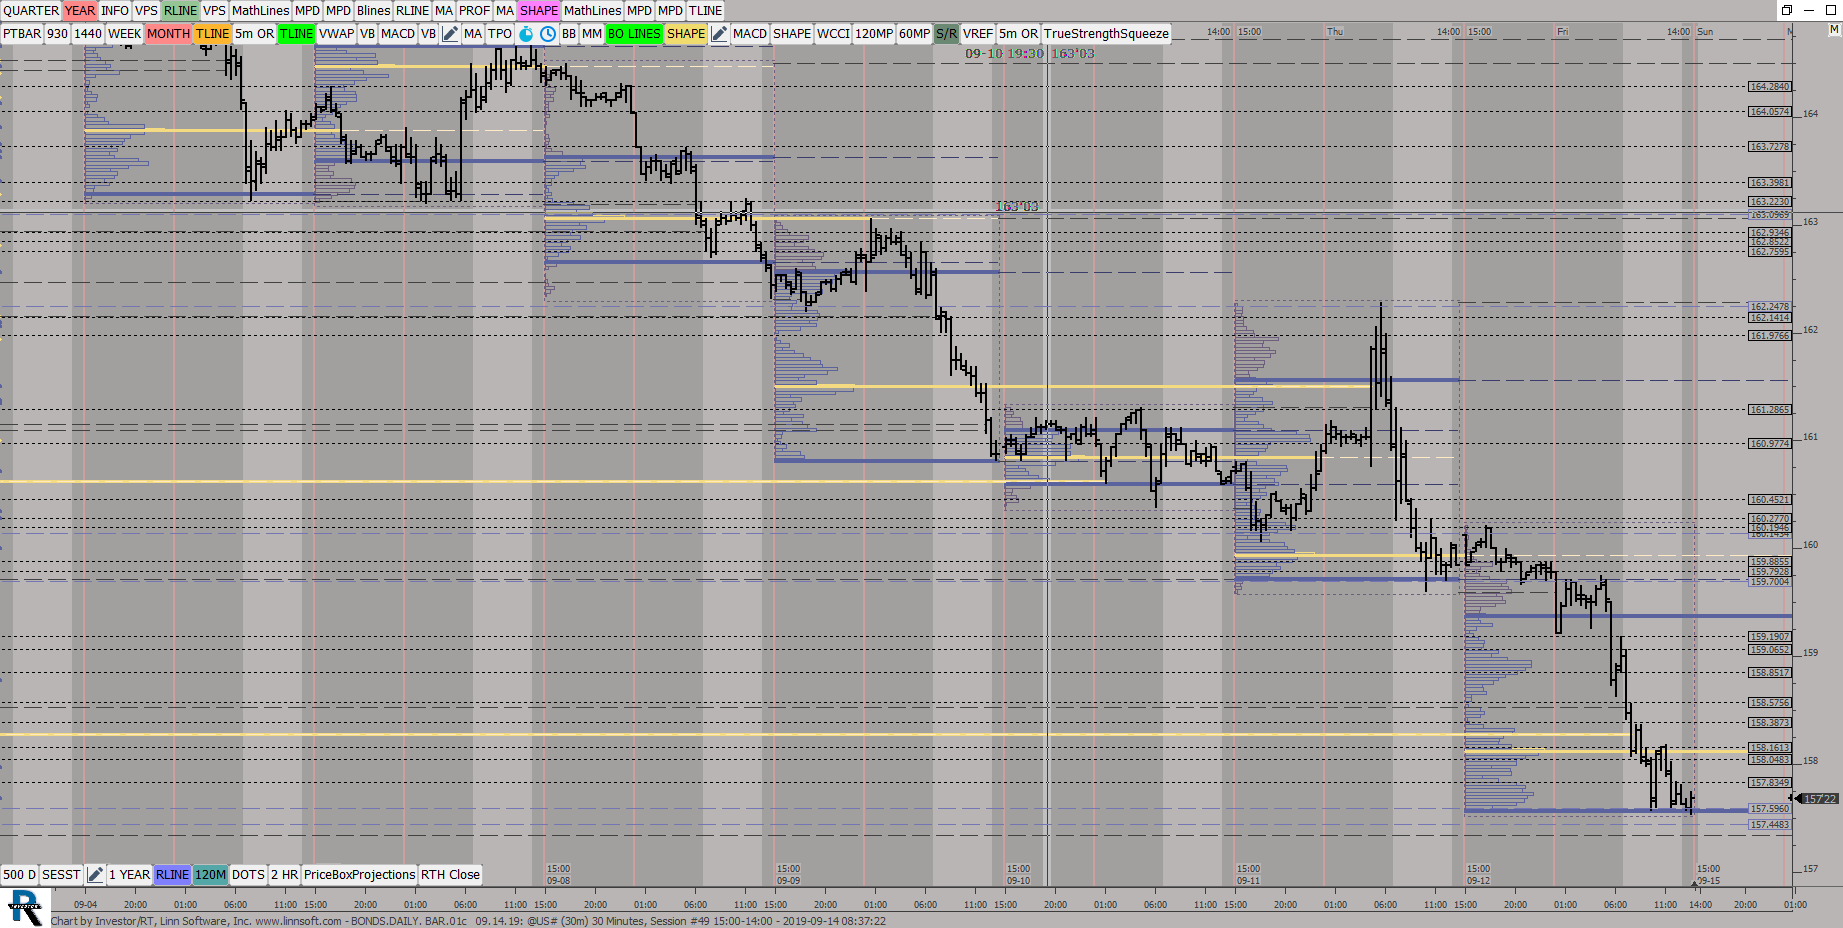 |
BONDSDAILY BAR01c (@US#) ES42 [totalcount]
6 years 10 months ago
Daily VP , 30 MIN Candles. This chart was uploaded by Investor/RT 13.6.1 showing symbol: @US#. |
View |
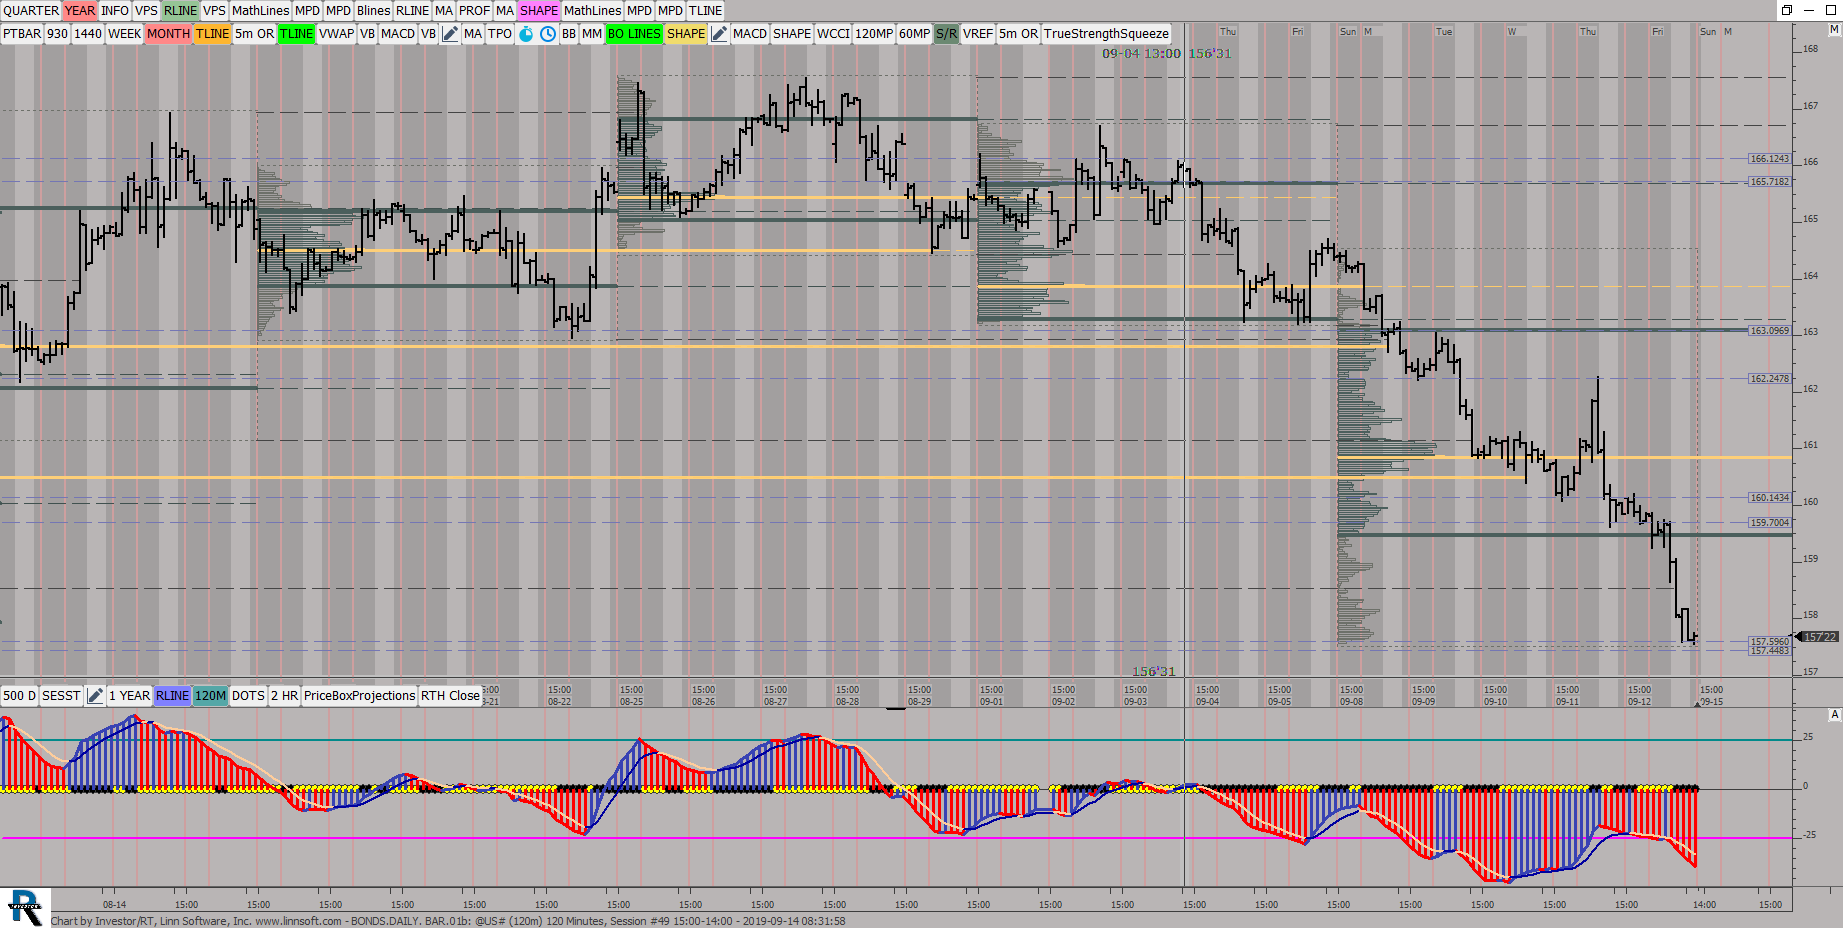 |
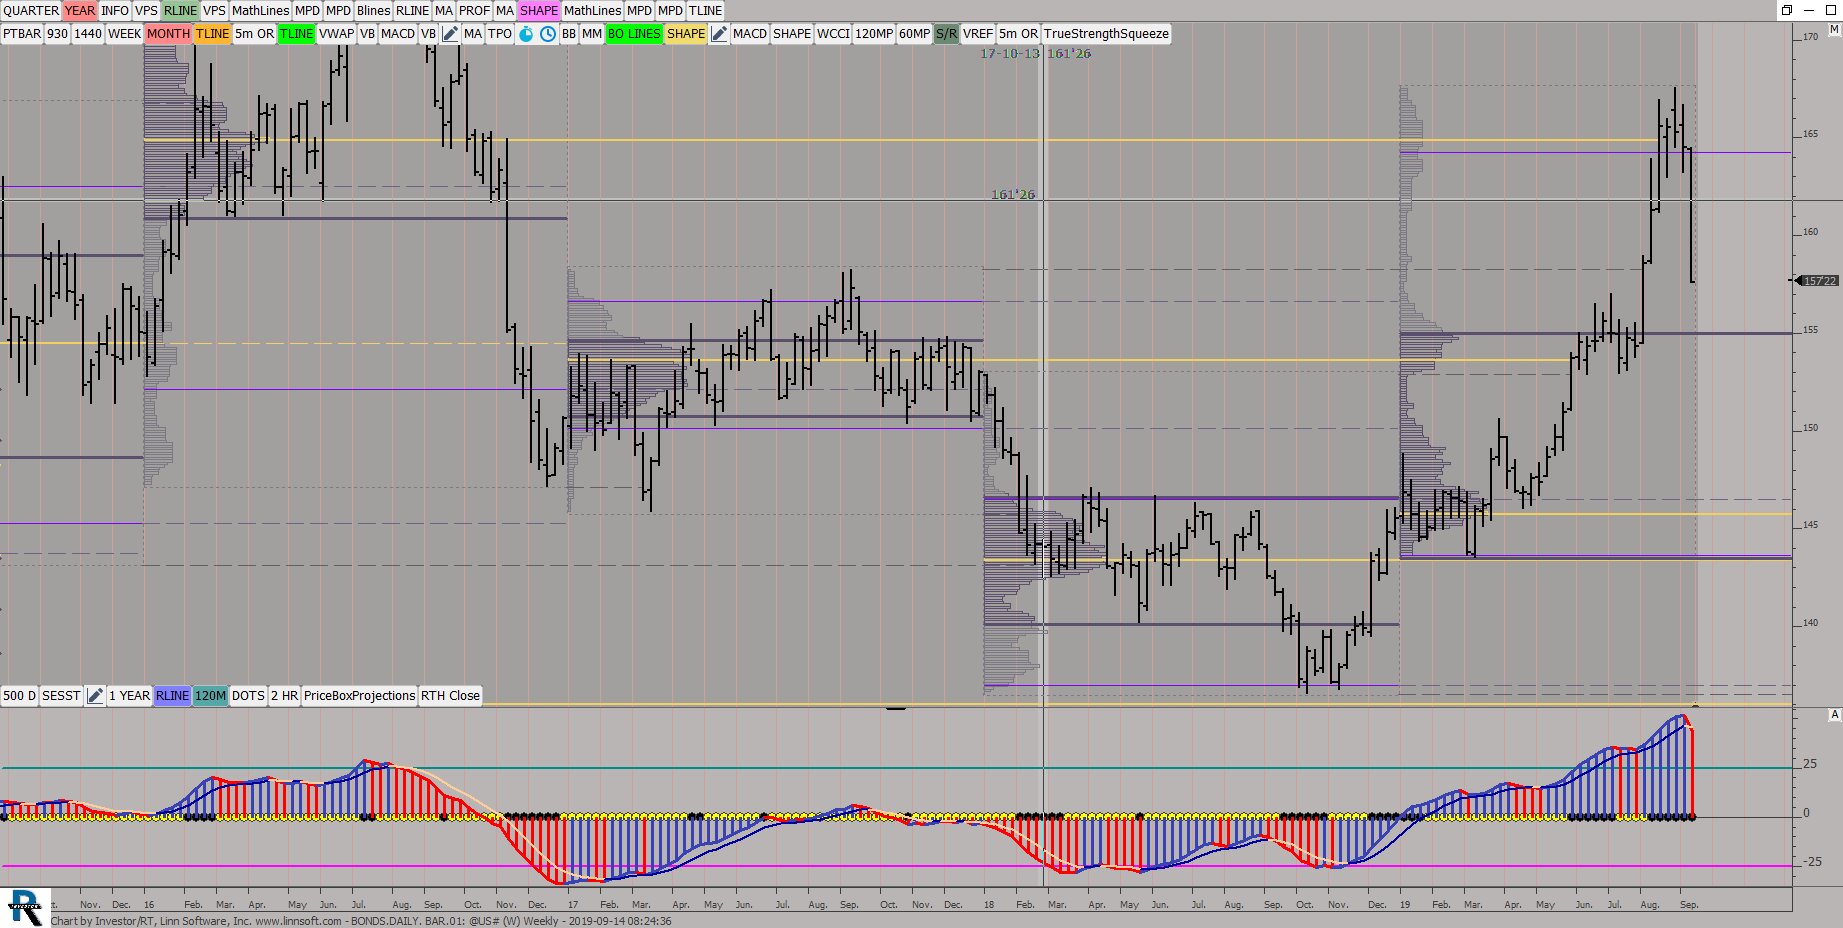
BONDSDAILY BAR01b (@US#) ES42 [totalcount]
6 years 10 months ago
Weekly VP, 120 Min Candles. This chart was uploaded by Investor/RT 13.6.1 showing symbol: @US#. |
View |
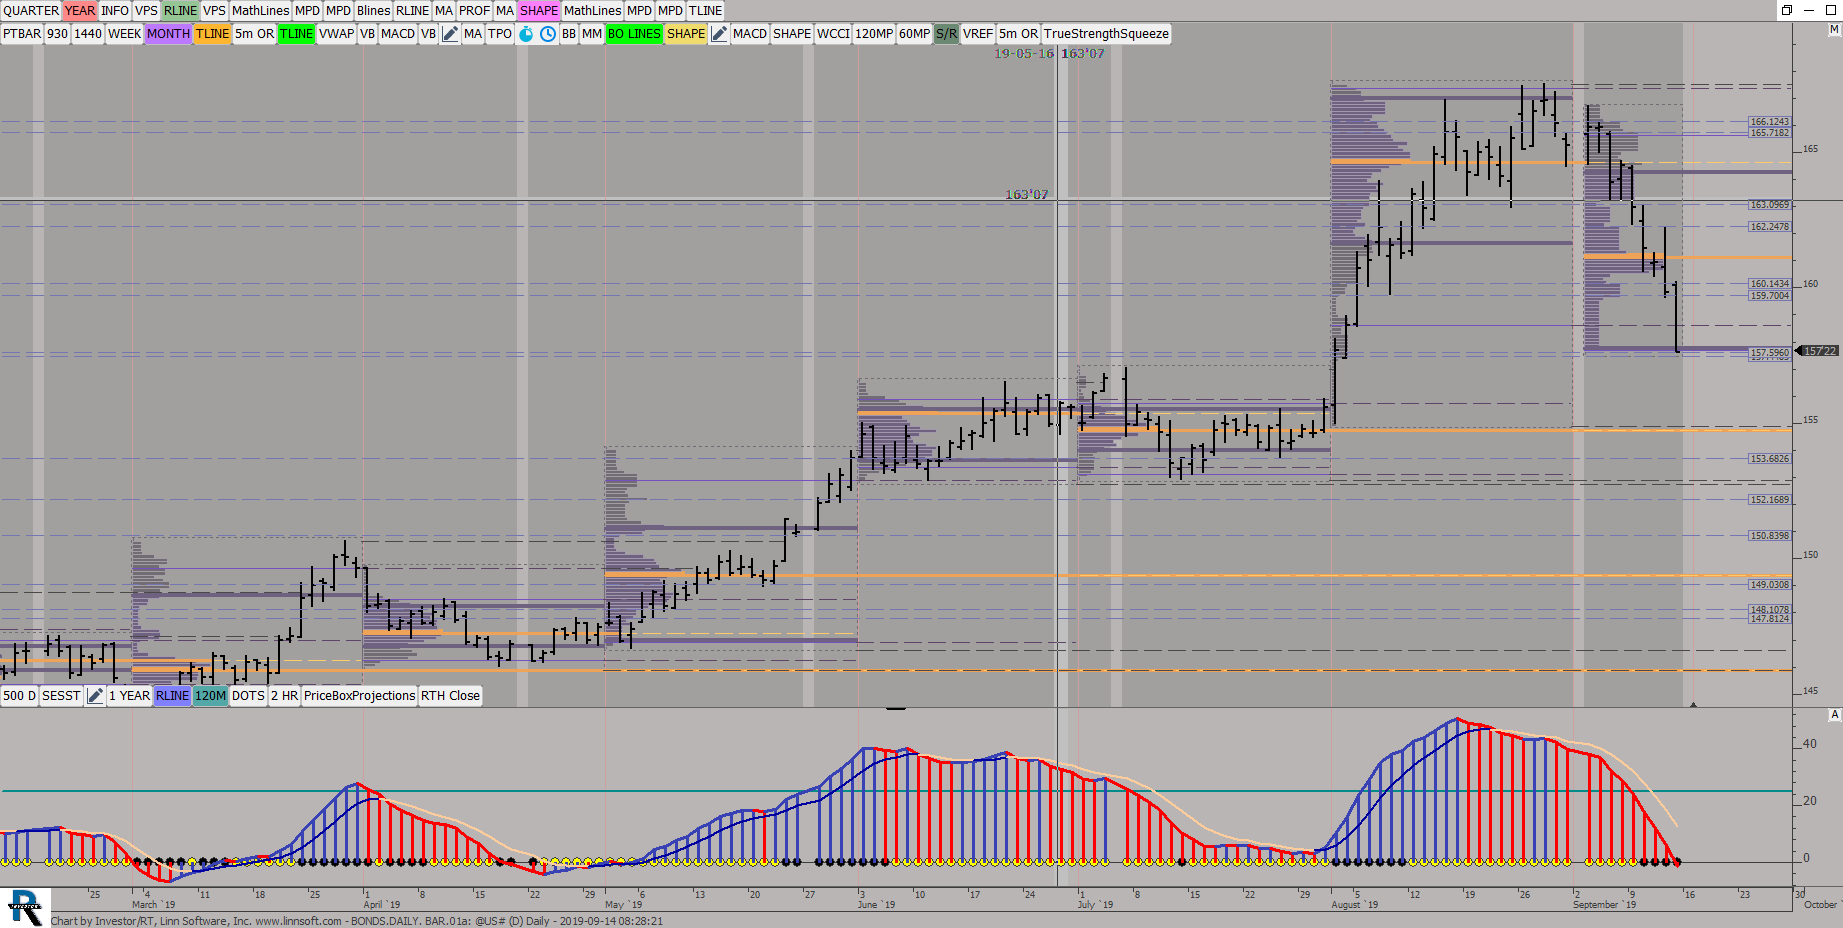 |
BONDSDAILY BAR01a (@US#) ES42 [totalcount]
6 years 10 months ago
Monthly VP, Daily Candles. This chart was uploaded by Investor/RT 13.6.1 showing symbol: @US#. |
View |
 |
BONDSDAILY BAR (@US#) ES42 [totalcount]
6 years 10 months ago
Yeaarly VP, Weekly Candles. This chart was uploaded by Investor/RT 13.6.1 showing symbol: @US#. |
View |
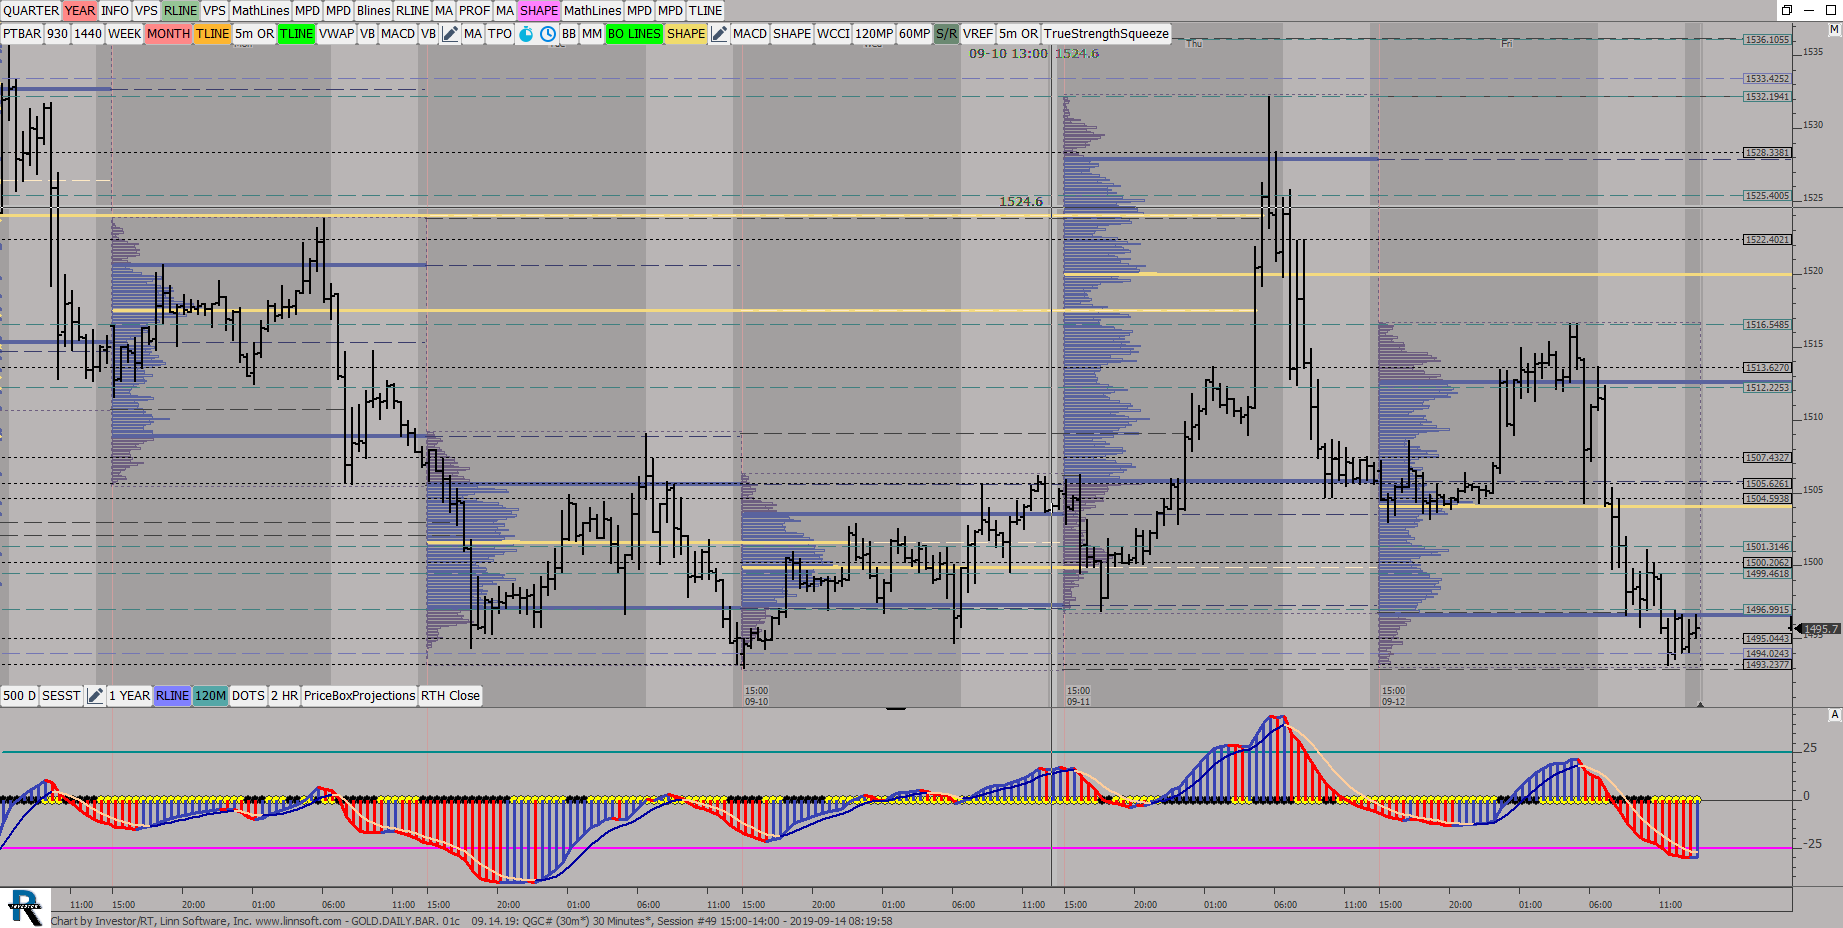 |
GOLDDAILYBAR 01c (QGC#) ES42 [totalcount]
6 years 10 months ago
Daily VP, 30 Min Candles. This chart was uploaded by Investor/RT 13.6.1 showing symbol: QGC#. |
View |
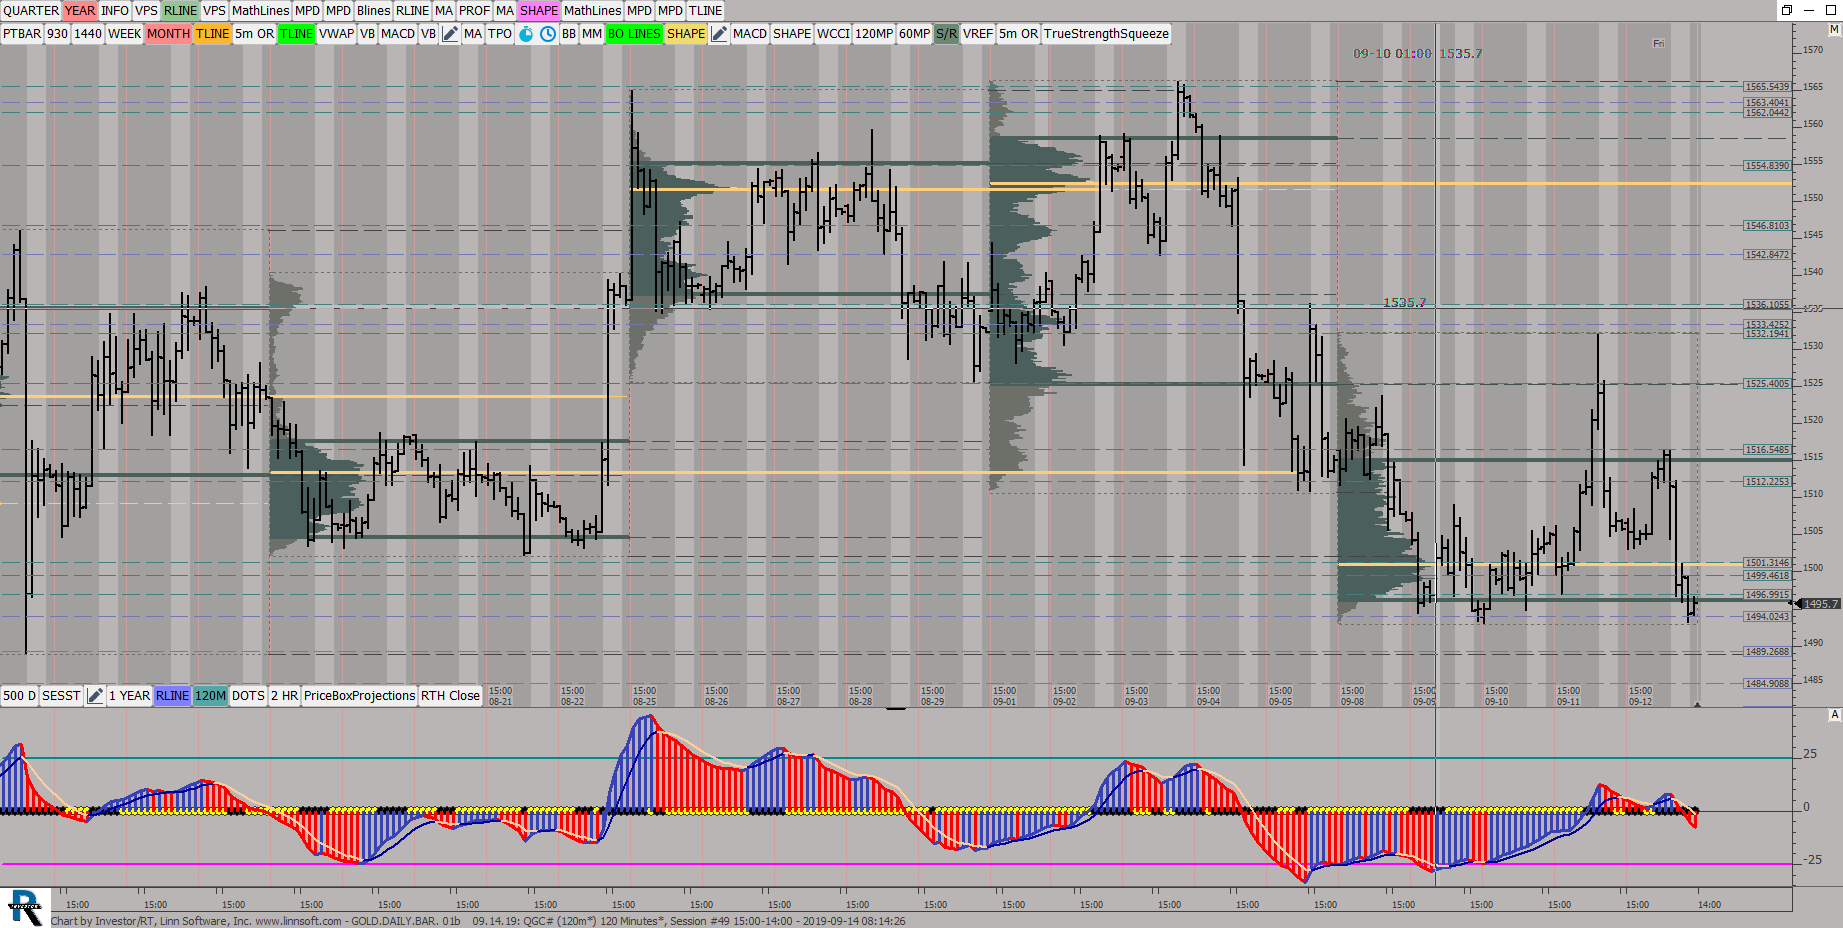 |
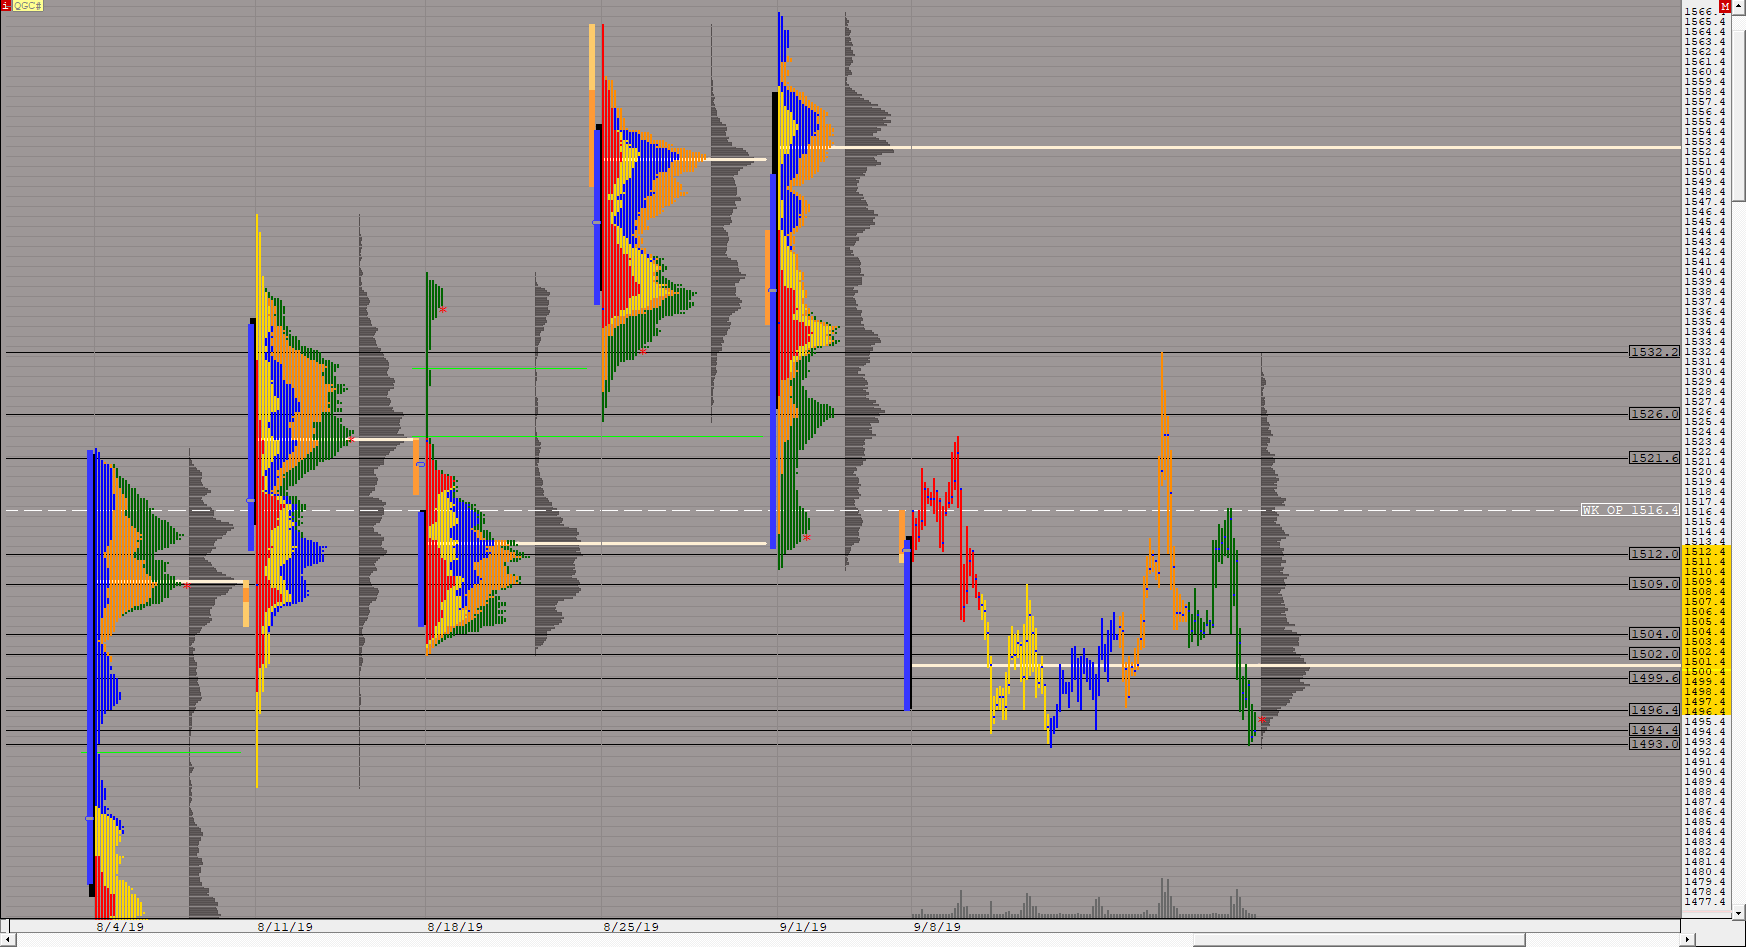
GOLDDAILYBAR 01b (QGC#) ES42 [totalcount]
6 years 10 months ago
Weekly VP, 120 Min Candles. This chart was uploaded by Investor/RT 13.6.1 showing symbol: QGC#. |
View |
 |
GOLDDAILYBAR 01a (QGC#) ES42 [totalcount]
6 years 10 months ago
Monthly VP, Daily Candles. This chart was uploaded by Investor/RT 13.6.1 showing symbol: QGC#. |
View |