 |
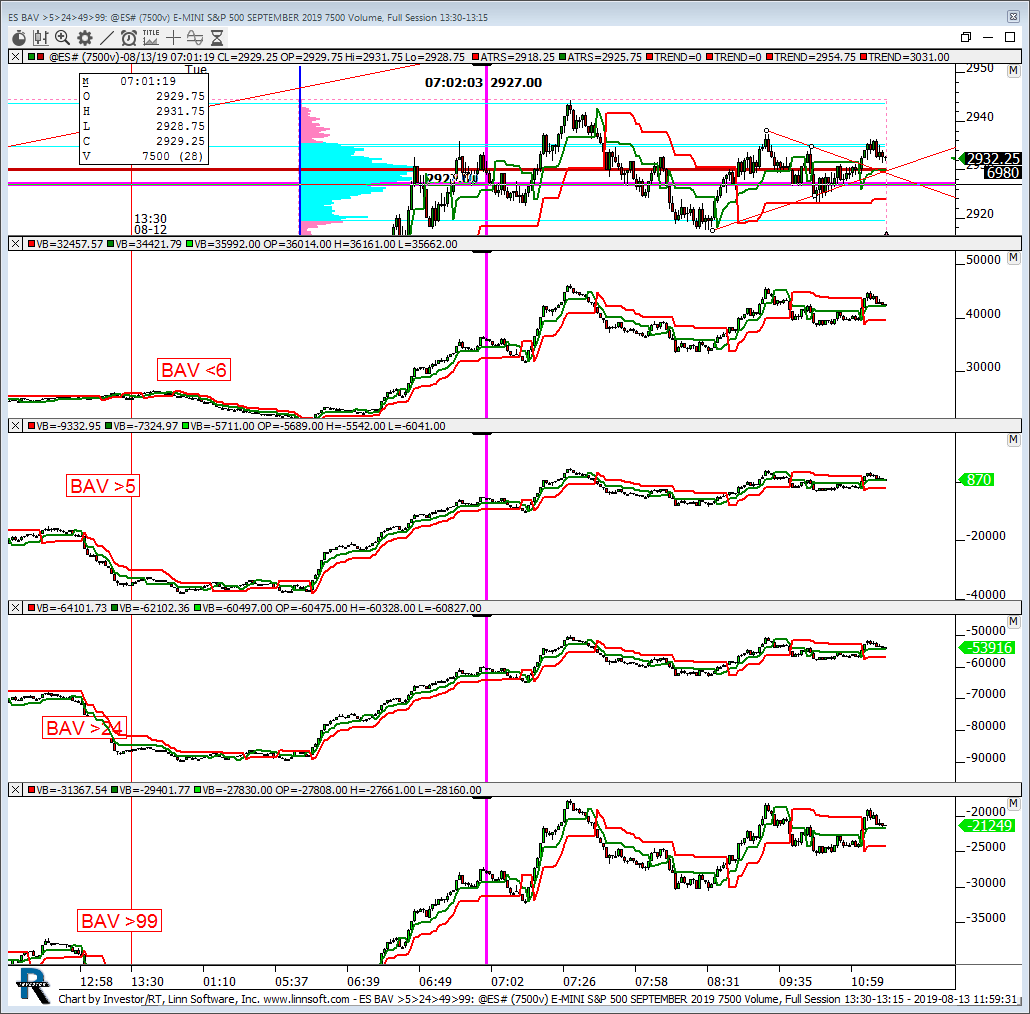
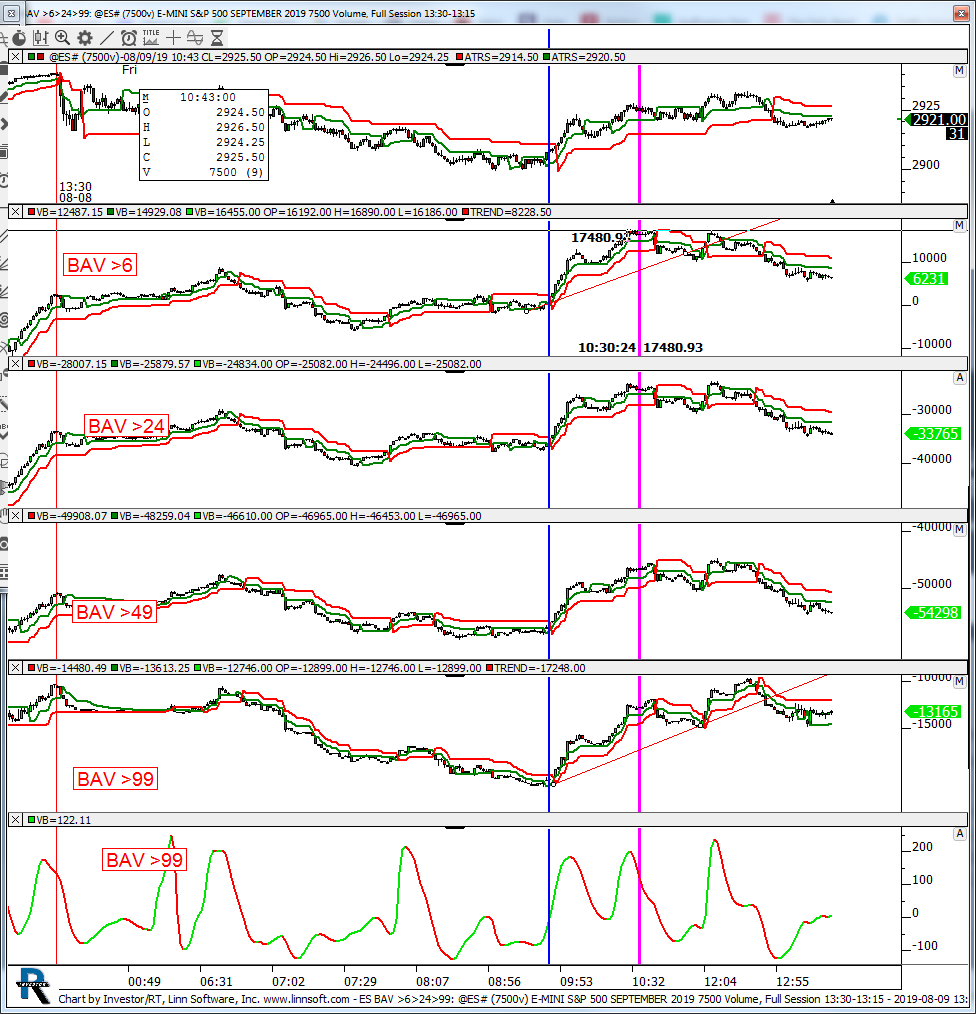
ES BAV 5244999 (@ES#) kencassorla [totalcount]
6 years 11 months ago
es subs. This chart was uploaded by Investor/RT 13.5.24 showing symbol: @ES#. |
View |
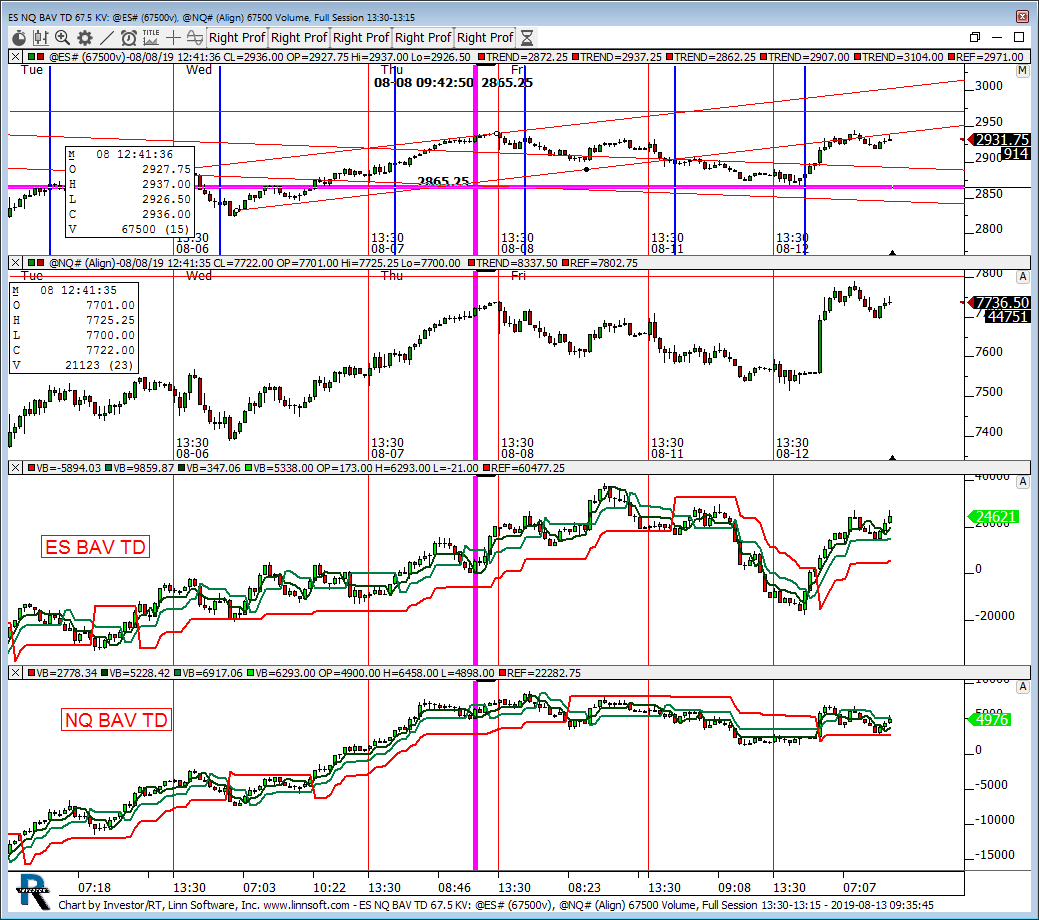 |
ES NQ BAV TD 675 KV (@ES#) kencassorla [totalcount]
6 years 11 months ago
ES NQ. This chart was uploaded by Investor/RT 13.5.24 showing symbol: @ES#. |
View |
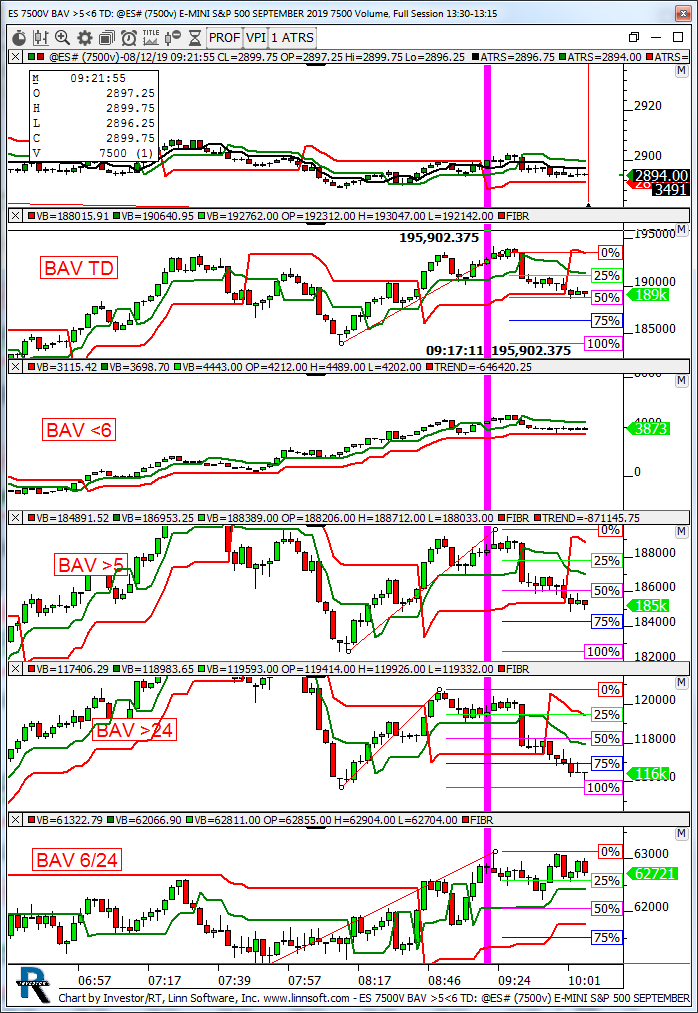 |
ES 7500V BAV 56 TD (@ES#) kencassorla [totalcount]
6 years 11 months ago
7500. This chart was uploaded by Investor/RT 13.5.24 showing symbol: @ES#. |
View |
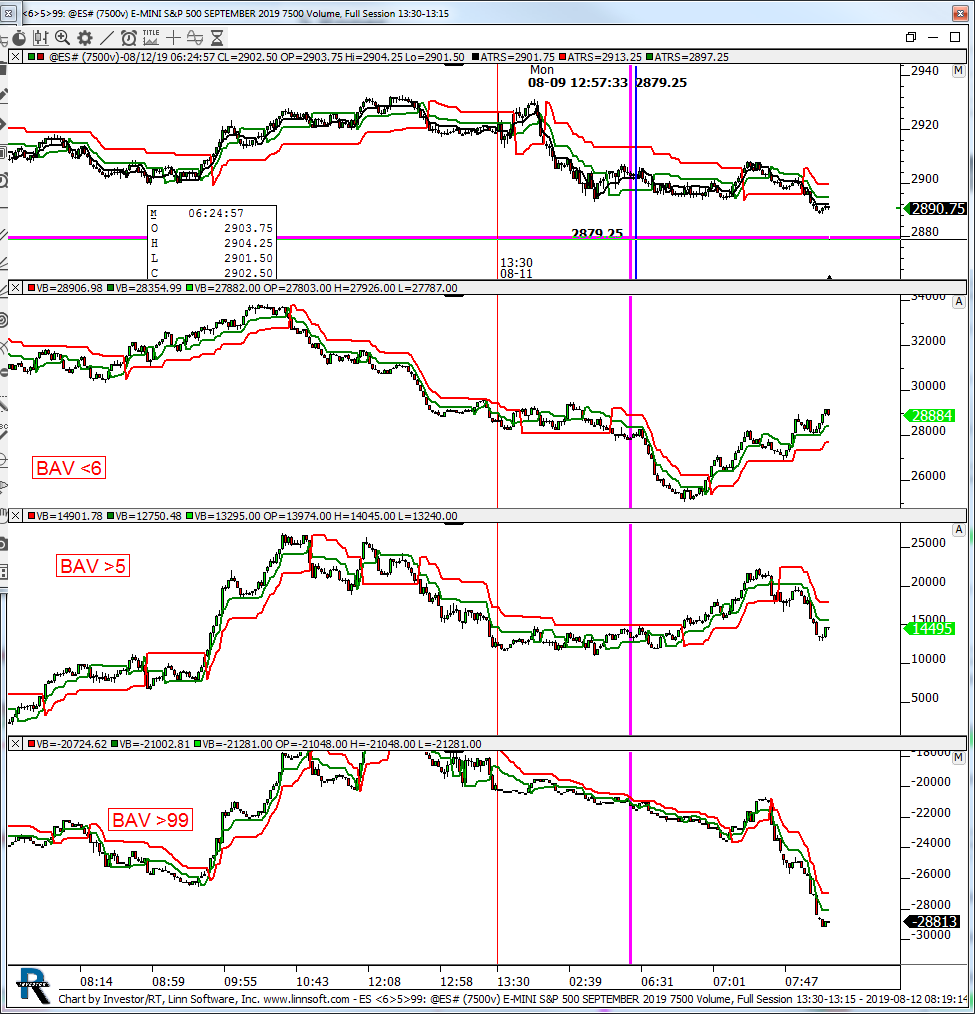 |
ES 6599 (@ES#) kencassorla [totalcount]
6 years 11 months ago
es subs. This chart was uploaded by Investor/RT 13.5.24 showing symbol: @ES#. |
View |
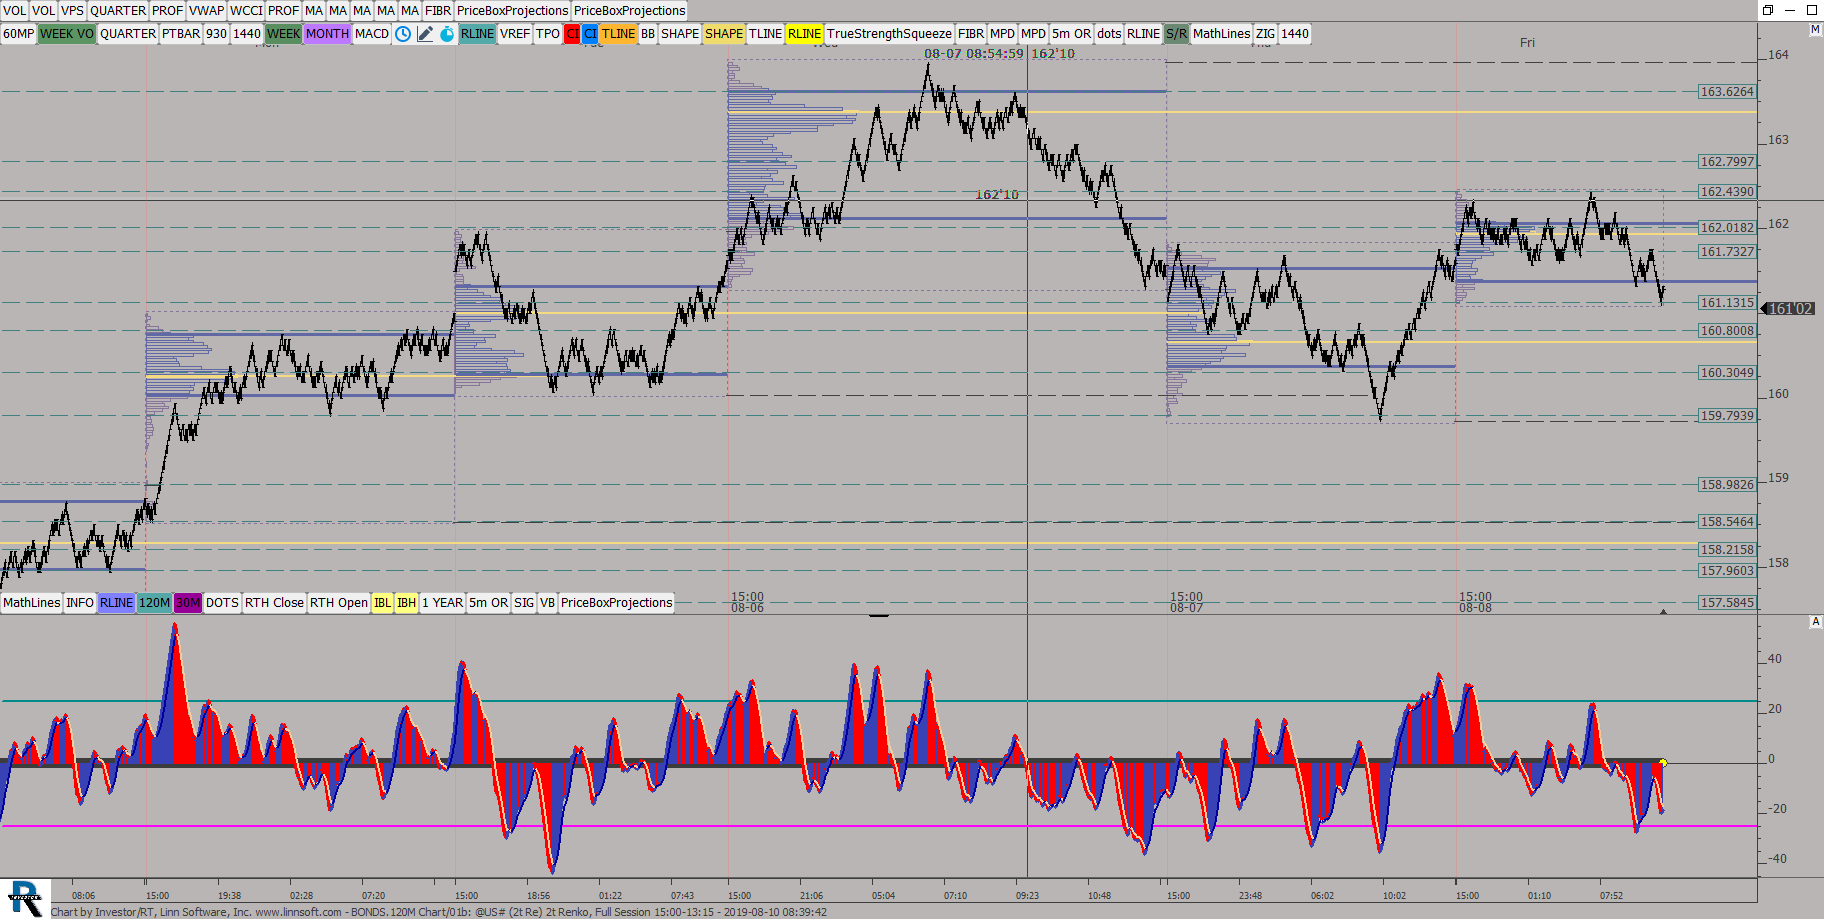 |
BONDS120M Chart 01b (@US#) ES42 [totalcount]
6 years 11 months ago
Daily MP with Entry Candles. This chart was uploaded by Investor/RT 13.5.24 showing symbol: @US#. |
View |
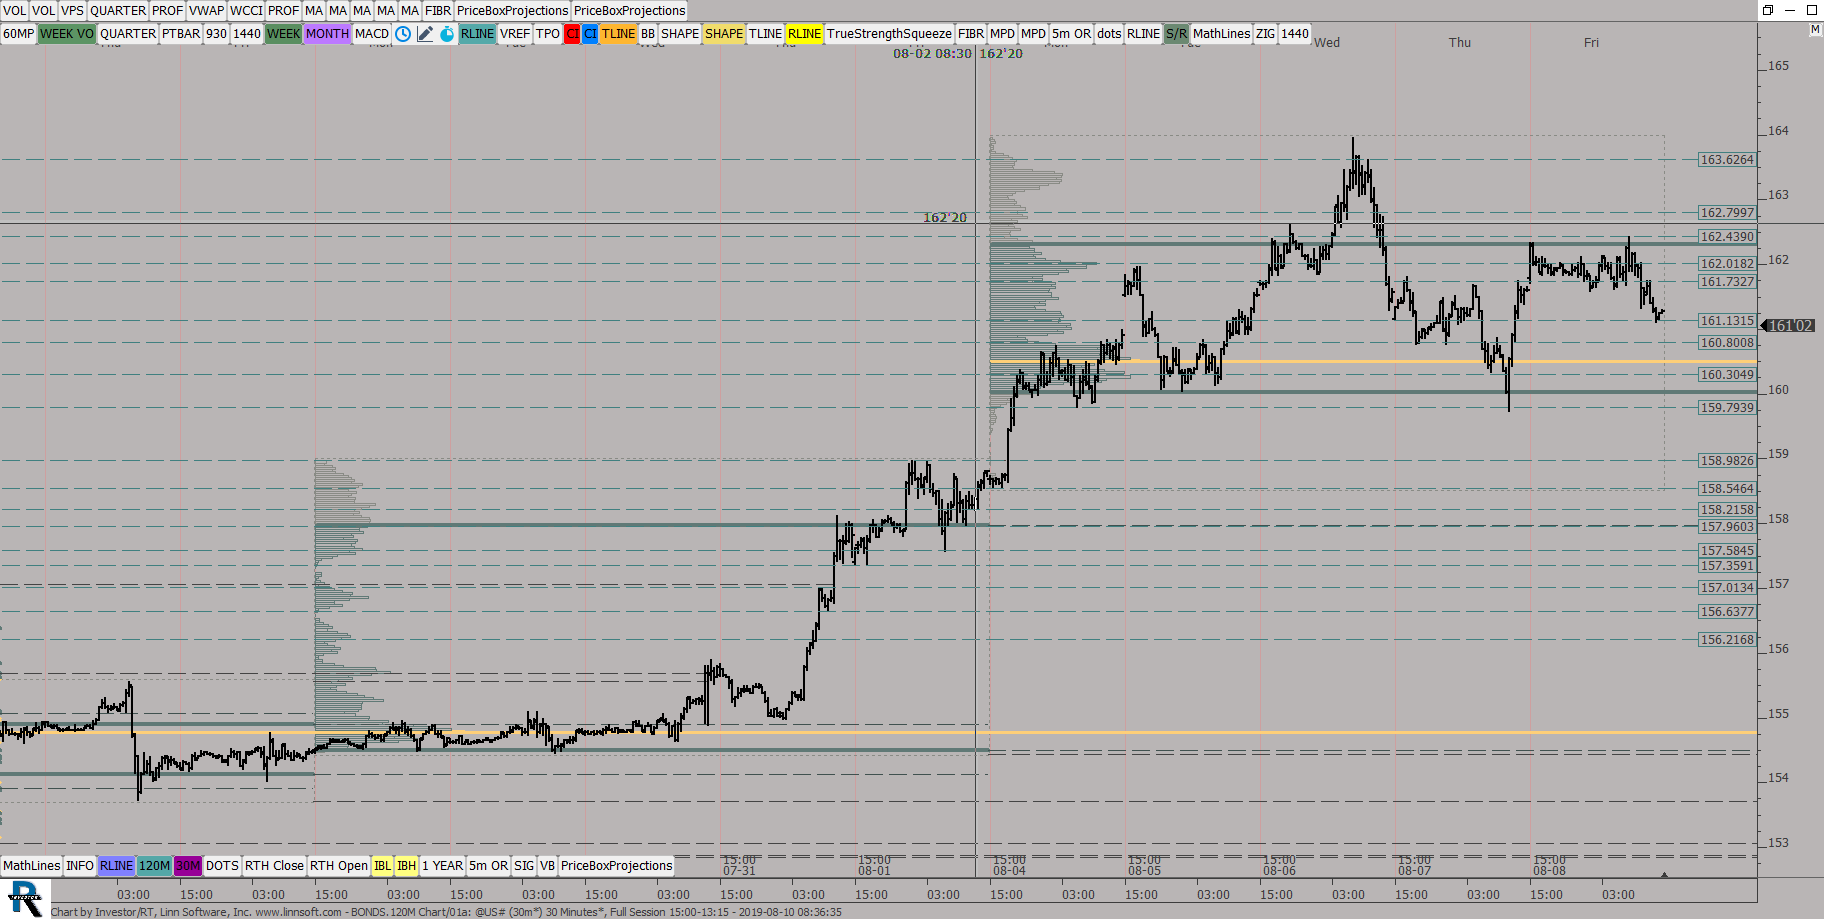 |
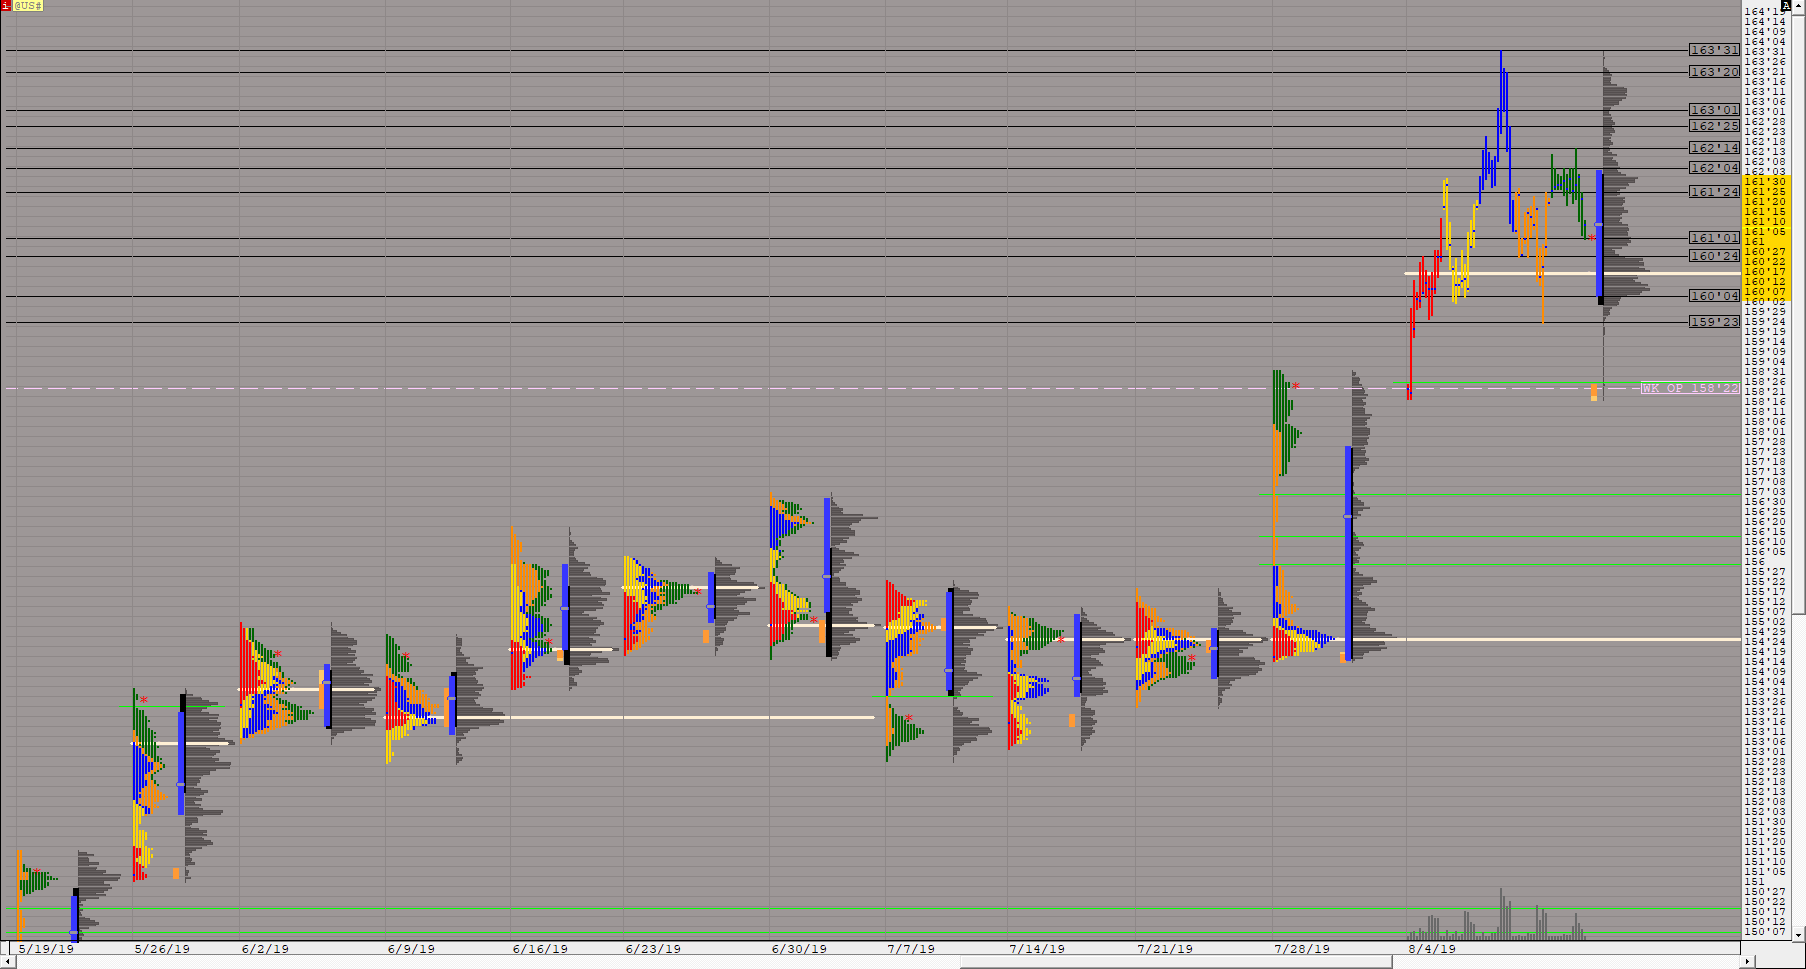
BONDS120M Chart 01a (@US#) ES42 [totalcount]
6 years 11 months ago
Weekly MP, 30 MIN candles. This chart was uploaded by Investor/RT 13.5.24 showing symbol: @US#. |
View |
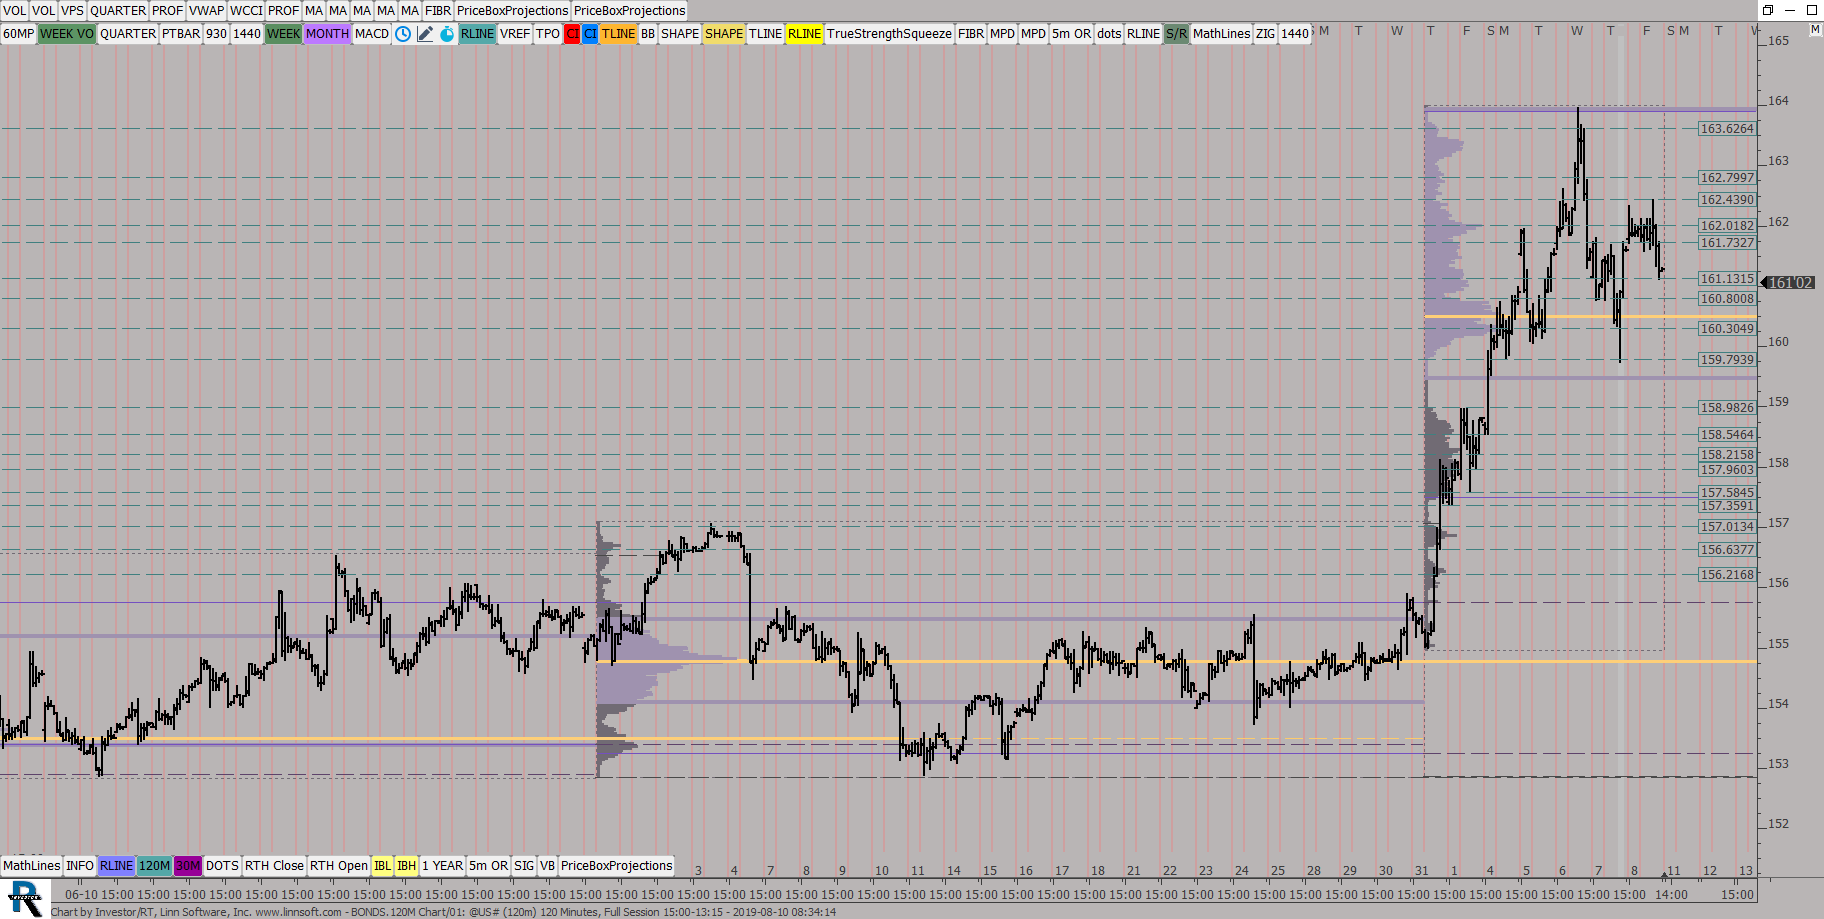 |
BONDS120M Chart (@US#) ES42 [totalcount]
6 years 11 months ago
Monthly MP, 120Min Candles. This chart was uploaded by Investor/RT 13.5.24 showing symbol: @US#. |
View |
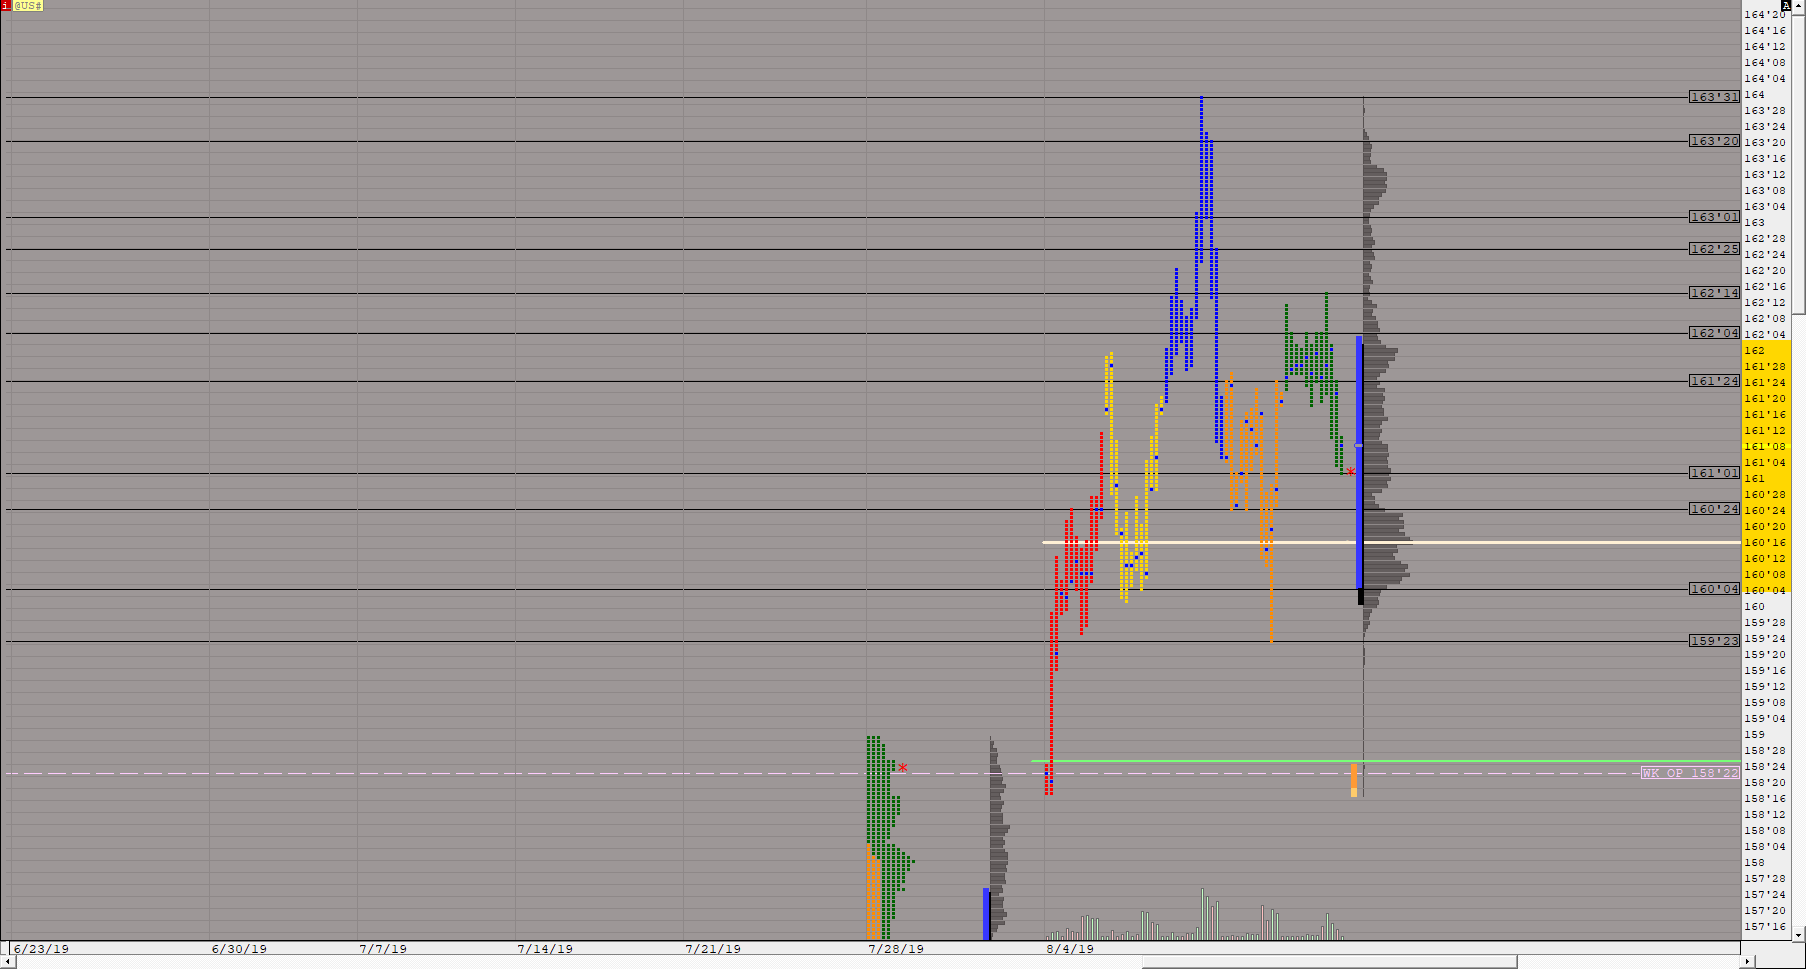 |
BONDSMPWEEKLY 01a (@US#) ES42 [totalcount]
6 years 11 months ago
WeeklyMP, 120 MIN Candles. This chart was uploaded by Investor/RT 13.5.24 showing symbol: @US#. |
View |
 |
BONDSMPWEEKLY (@US#) ES42 [totalcount]
6 years 11 months ago
WeeklyMP, 120 MIN Candles. This chart was uploaded by Investor/RT 13.5.24 showing symbol: @US#. |
View |
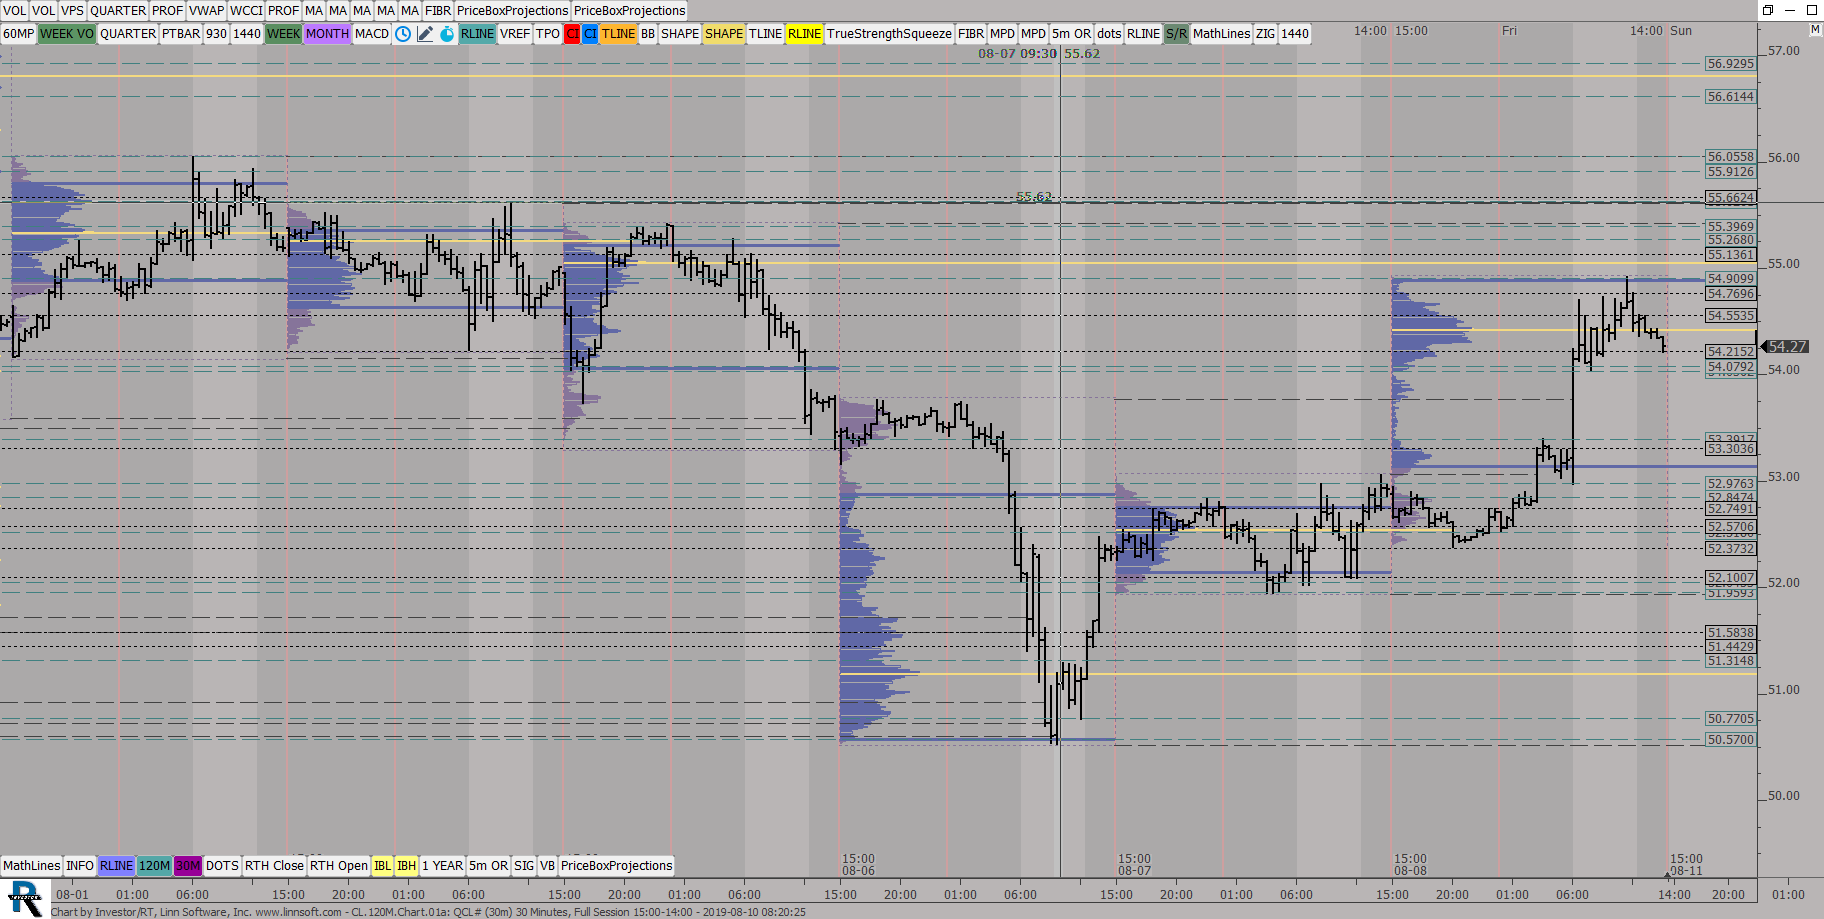 |
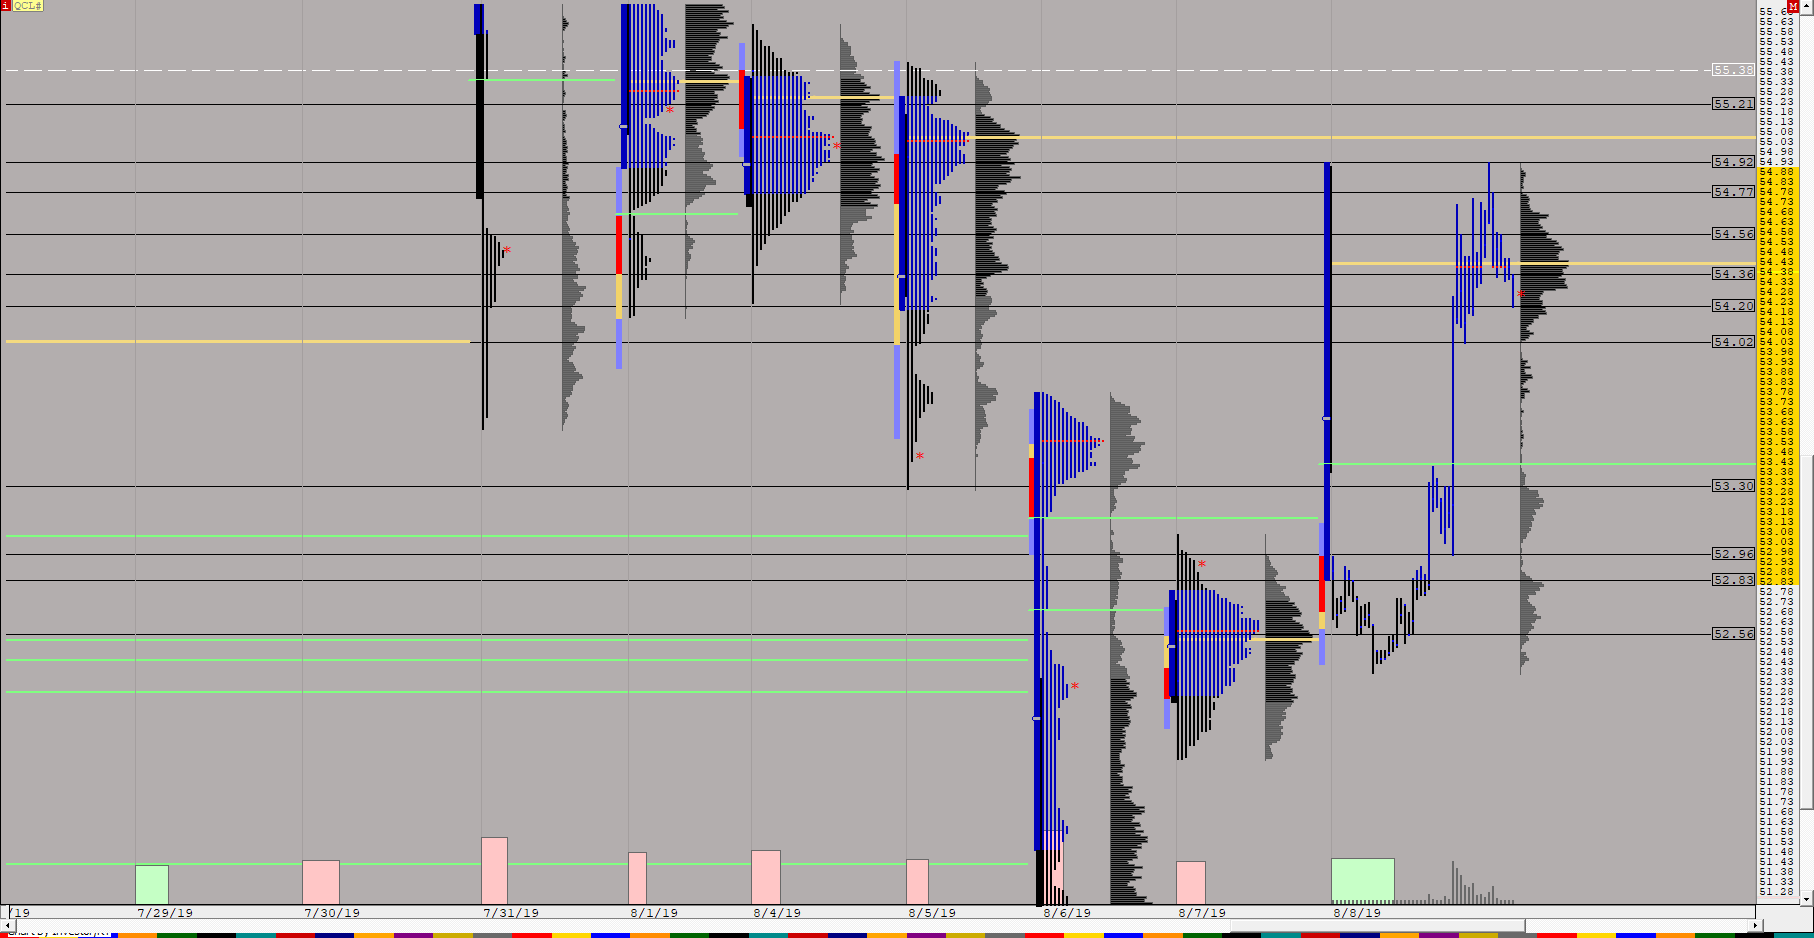
CL120MChart01a (QCL#) ES42 [totalcount]
6 years 11 months ago
Daily MP with 30 min Candles. This chart was uploaded by Investor/RT 13.5.24 showing symbol: QCL#. |
View |
 |
S R Daily TPOCL02a (QCL#) ES42 [totalcount]
6 years 11 months ago
This chart was uploaded by Investor/RT 13.5.24 showing symbol: QCL#. |
View |
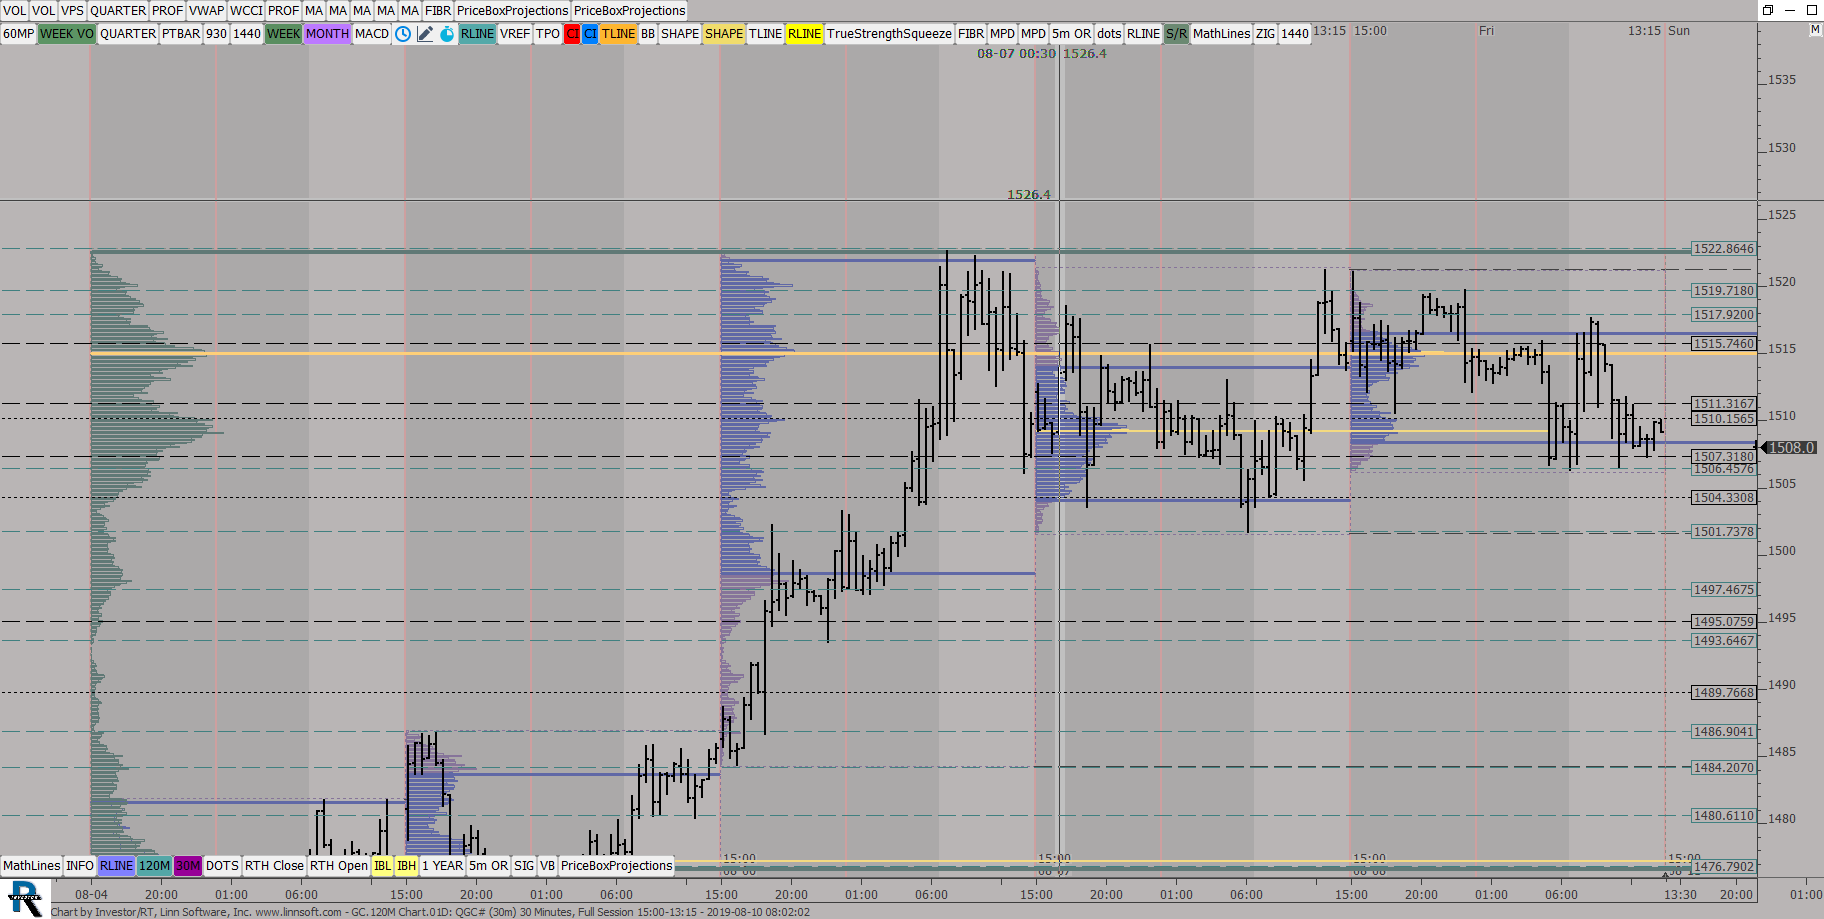 |
GC120M Chart01D (QGC#) ES42 [totalcount]
6 years 11 months ago
Daily Candles, 30 Min Candles. This chart was uploaded by Investor/RT 13.5.24 showing symbol: QGC#. |
View |
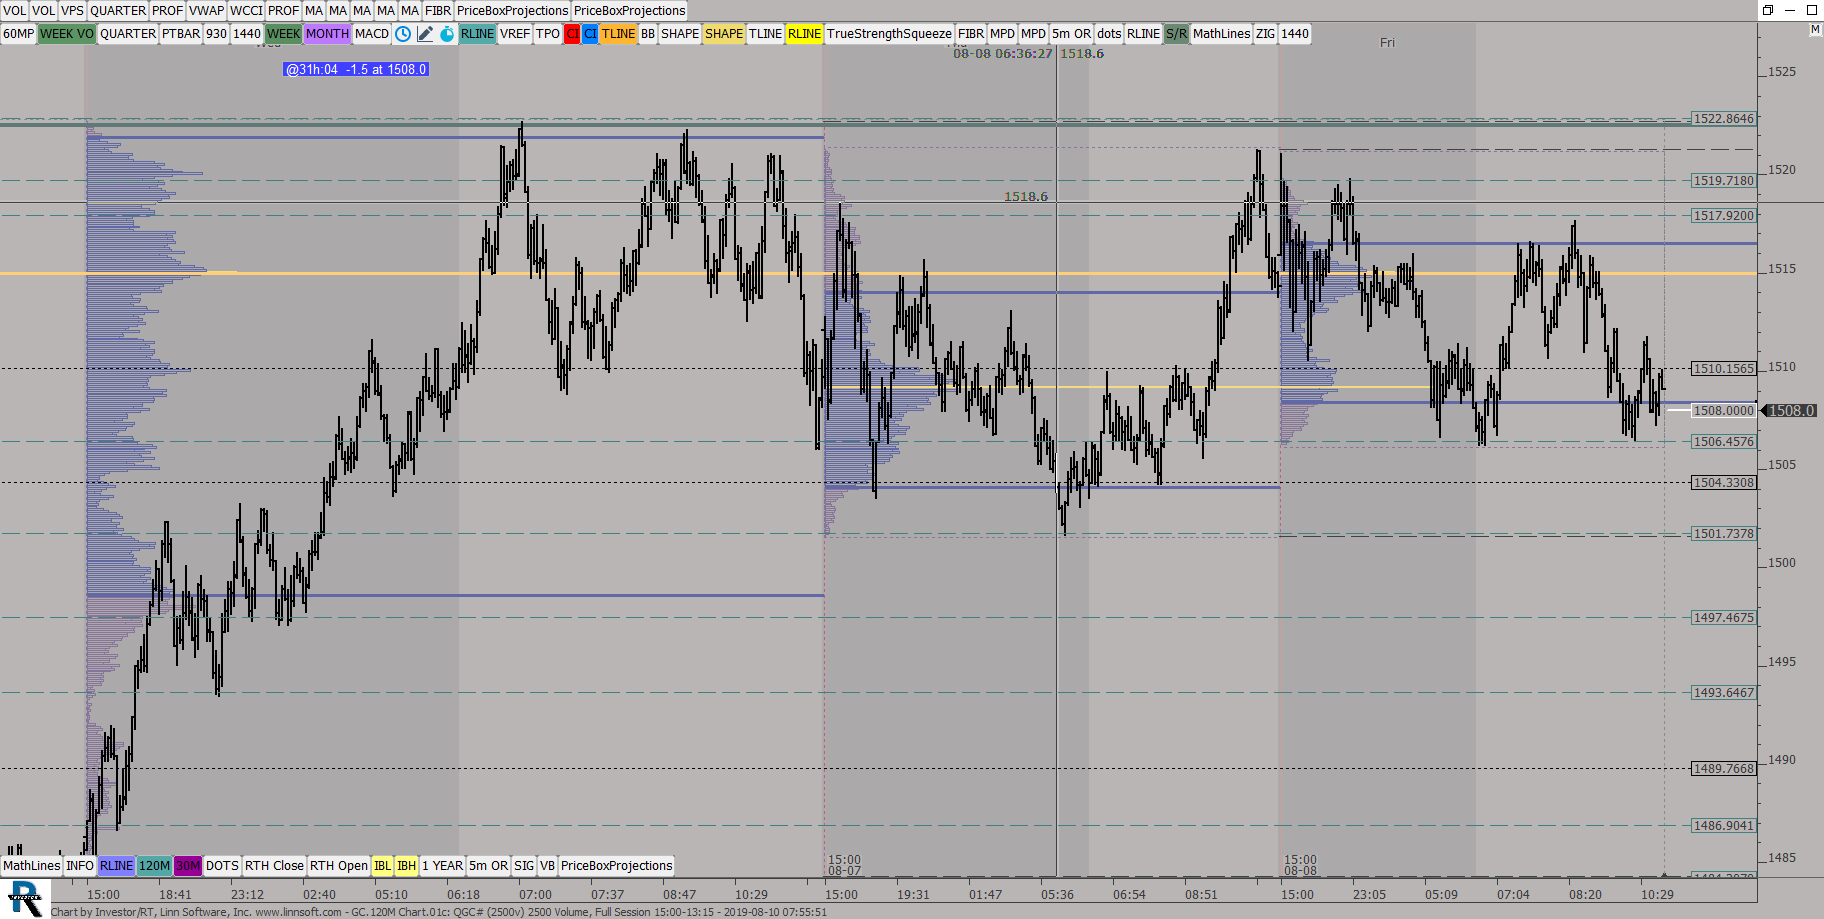 |
GC120M Chart01c (QGC#) ES42 [totalcount]
6 years 11 months ago
Weekly MP and 30 min Candles. This chart was uploaded by Investor/RT 13.5.24 showing symbol: QGC#. |
View |
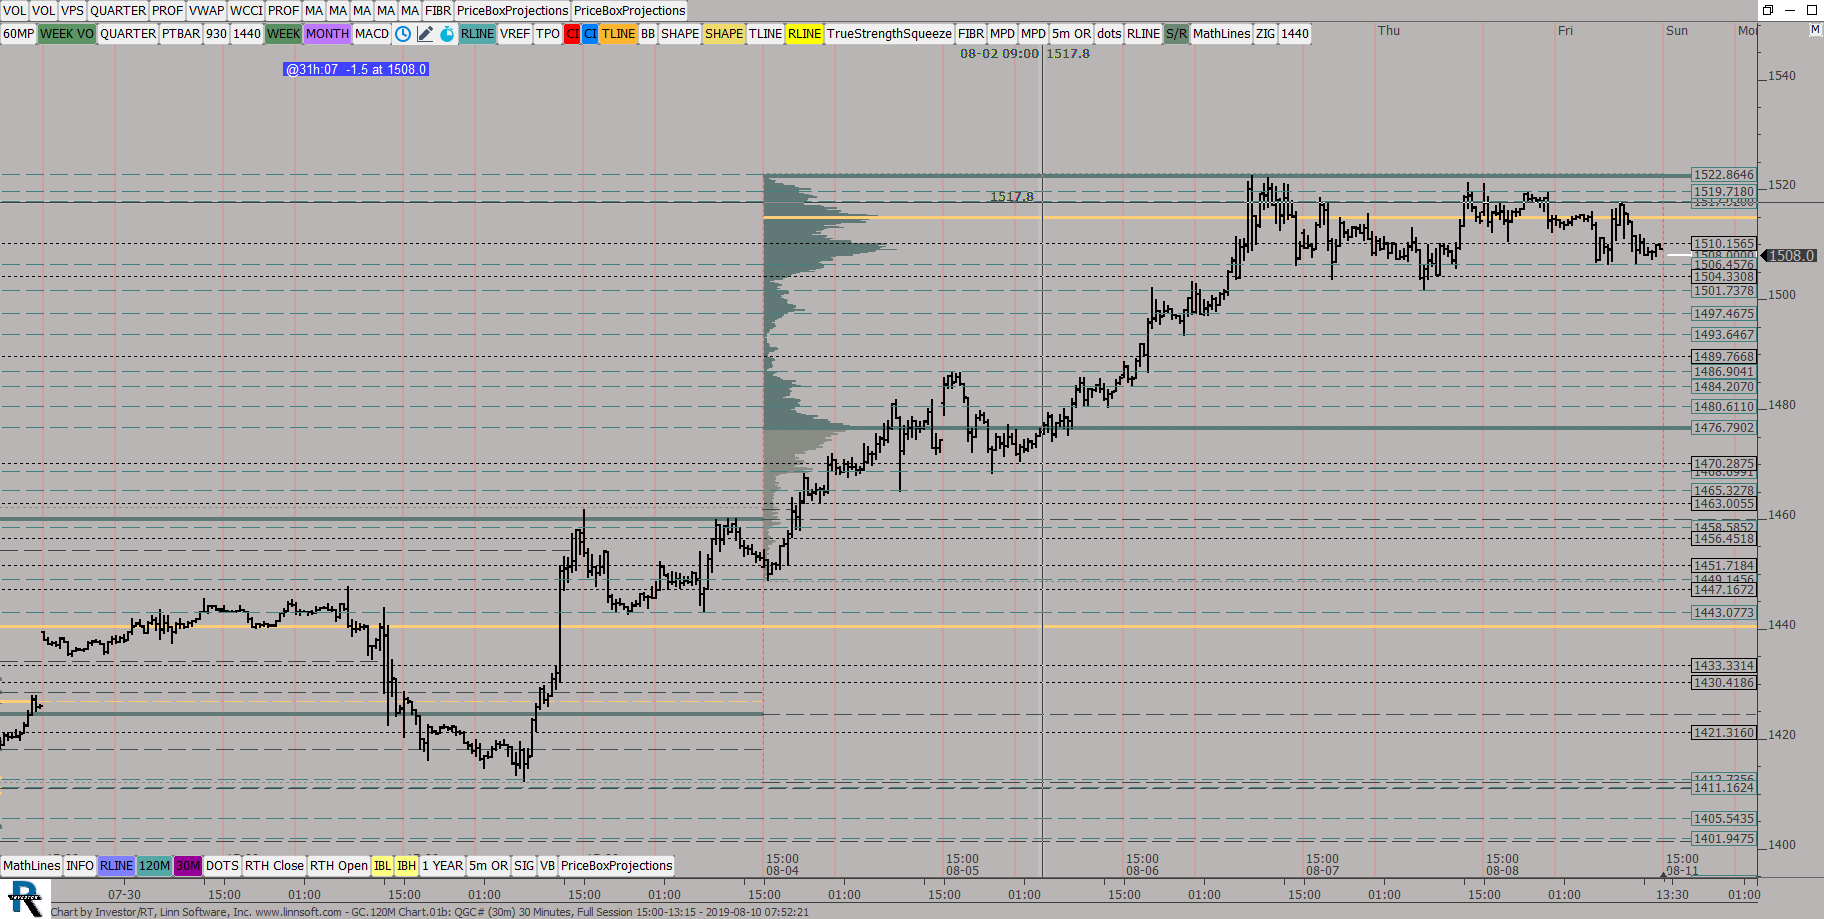 |
GC120M Chart01b (QGC#) ES42 [totalcount]
6 years 11 months ago
Weekly MP and 30 min Candles. This chart was uploaded by Investor/RT 13.5.24 showing symbol: QGC#. |
View |
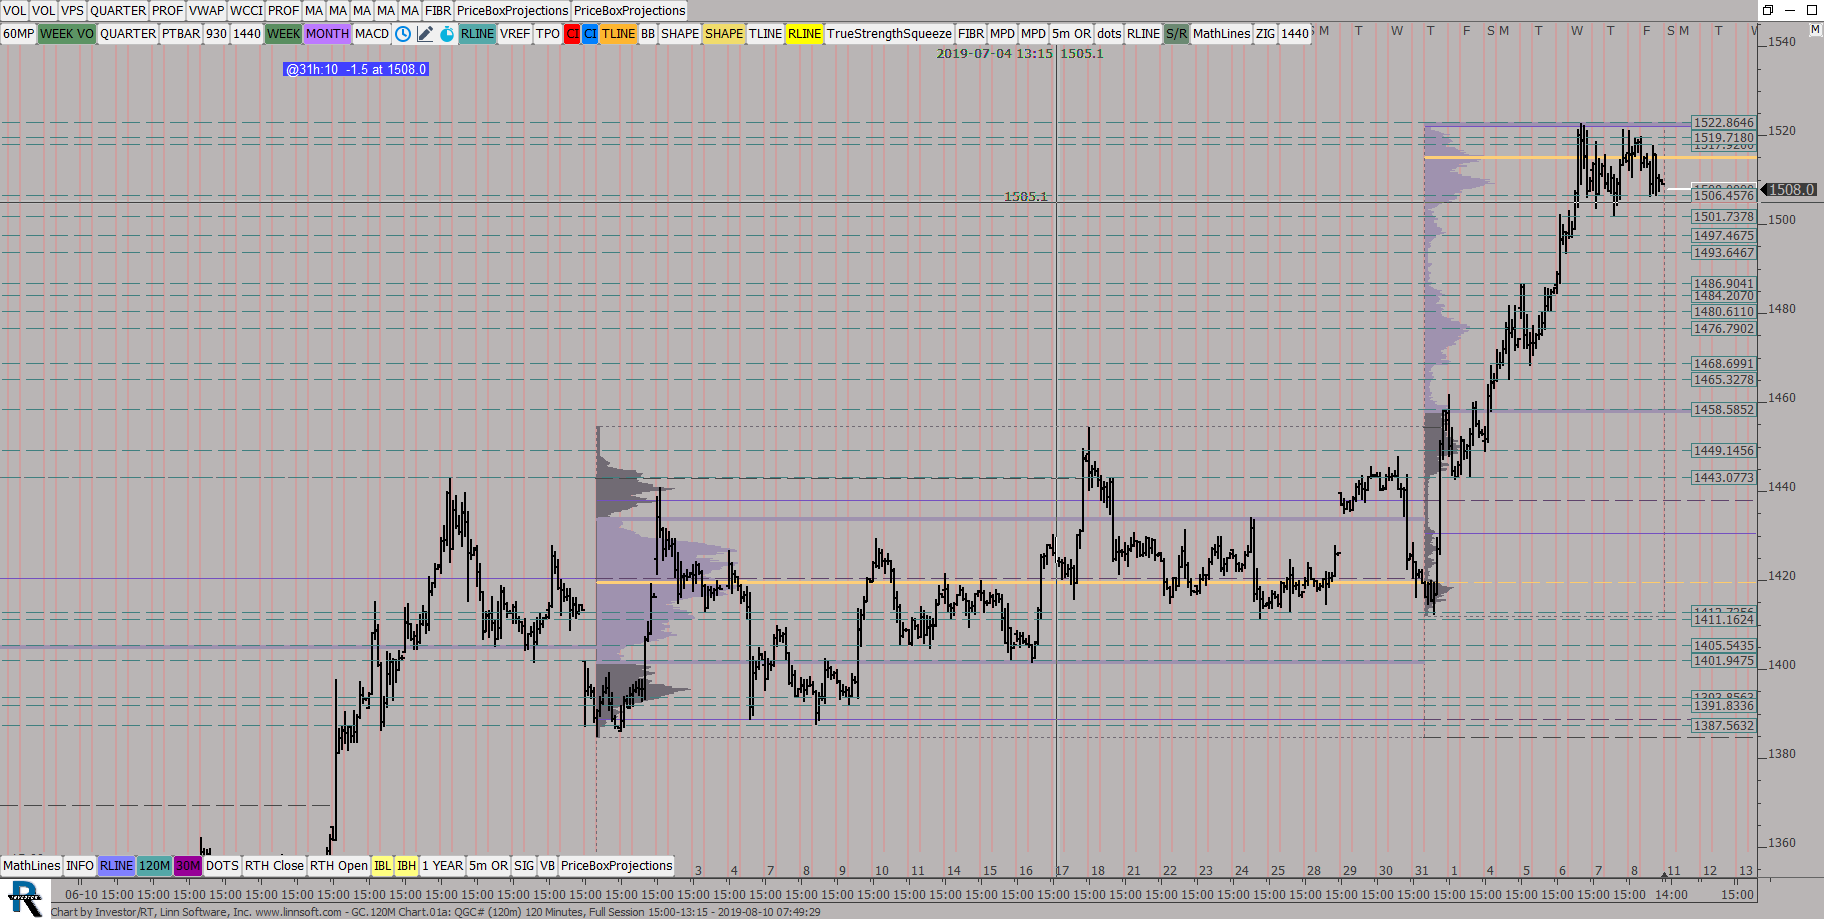 |
GC120M Chart01a (QGC#) ES42 [totalcount]
6 years 11 months ago
MonthlyMP and 120 min candles. This chart was uploaded by Investor/RT 13.5.24 showing symbol: QGC#. |
View |
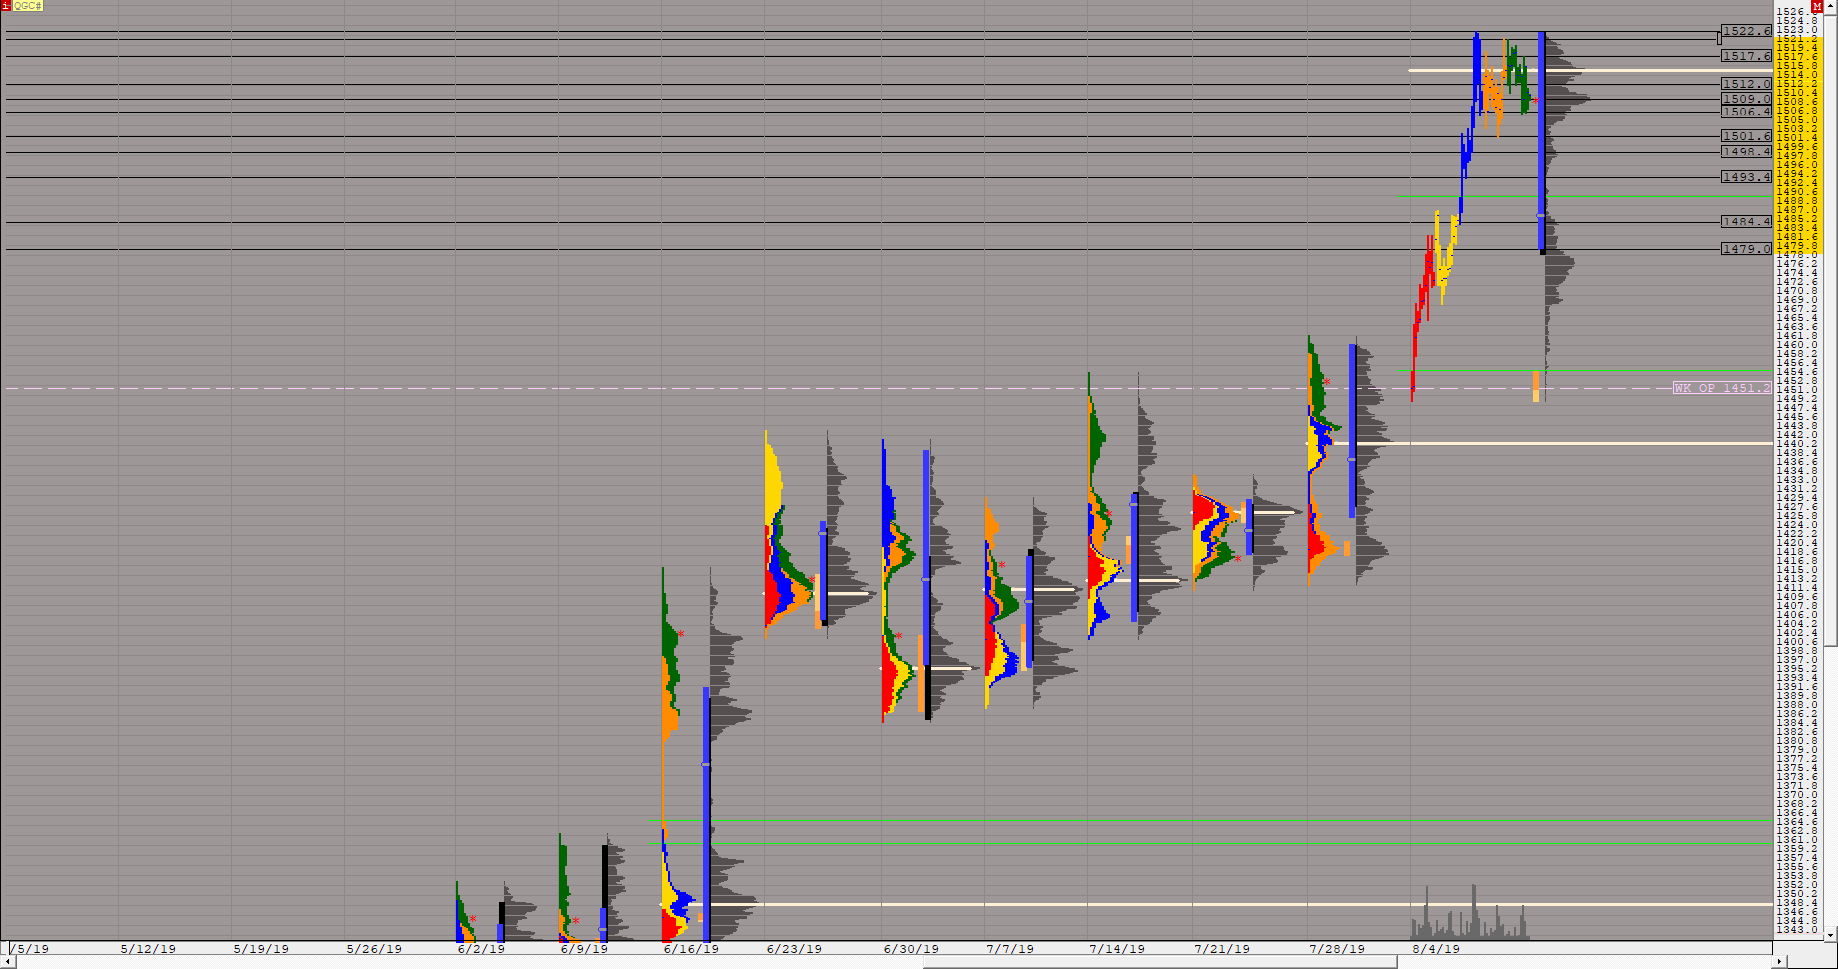 |
GCMPWEEKLY (QGC#) ES42 [totalcount]
6 years 11 months ago
Weekly MP , and 120 min candles. This chart was uploaded by Investor/RT 13.5.24 showing symbol: QGC#. |
View |
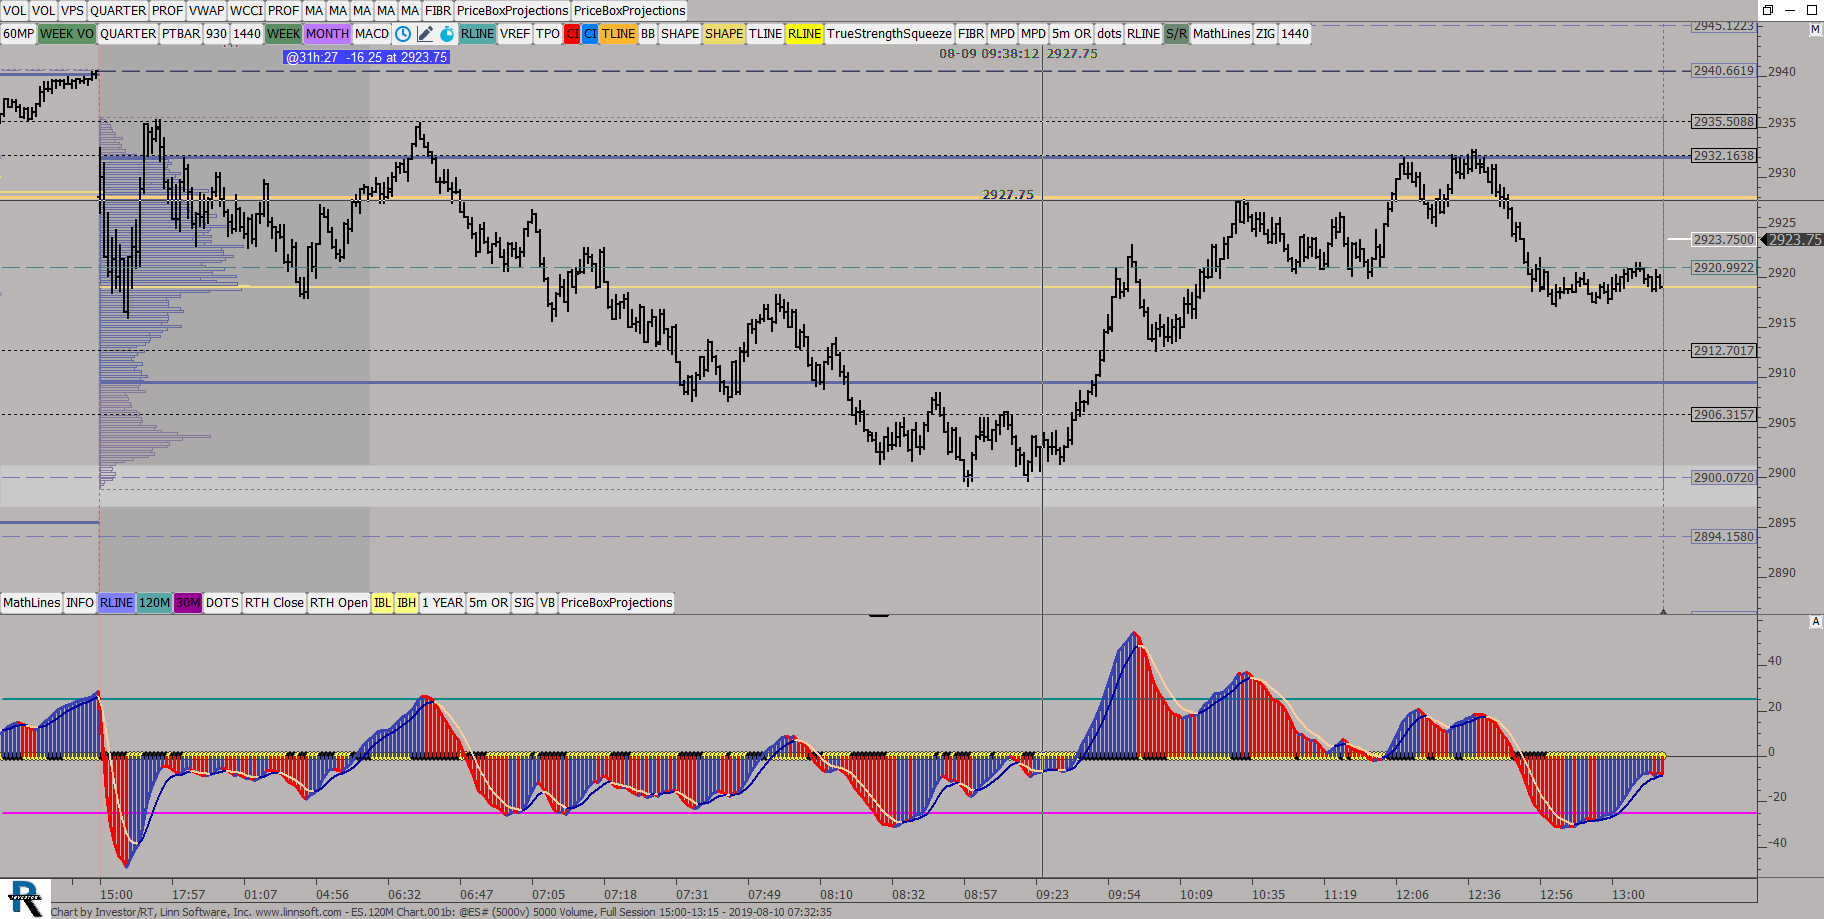 |
ES120M Chart001b (@ES#) ES42 [totalcount]
6 years 11 months ago
Monthly, and 120 min candles. This chart was uploaded by Investor/RT 13.5.24 showing symbol: @ES#. |
View |
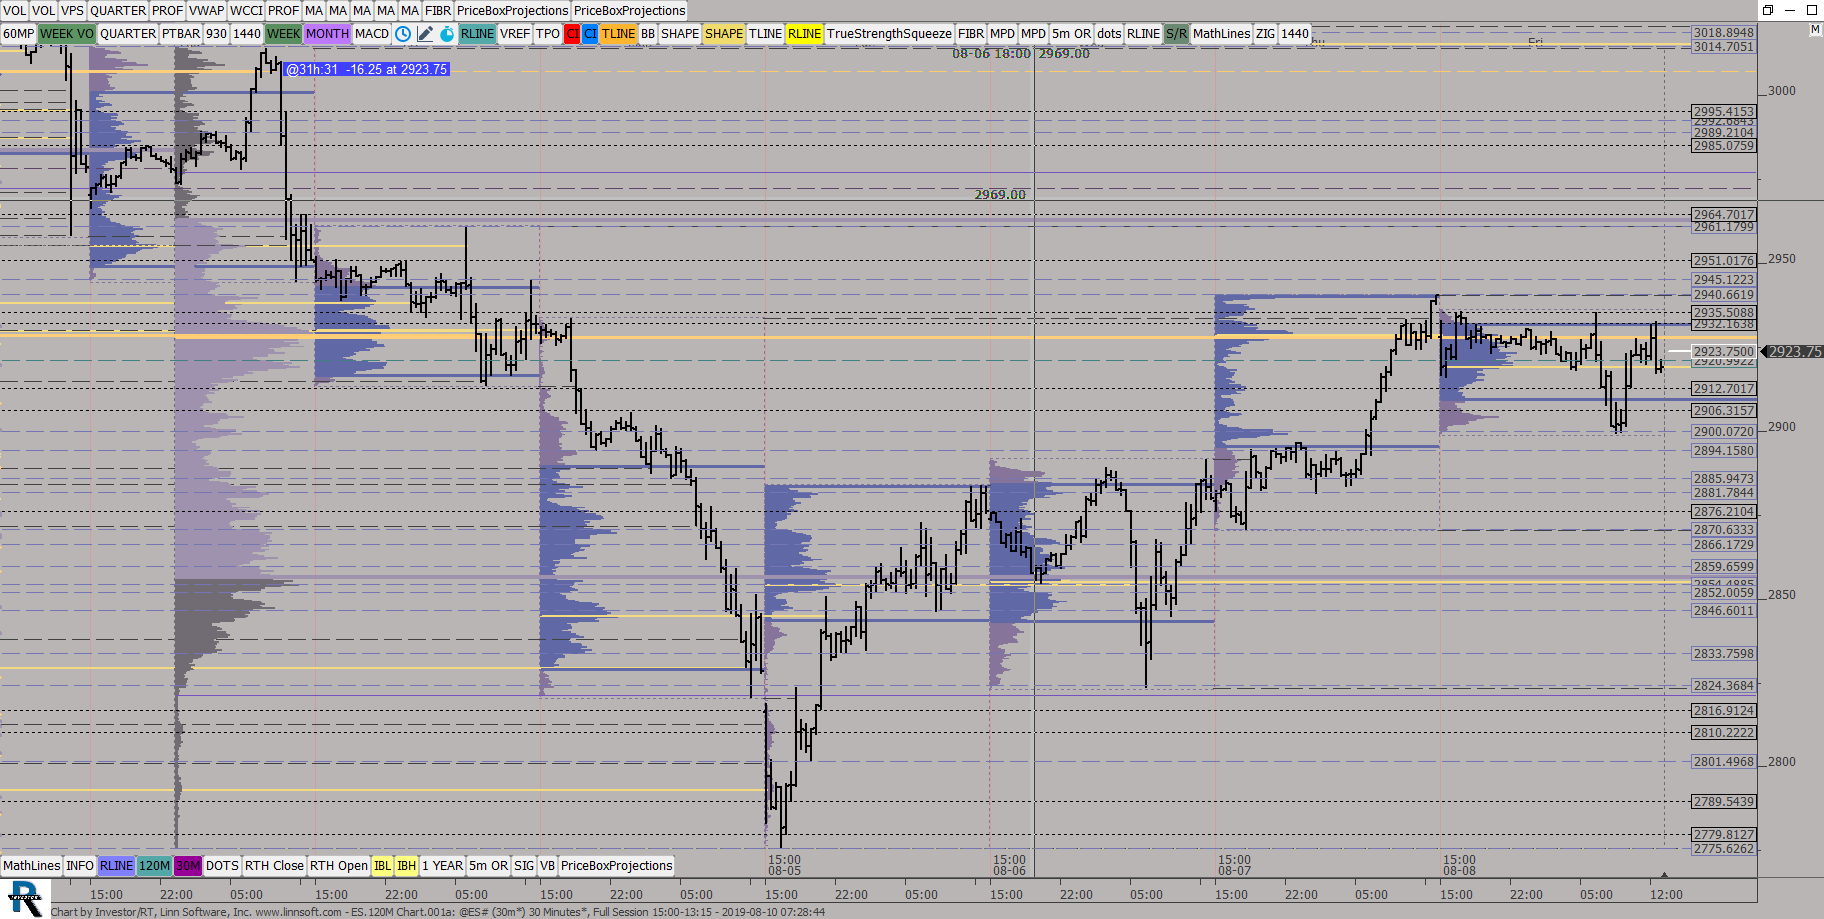 |
ES120M Chart001a (@ES#) ES42 [totalcount]
6 years 11 months ago
Monthly, and 120 min candles. This chart was uploaded by Investor/RT 13.5.24 showing symbol: @ES#. |
View |
 |
ES120M Chart (@ES#) ES42 [totalcount]
6 years 11 months ago
Monthly, and 120 min candles. This chart was uploaded by Investor/RT 13.5.24 showing symbol: @ES#. |
View |
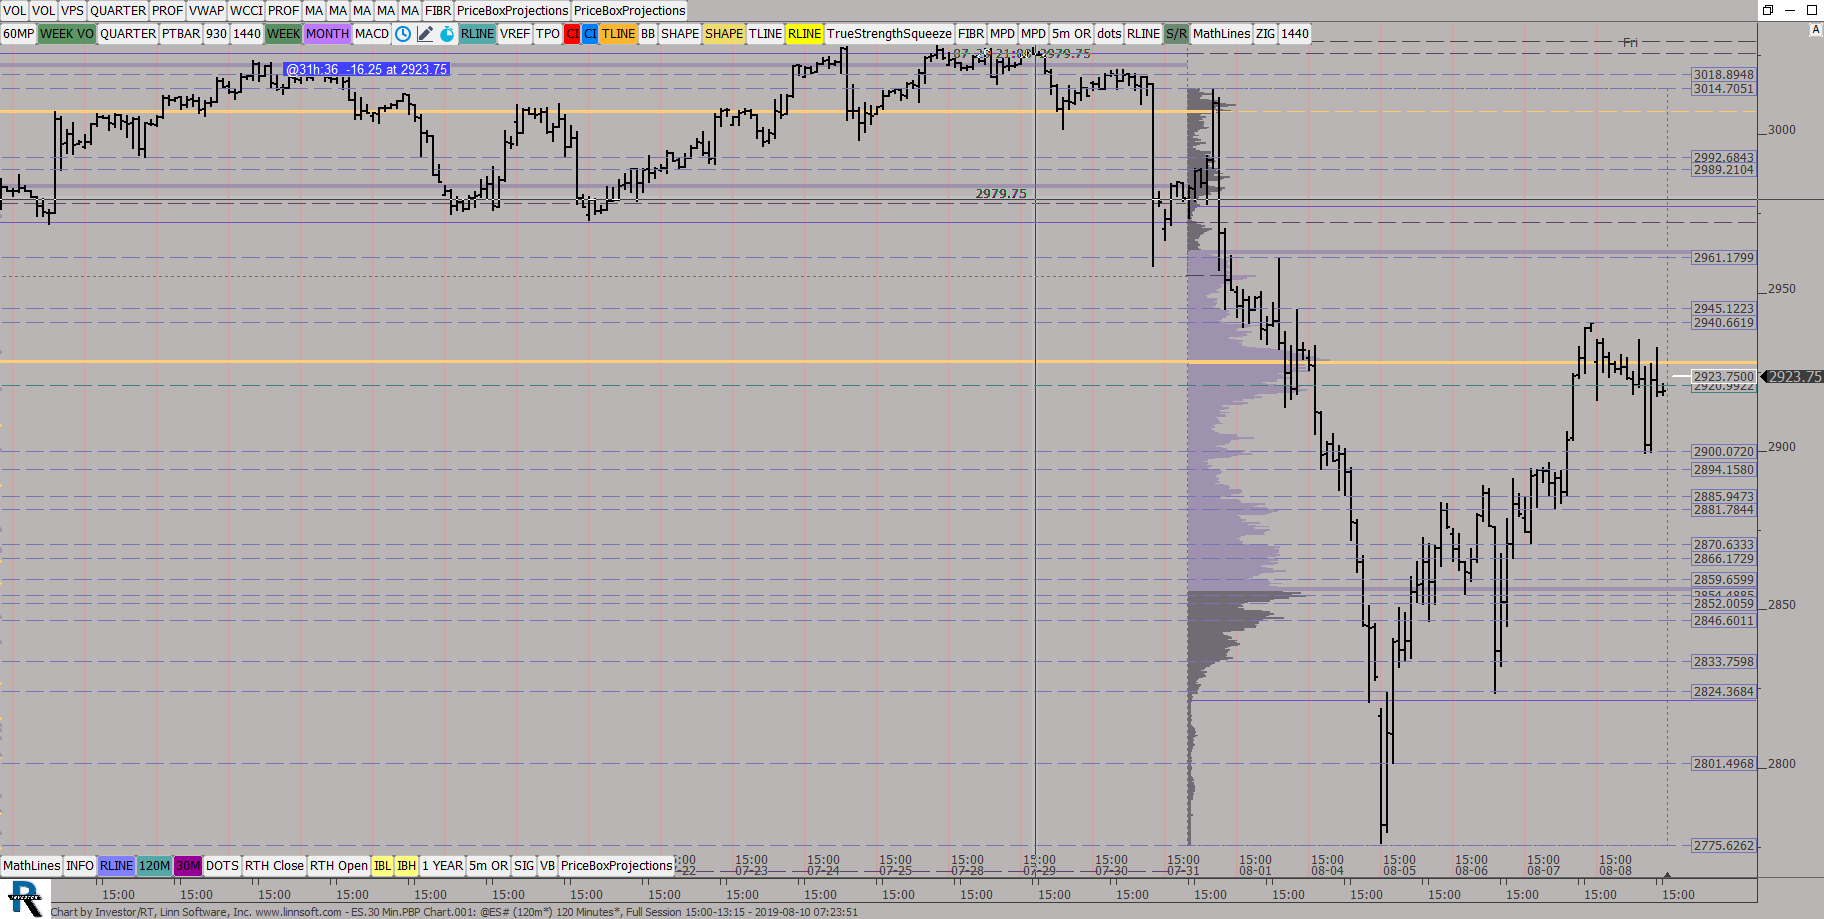 |
ES30 MinPBP Chart (@ES#) ES42 [totalcount]
6 years 11 months ago
Weekly, and 120 min candles. This chart was uploaded by Investor/RT 13.5.24 showing symbol: @ES#. |
View |
 |
ES BAV 62499 (@ES#) kencassorla [totalcount]
6 years 11 months ago
es subs. This chart was uploaded by Investor/RT 13.5.24 showing symbol: @ES#. |
View |
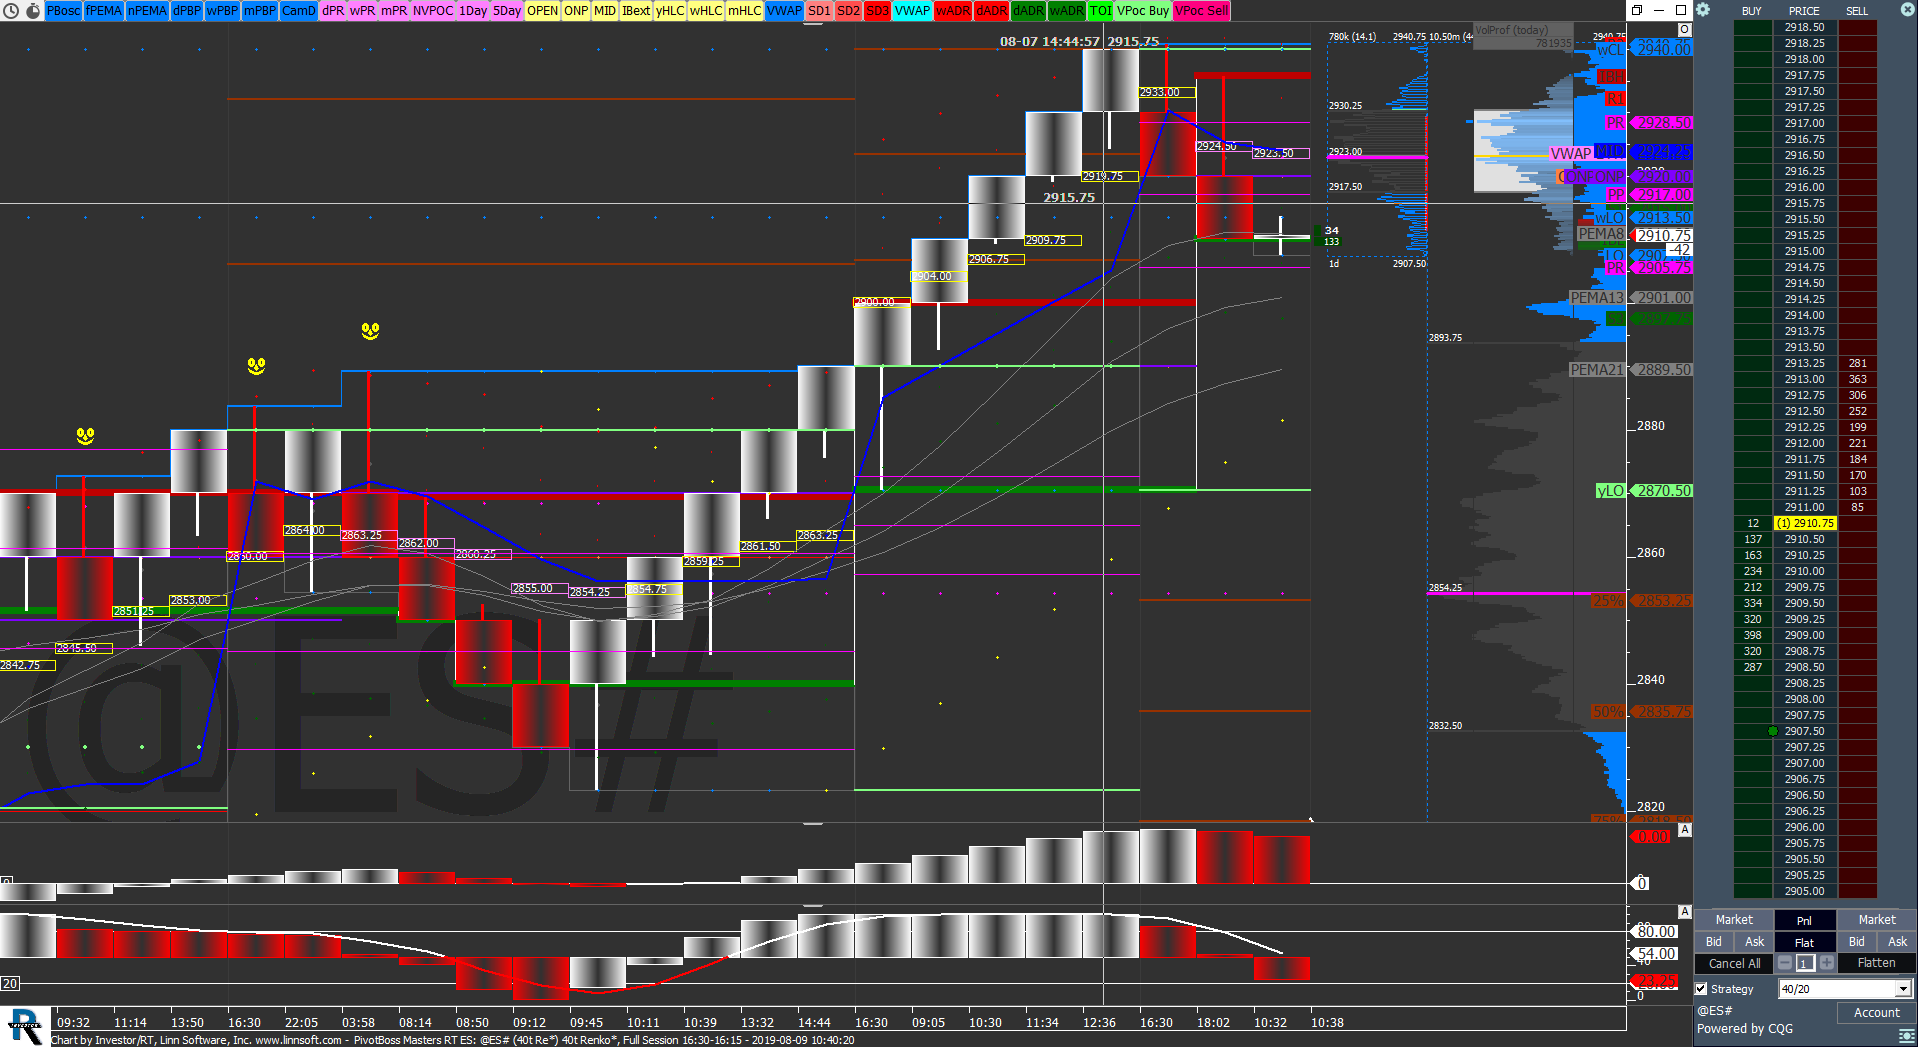 |
PivotBoss Masters RT ES (@ES#) Geoff Lawrence [totalcount]
6 years 11 months ago
Why is this happening. This chart was uploaded by Investor/RT 13.5.24 showing symbol: @ES#. |
View |
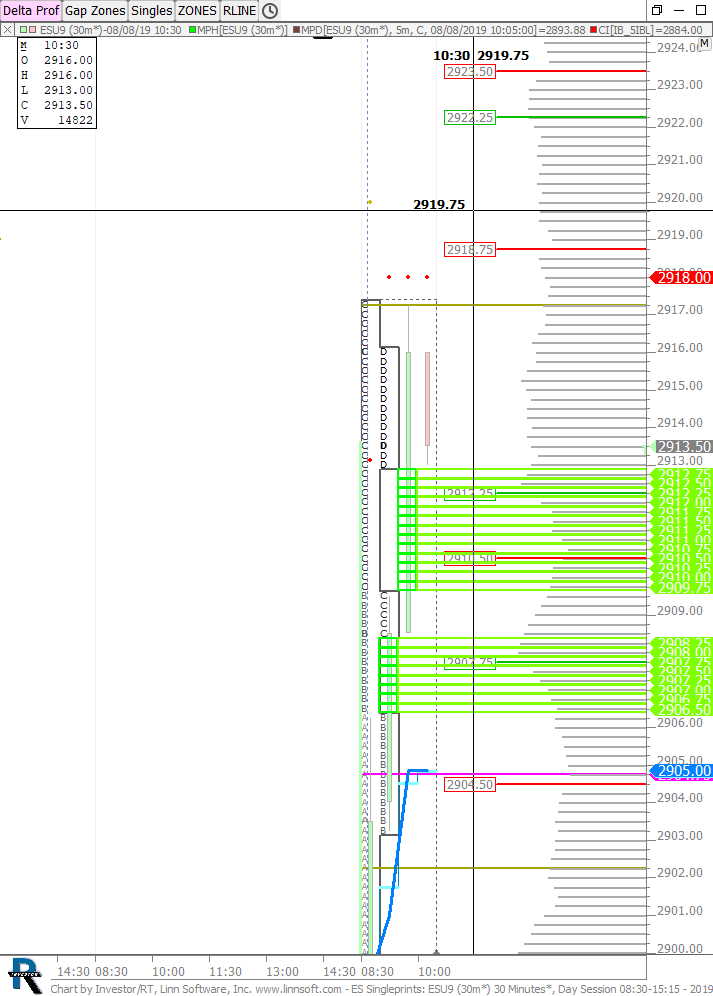 |
ES Singleprints (ESU9) scottz46 [totalcount]
6 years 11 months ago
This chart was uploaded by Investor/RT 13.5.24 showing symbol: ESU9. |
View |
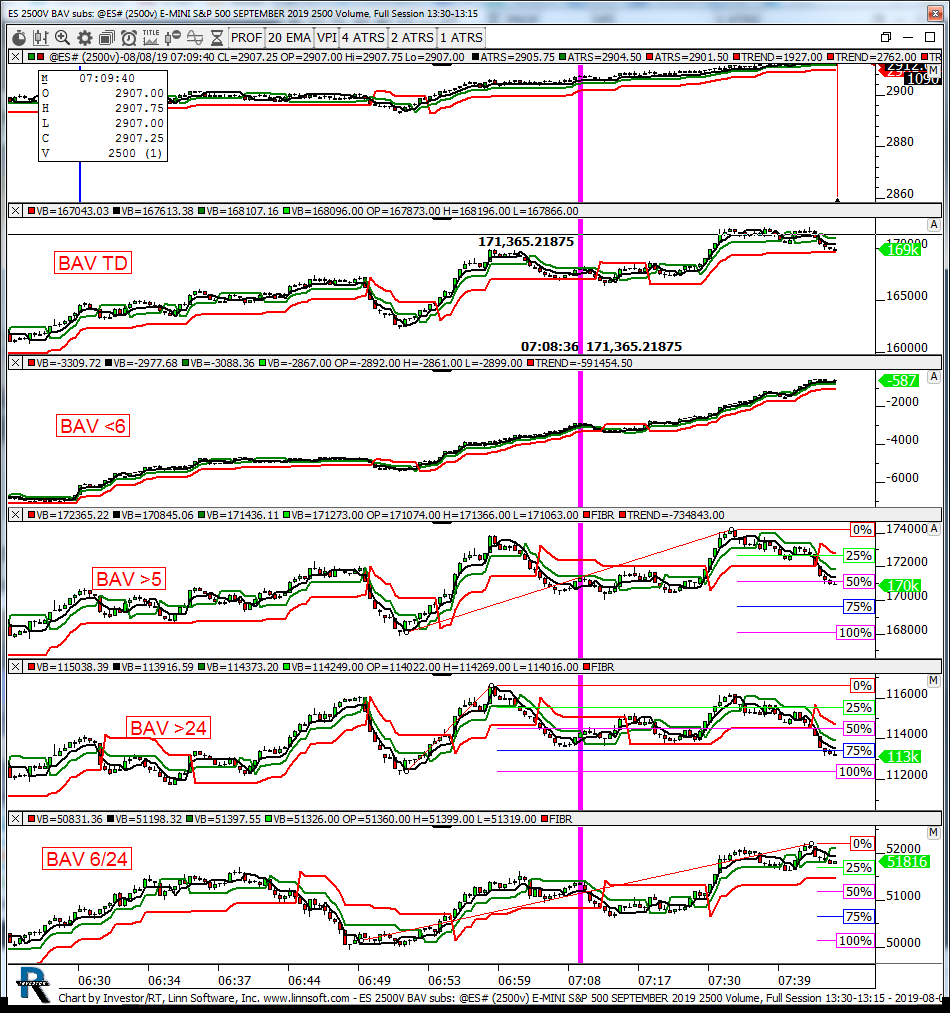 |
ES 2500V BAV subs (@ES#) kencassorla [totalcount]
6 years 11 months ago
es subs. This chart was uploaded by Investor/RT 13.5.24 showing symbol: @ES#. |
View |
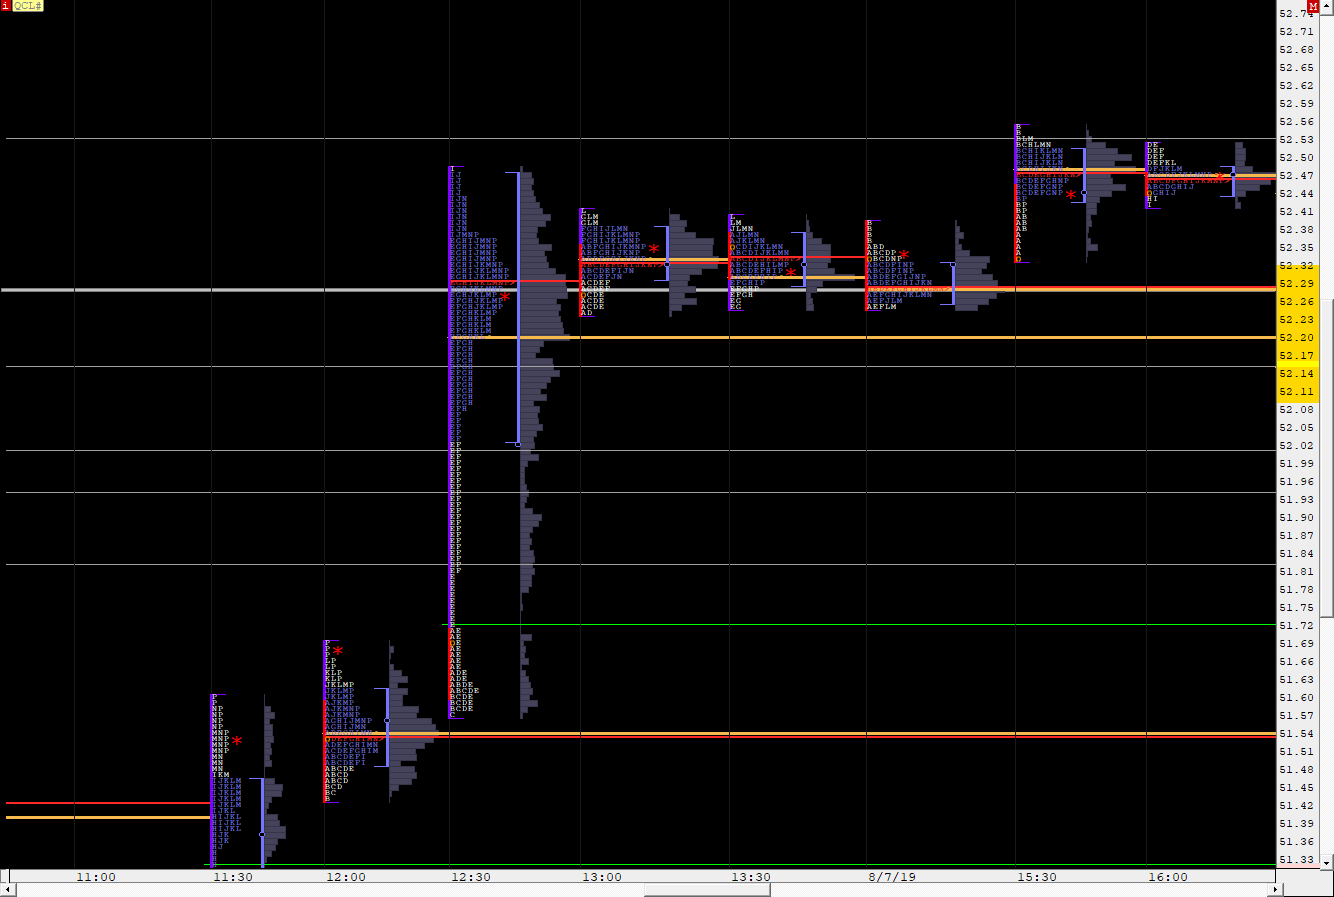 |
OrderflowCL (QCL#) ES42 [totalcount]
6 years 11 months ago
This chart was uploaded by Investor/RT 13.5.24 showing symbol: QCL#. |
View |