 |
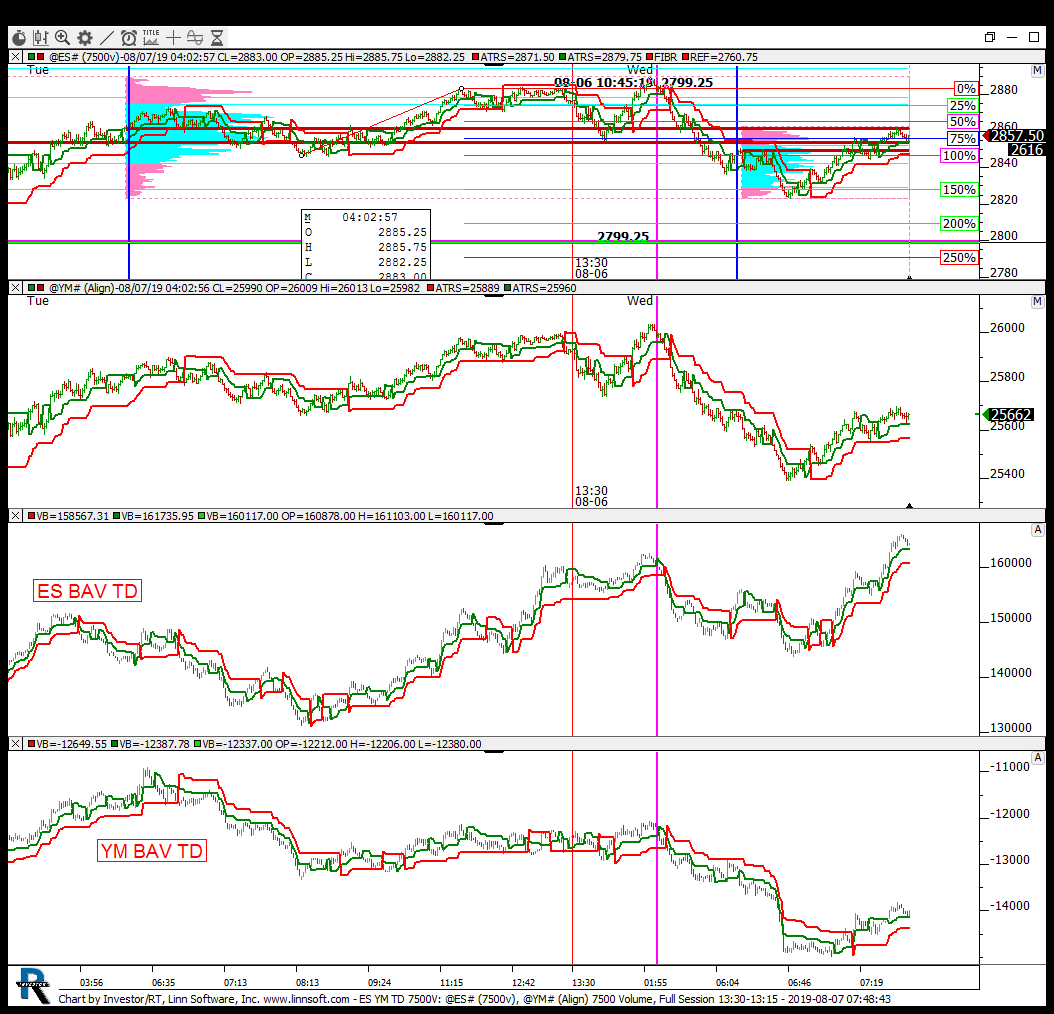
ES YM TD 7500V (@ES#) kencassorla [totalcount]
6 years 11 months ago
es ym. This chart was uploaded by Investor/RT 13.5.24 showing symbol: @ES#. |
View |
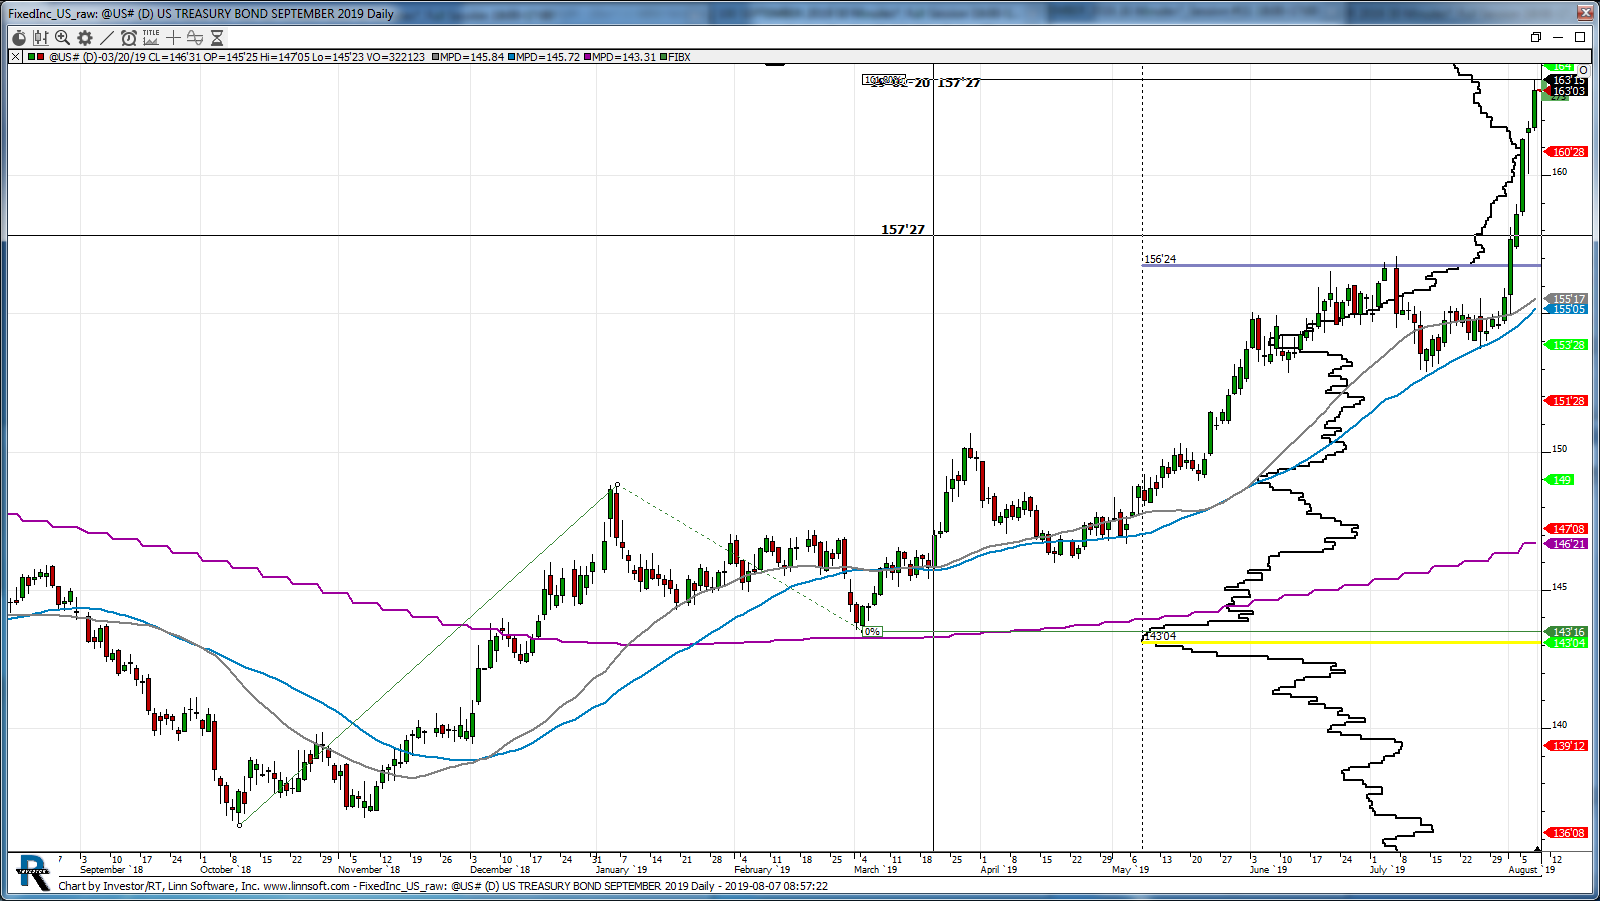 |
FixedInc US raw (@US#) npettinato [totalcount]
6 years 11 months ago
This chart was uploaded by Investor/RT 13.5.24 showing symbol: @US#. |
View |
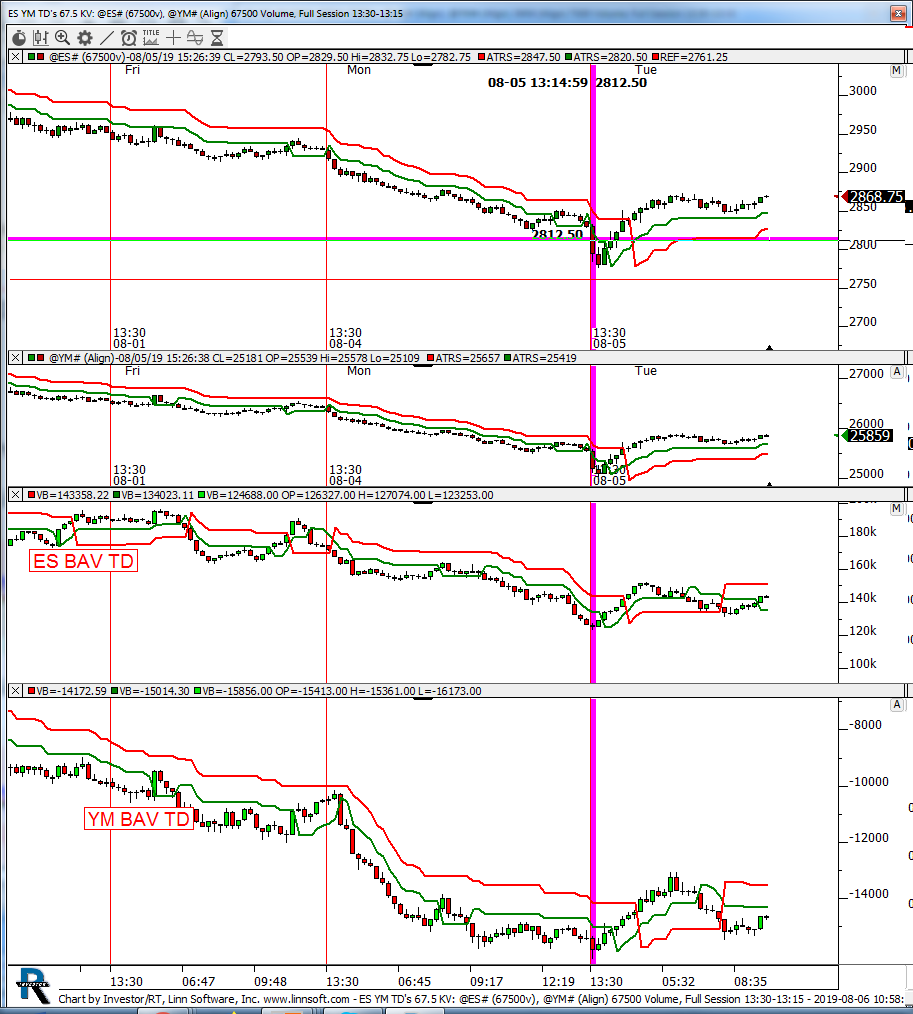 |
ES YM TDs 675 KV (@ES#) kencassorla [totalcount]
6 years 11 months ago
es ym. This chart was uploaded by Investor/RT 13.5.24 showing symbol: @ES#. |
View |
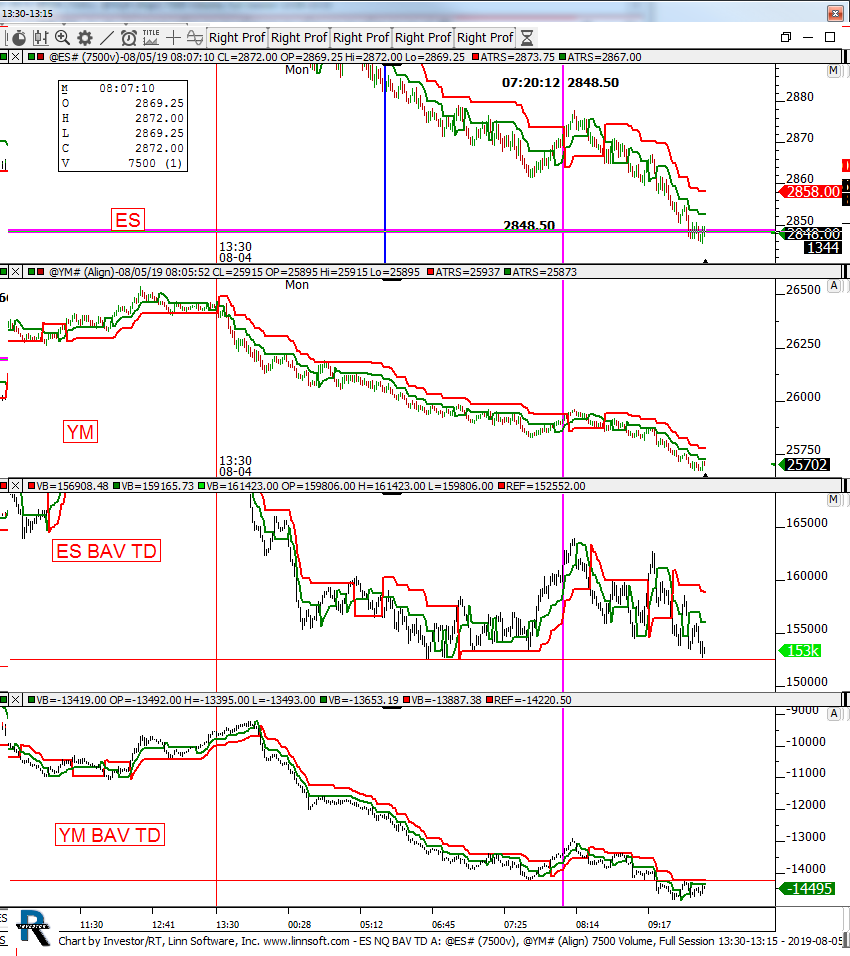 |
ES NQ BAV TD A (@ES#) kencassorla [totalcount]
6 years 12 months ago
ES NQ. This chart was uploaded by Investor/RT 13.5.24 showing symbol: @ES#. |
View |
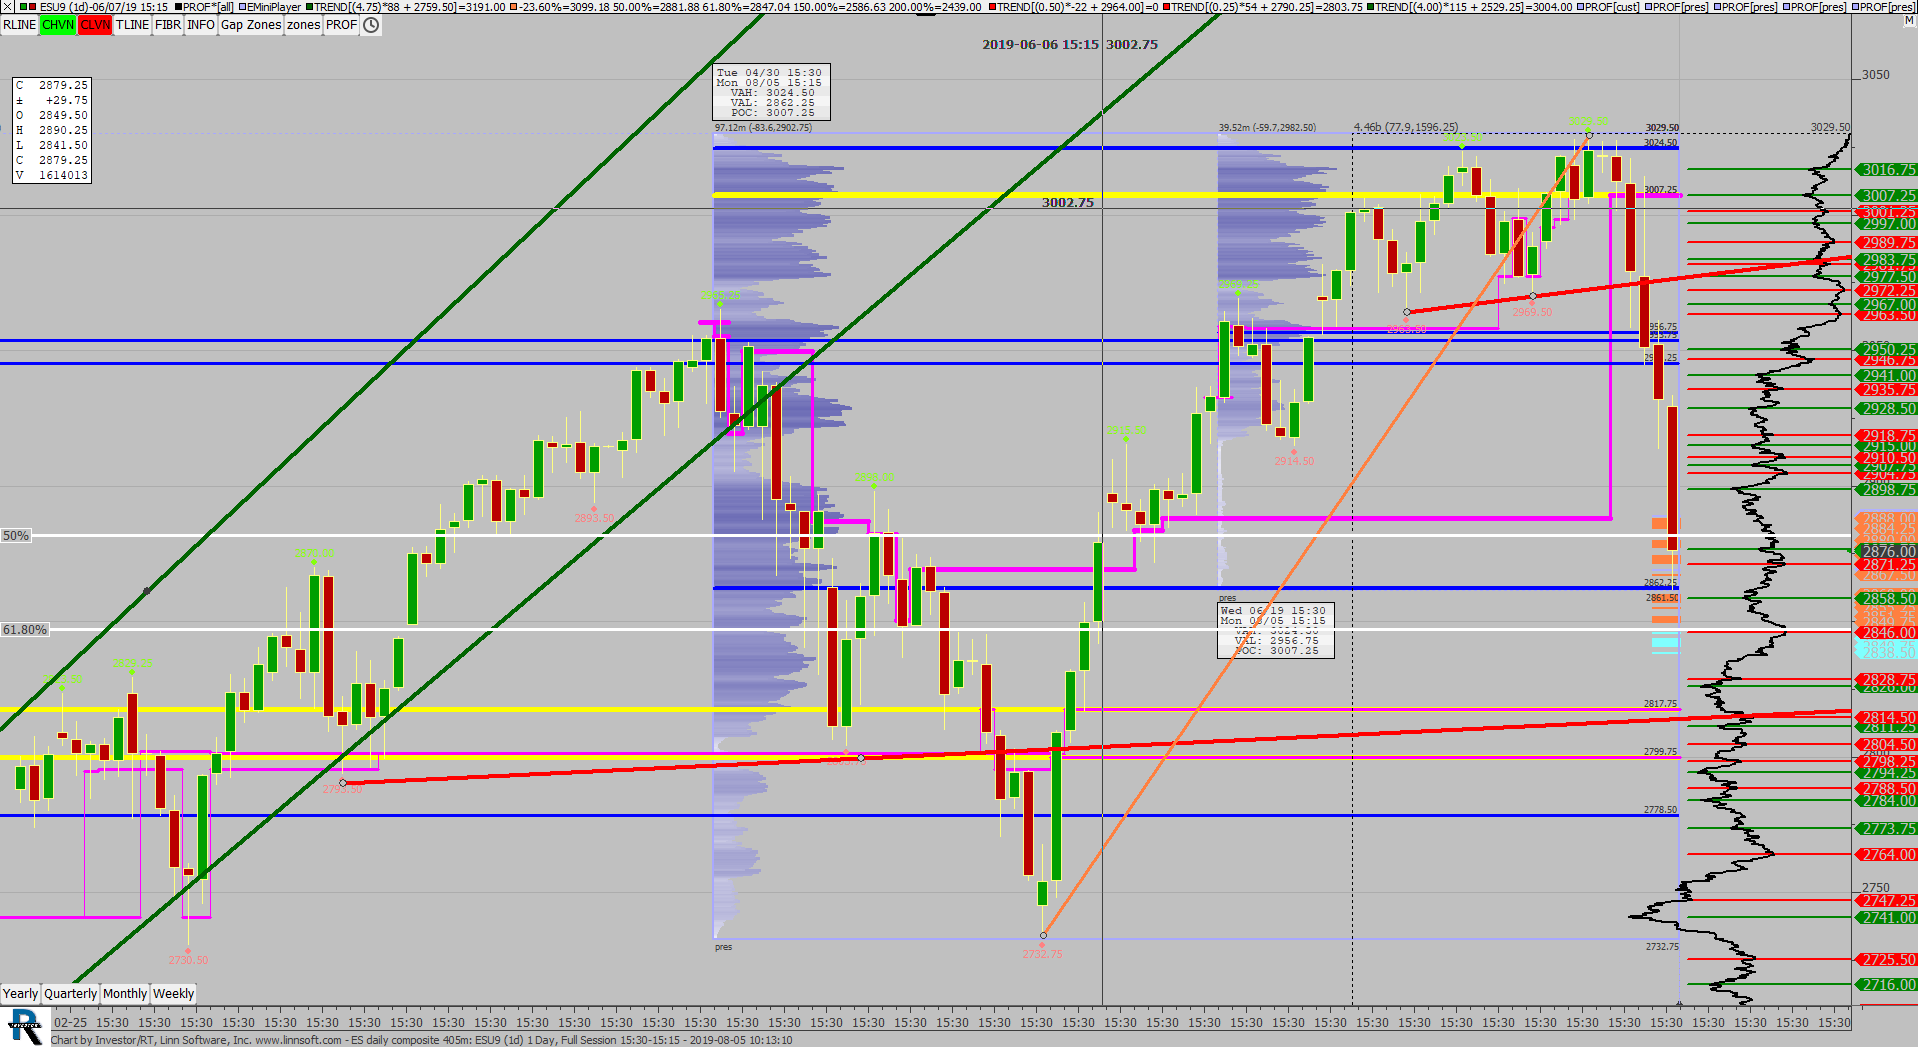 |
ES daily composite 405m (ESU9) scottz46 [totalcount]
6 years 12 months ago
This chart was uploaded by Investor/RT 13.5.24 showing symbol: ESU9. |
View |
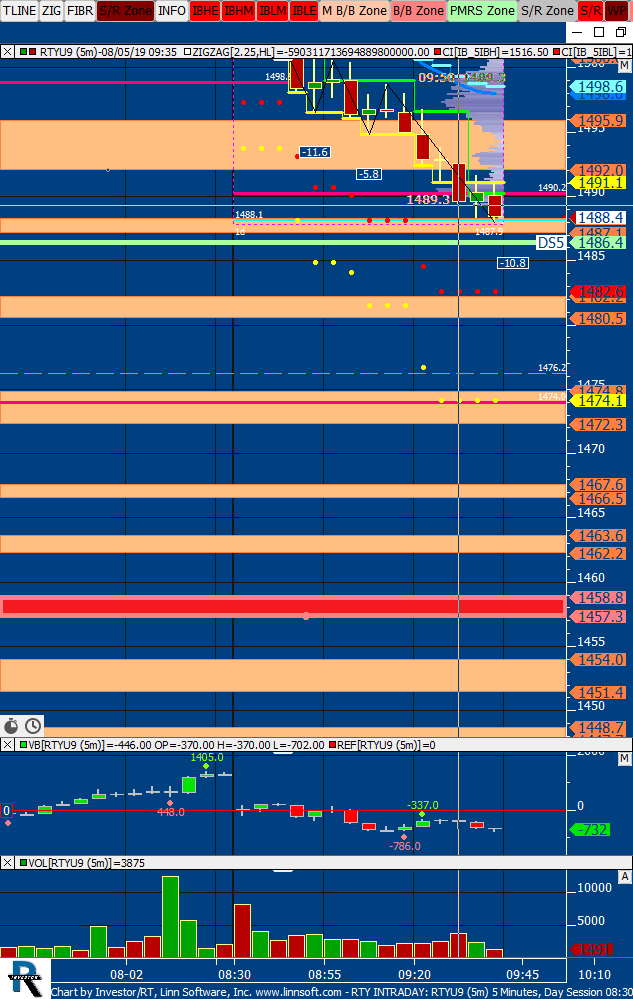 |
RTY INTRADAY (RTYU9) scottz46 [totalcount]
6 years 12 months ago
This chart was uploaded by Investor/RT 13.5.24 showing symbol: RTYU9. |
View |
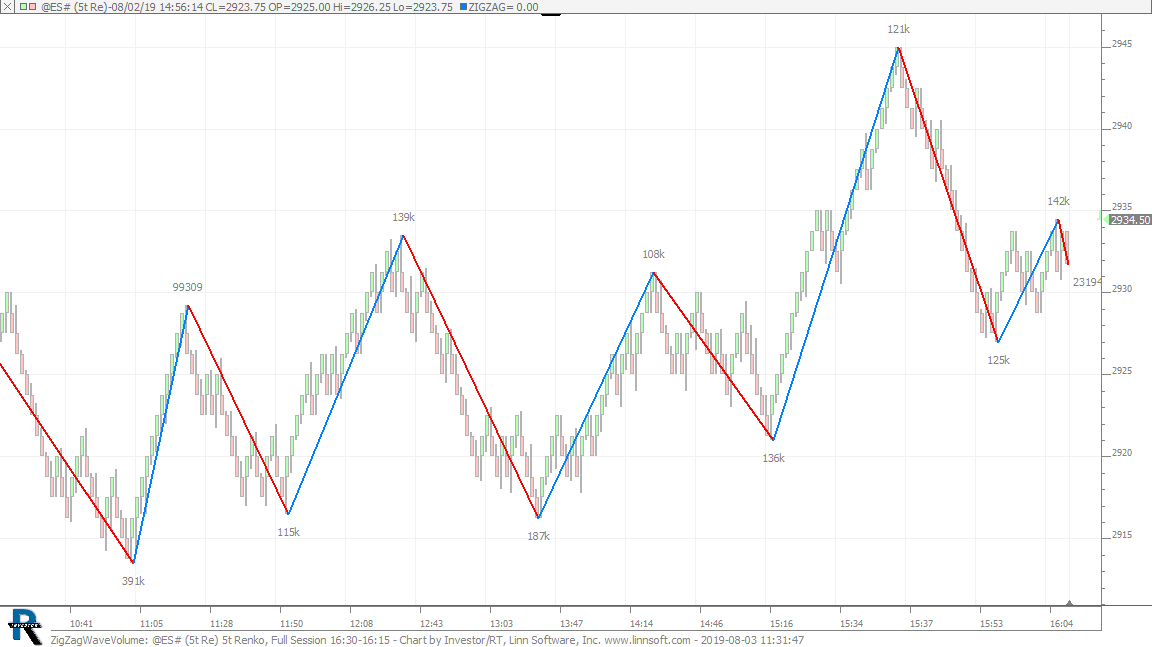 |
ZigZagWaveVolume (@ES#) cpayne [totalcount]
6 years 12 months ago
Volume of each wave. This chart was uploaded by Investor/RT 14.1.1 showing symbol: @ES#. |
View |
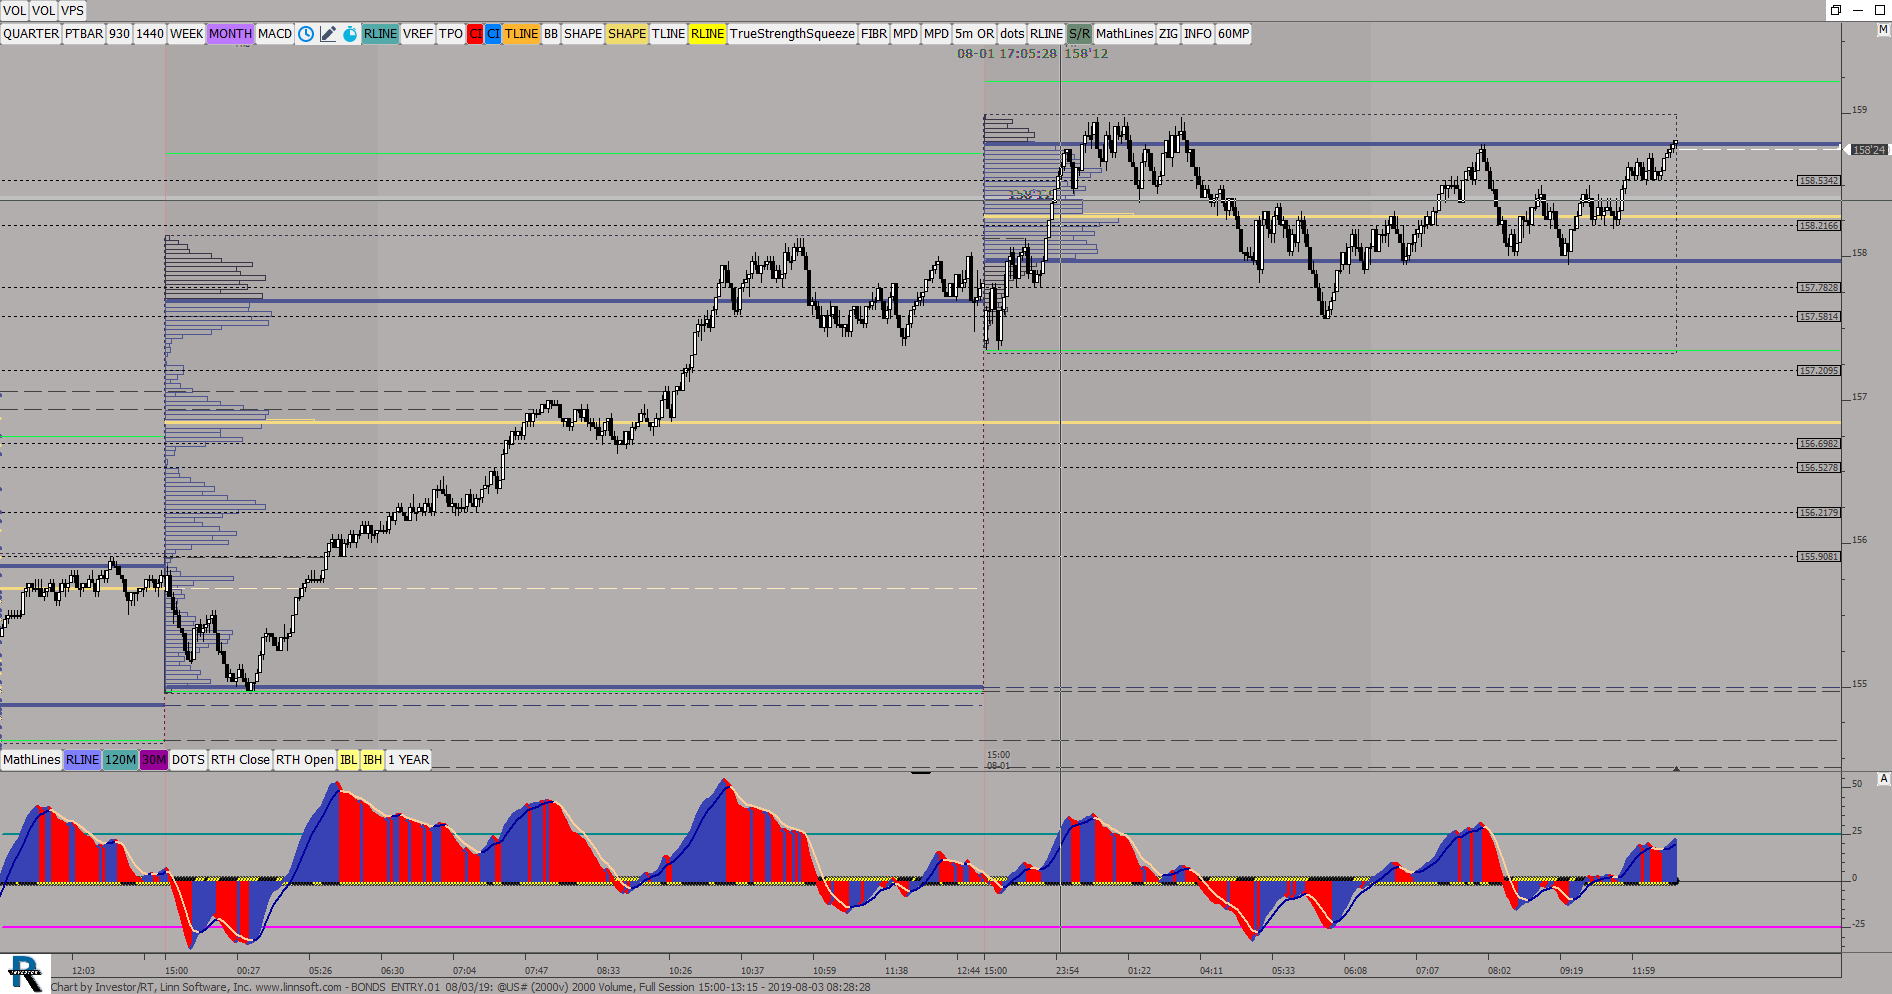 |
BONDS ENTRY01 08 03 (@US#) ES42 [totalcount]
6 years 12 months ago
Daily Profiles, 30 MIN. This chart was uploaded by Investor/RT 13.5.24 showing symbol: @US#. |
View |
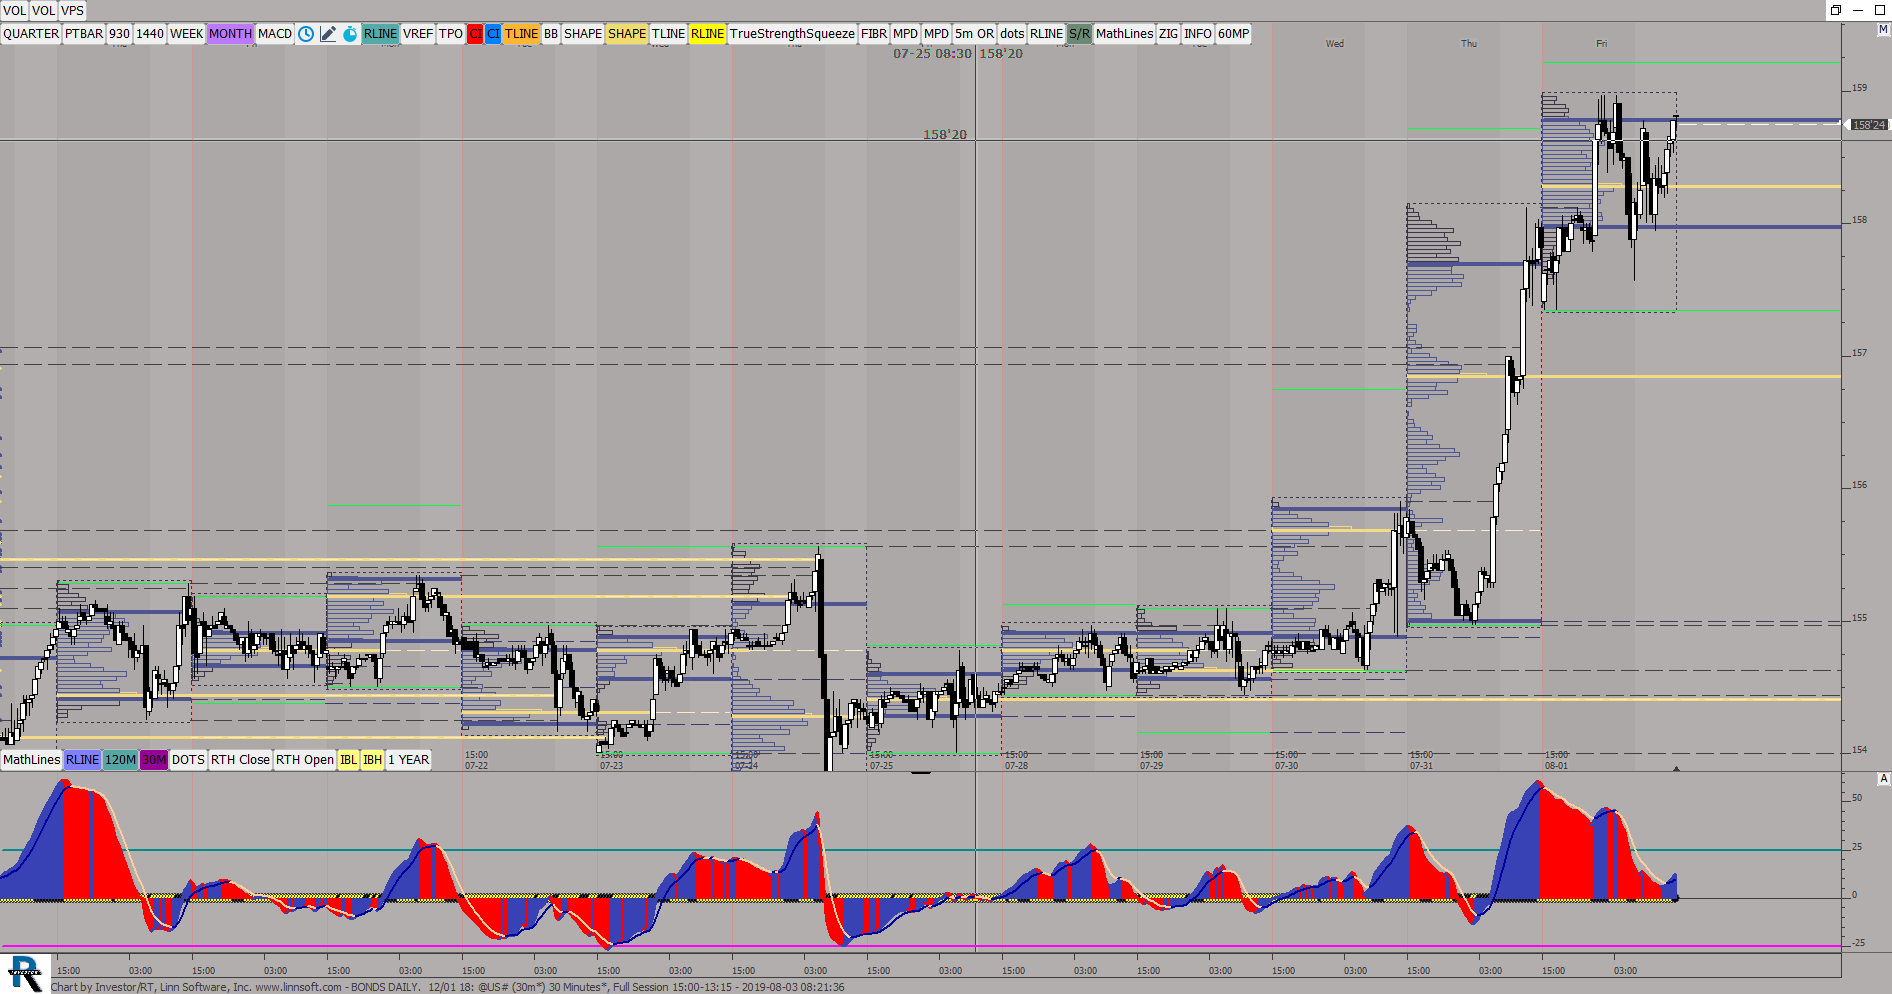 |
BONDS DAILY 12 01 (@US#) ES42 [totalcount]
6 years 12 months ago
GOLD Daily Profiles. This chart was uploaded by Investor/RT 13.5.11 showing symbol: @US#. |
View |
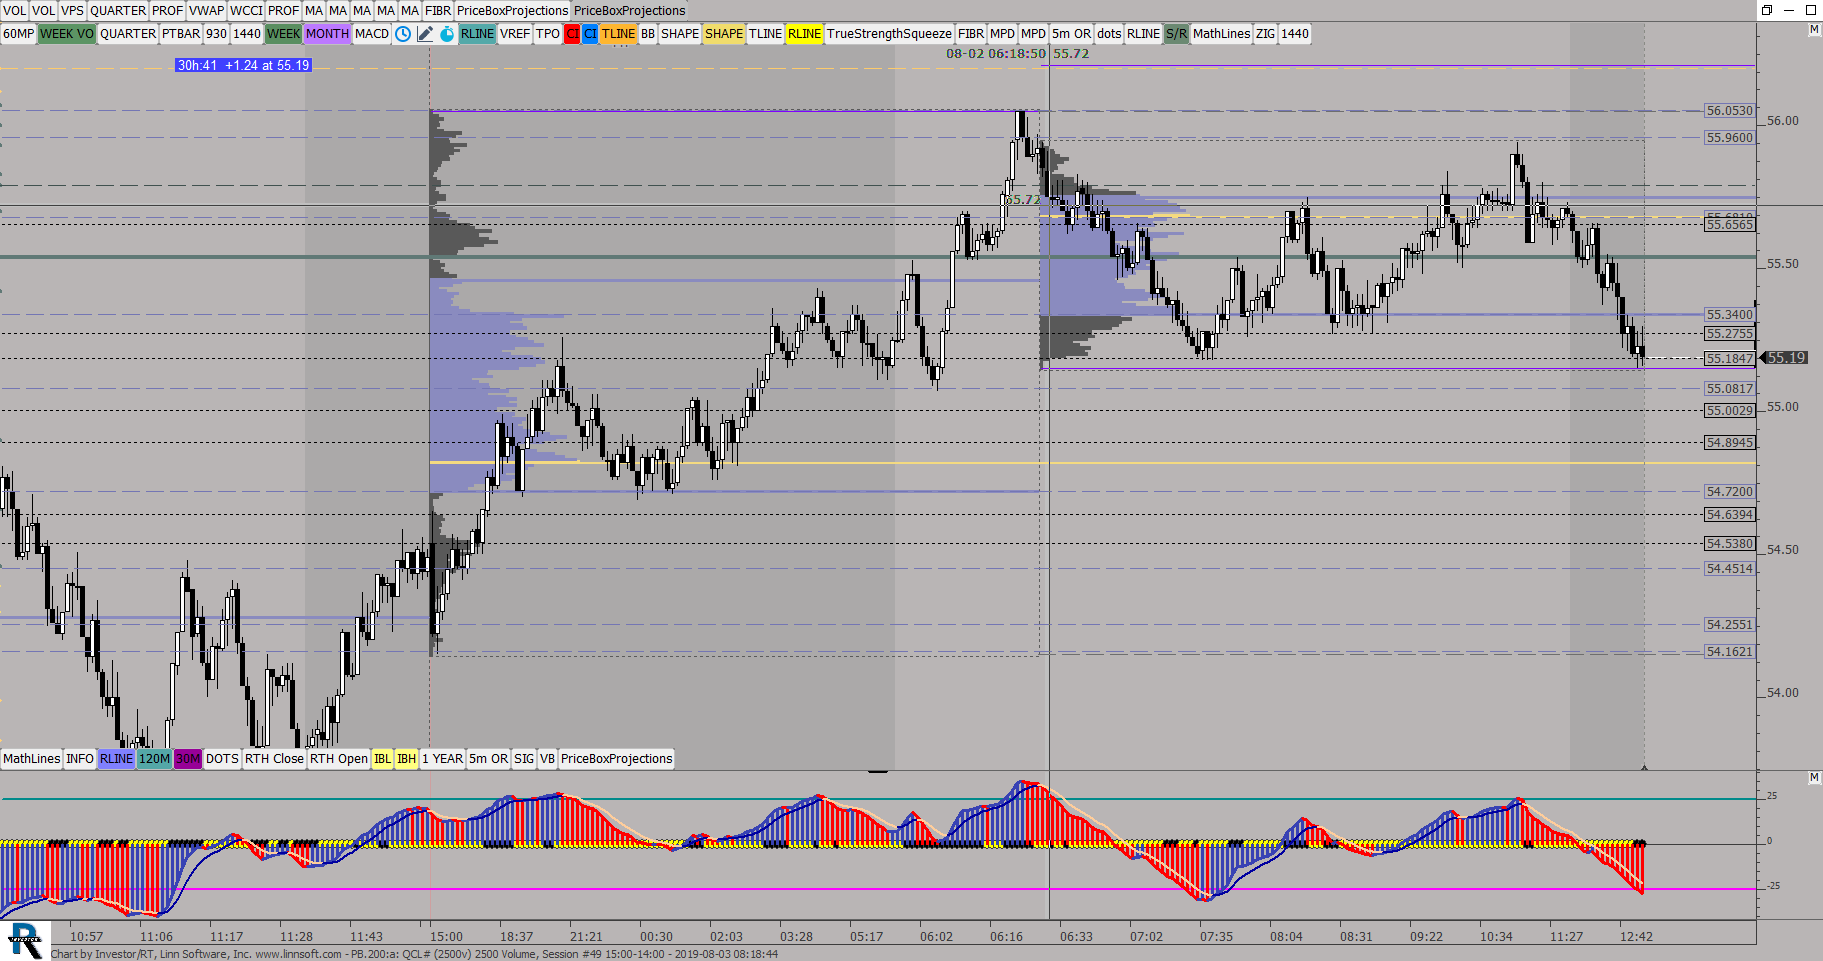 |
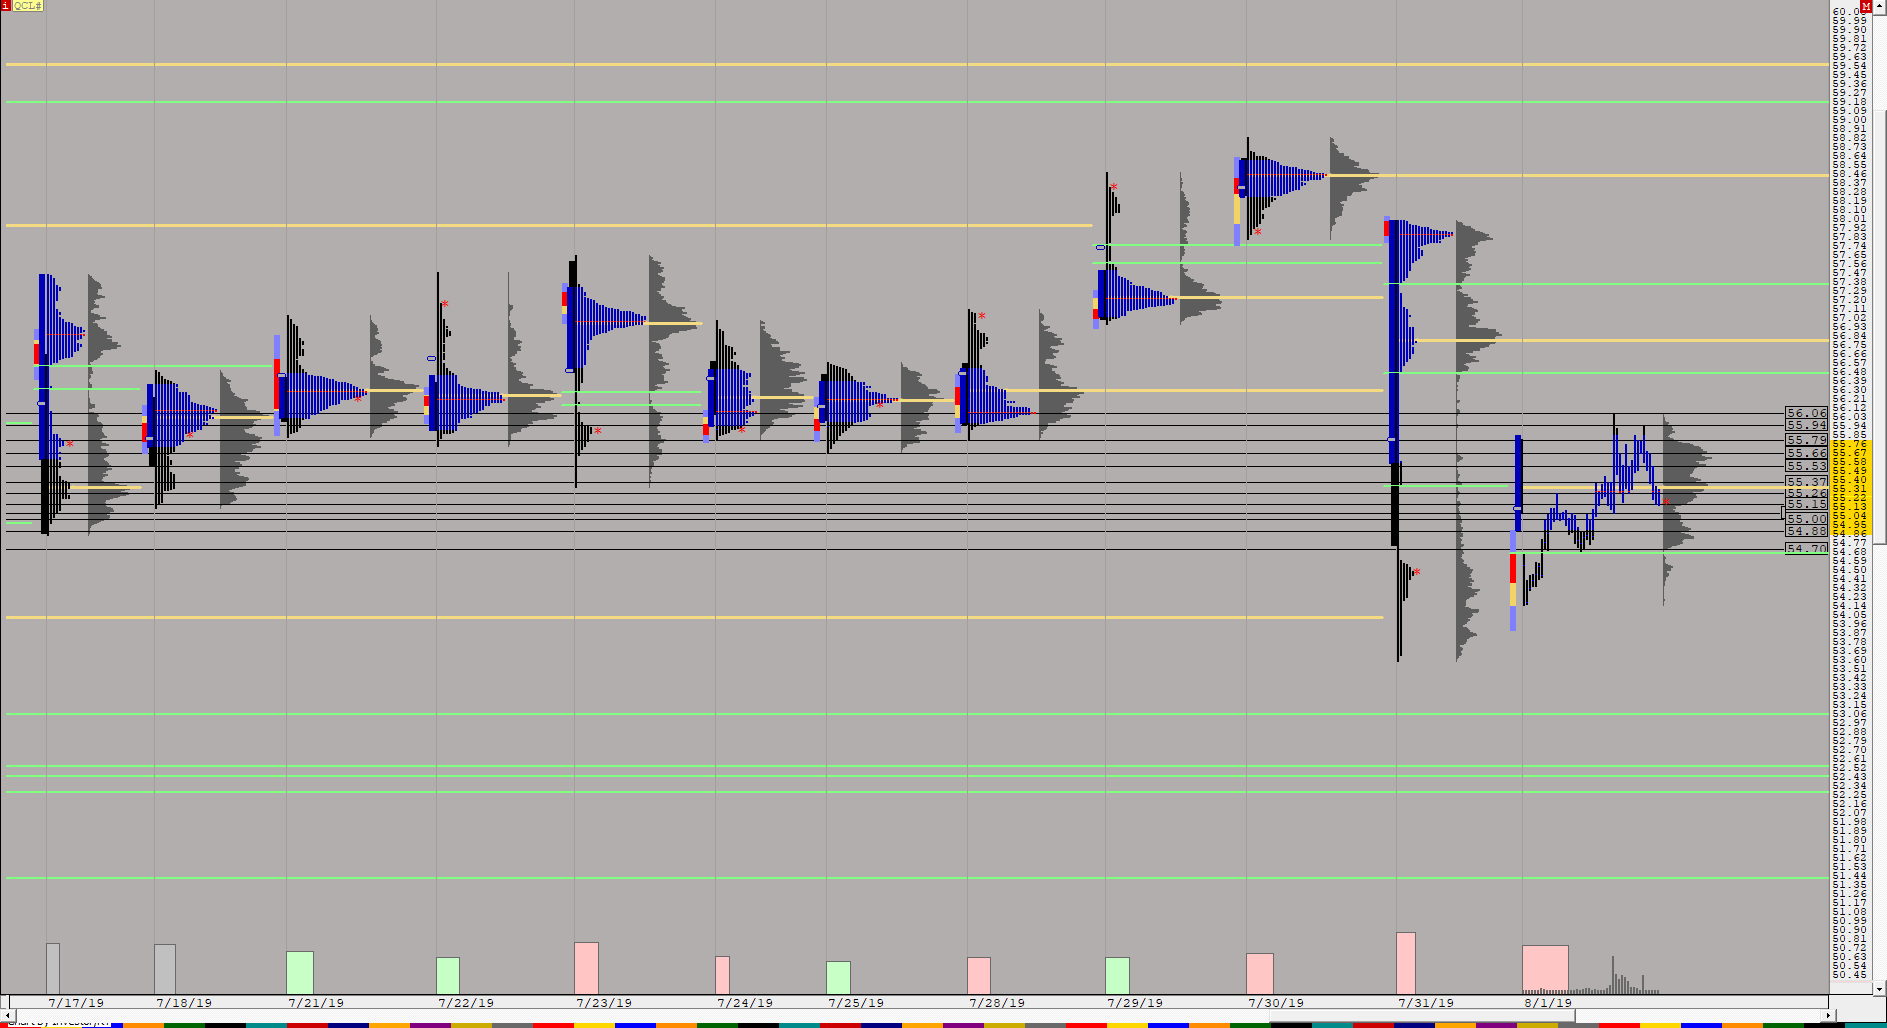
PB200a (QCL#) ES42 [totalcount]
6 years 12 months ago
Daily Profiles, Entry chart. This chart was uploaded by Investor/RT 13.5.24 showing symbol: QCL#. |
View |
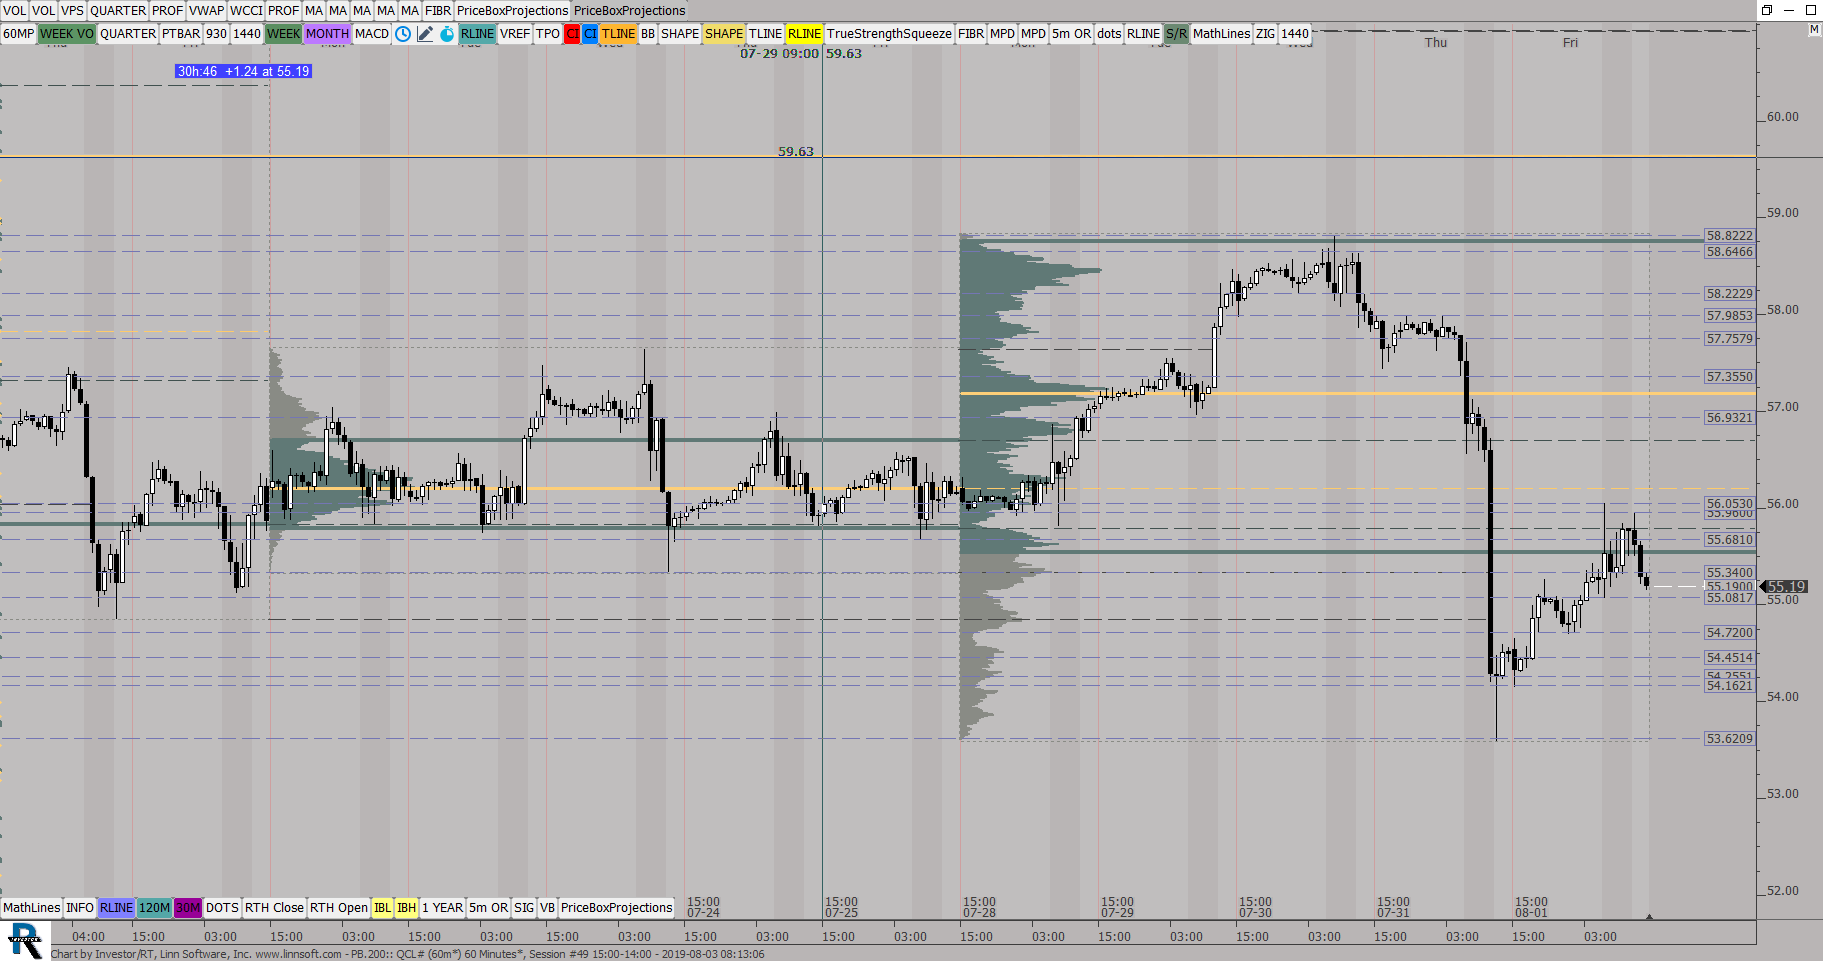 |
PB (QCL#) ES42 [totalcount]
6 years 12 months ago
Weekly Profiles, 60 MIN Camdles. This chart was uploaded by Investor/RT 13.5.24 showing symbol: QCL#. |
View |
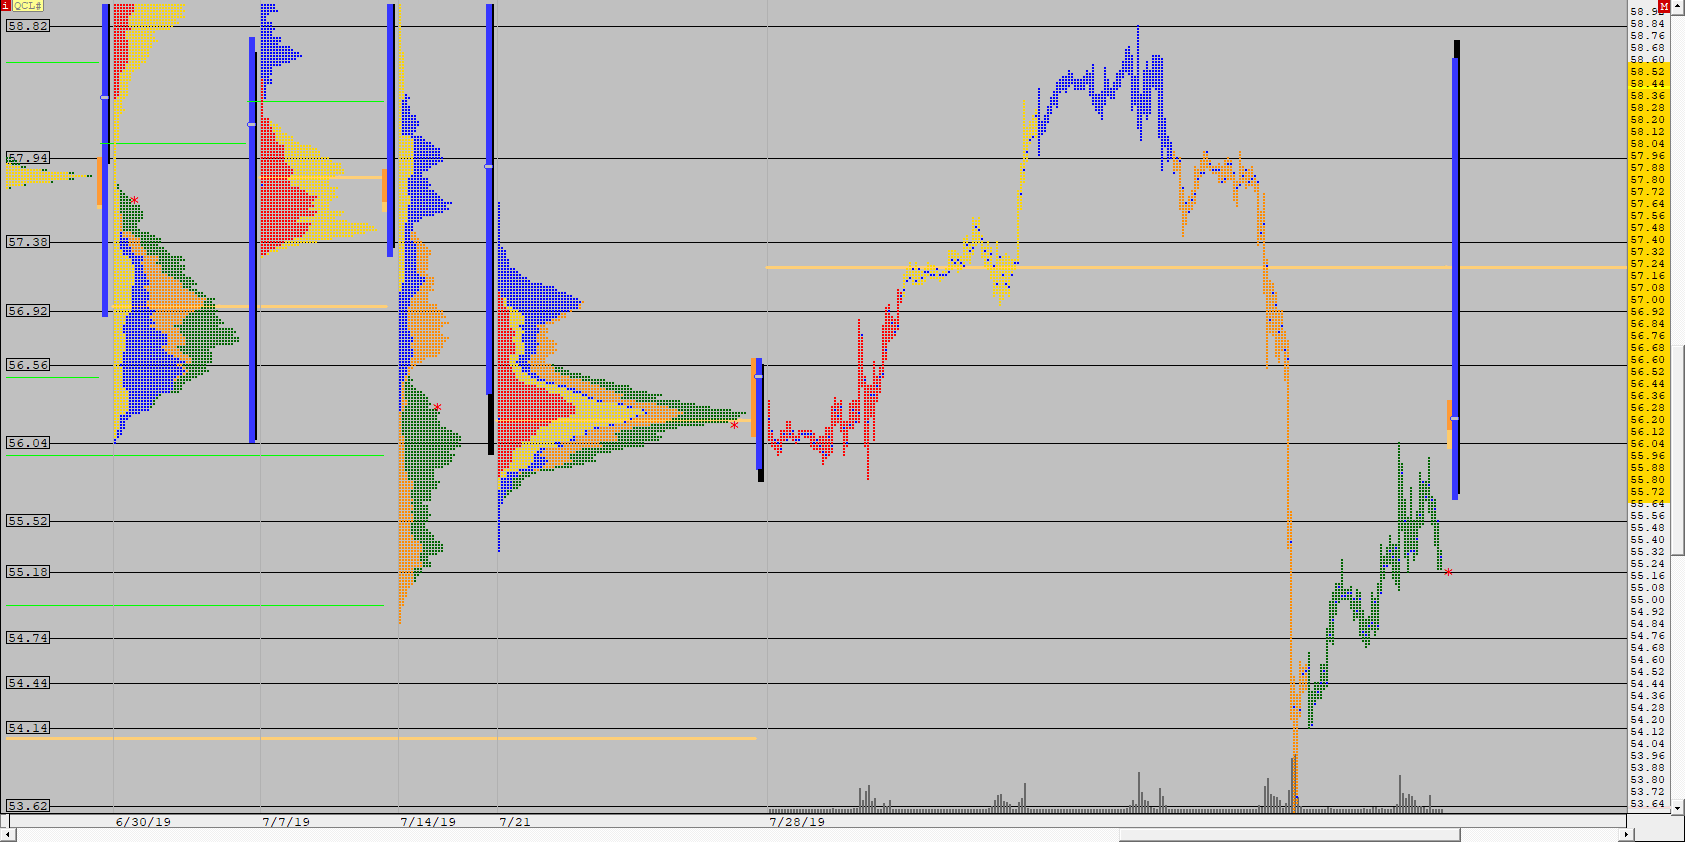 |
CL MP WEEKLY (QCL#) ES42 [totalcount]
6 years 12 months ago
Week Profile and hourly Candles. This chart was uploaded by Investor/RT 13.5.17 showing symbol: QCL#. |
View |
 |
S R Daily TPOCL (QCL#) ES42 [totalcount]
6 years 12 months ago
24 hour Oil Profiles. This chart was uploaded by Investor/RT 13.5.12 showing symbol: QCL#. |
View |
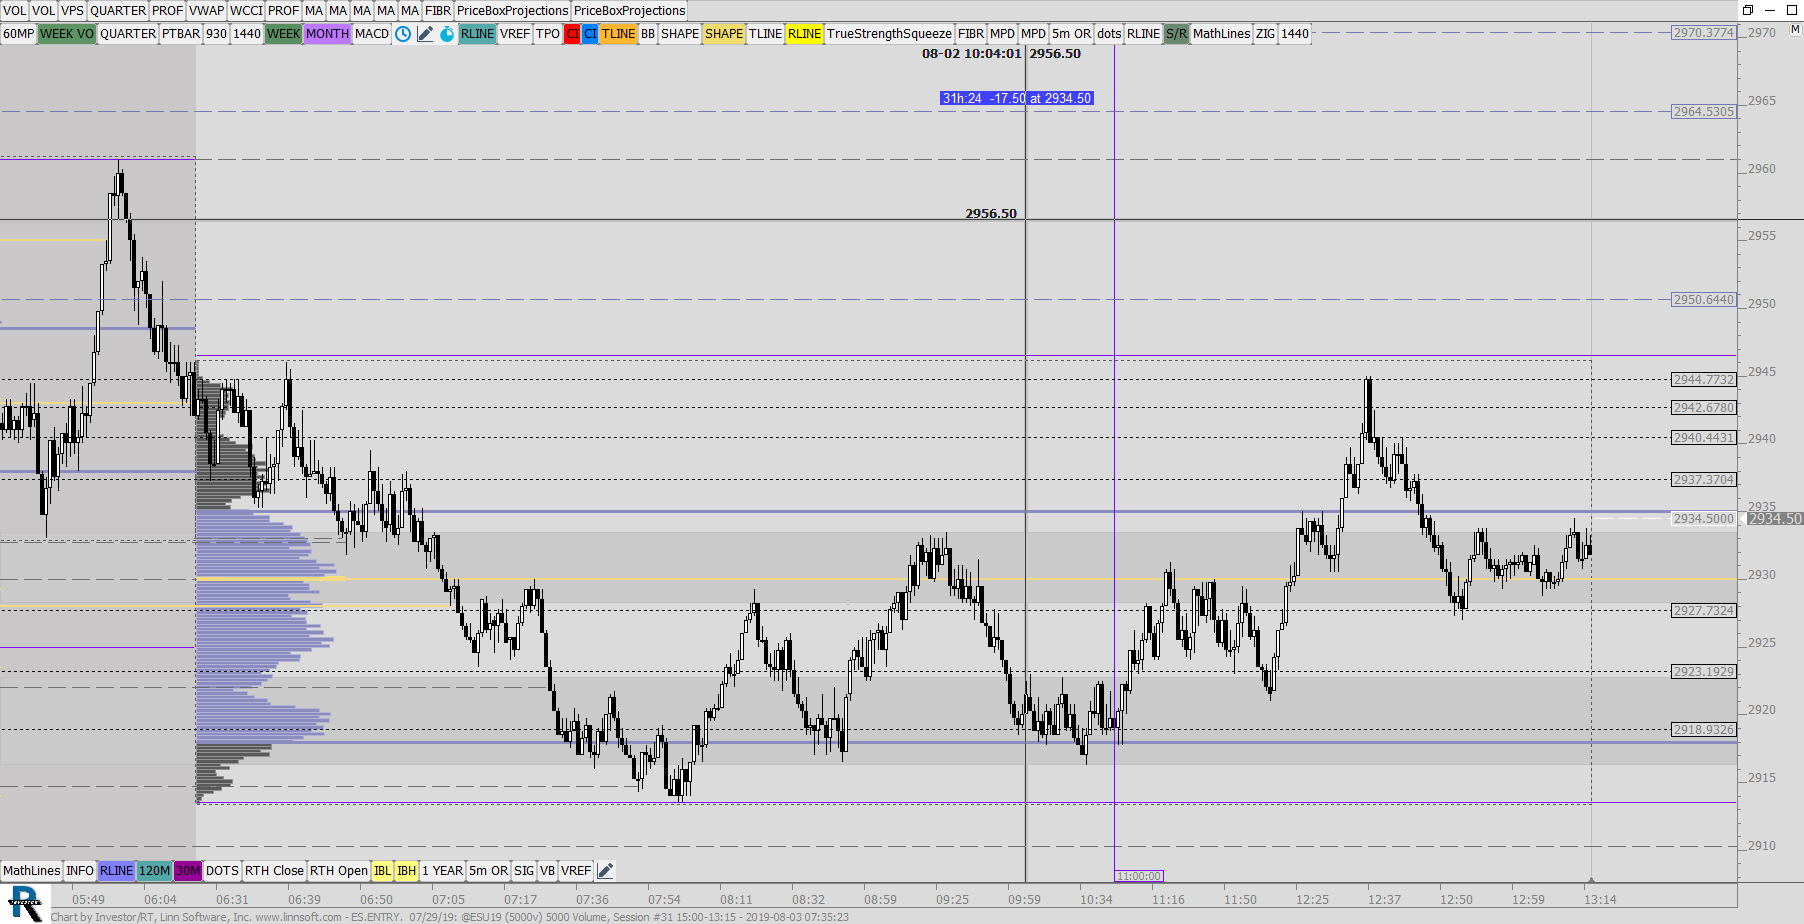 |
ESENTRY 07 29 (@ESU19) ES42 [totalcount]
6 years 12 months ago
This chart was uploaded by Investor/RT 13.5.24 showing symbol: @ESU19. |
View |
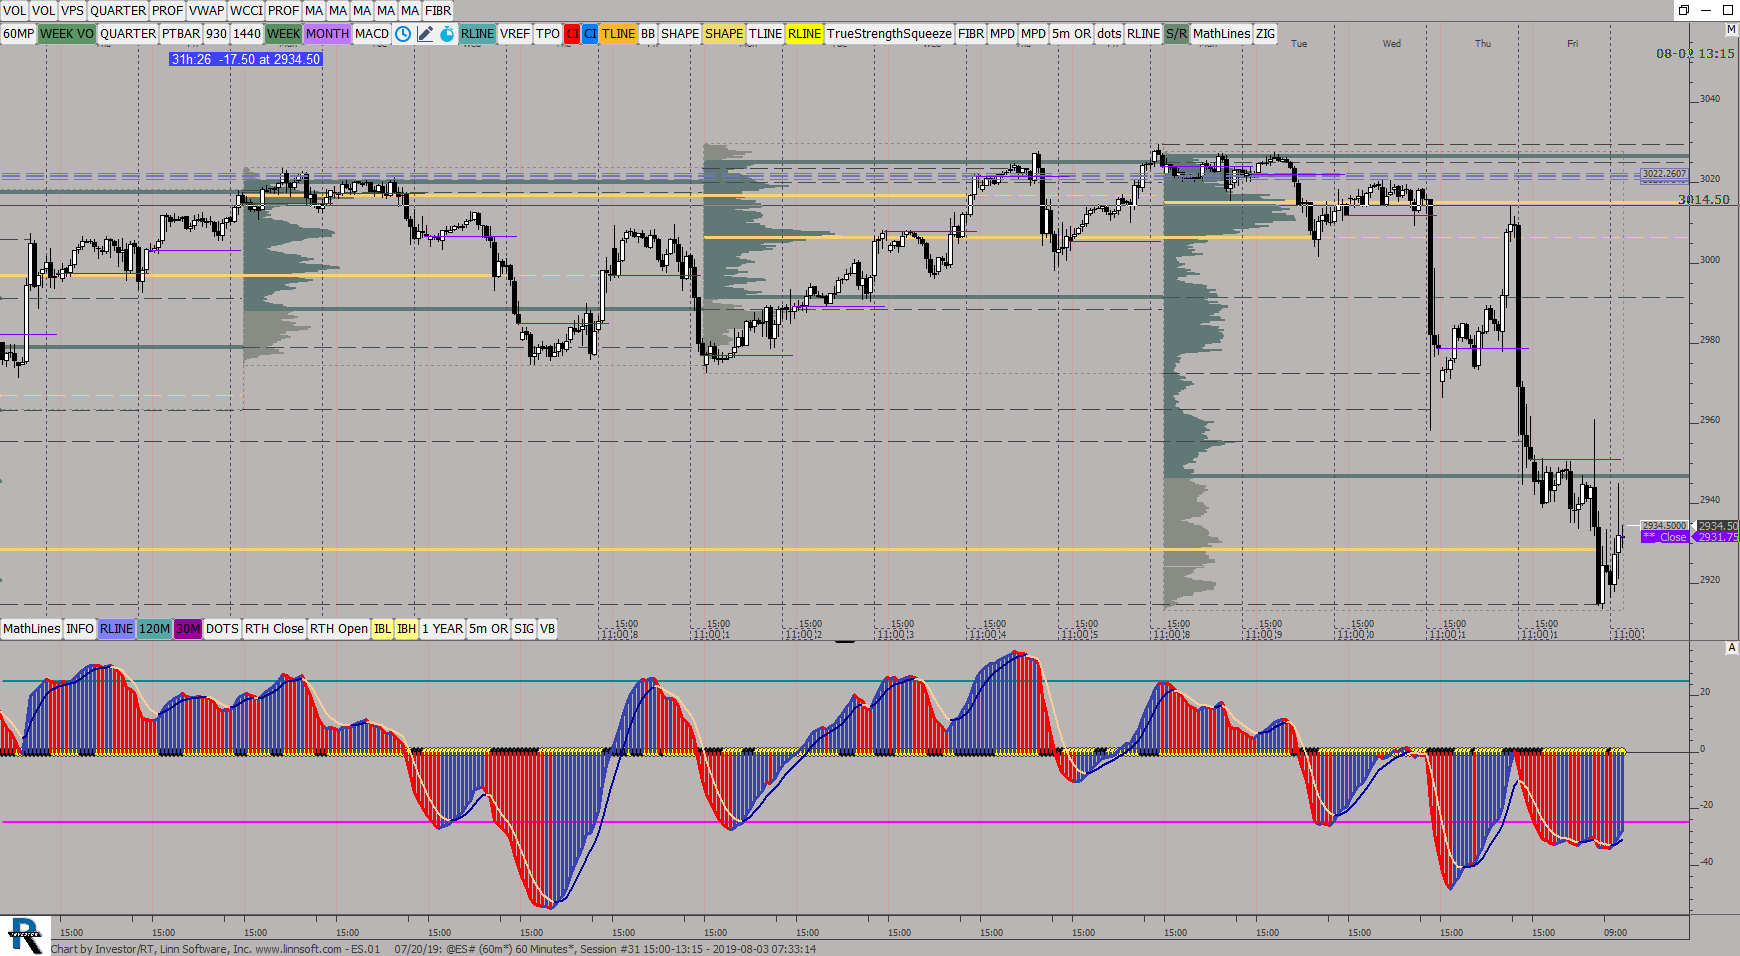 |
ES01 07 20 (@ES#) ES42 [totalcount]
6 years 12 months ago
Weekly Profile_ 2 hour Candles. This chart was uploaded by Investor/RT 13.5.24 showing symbol: @ES#. |
View |
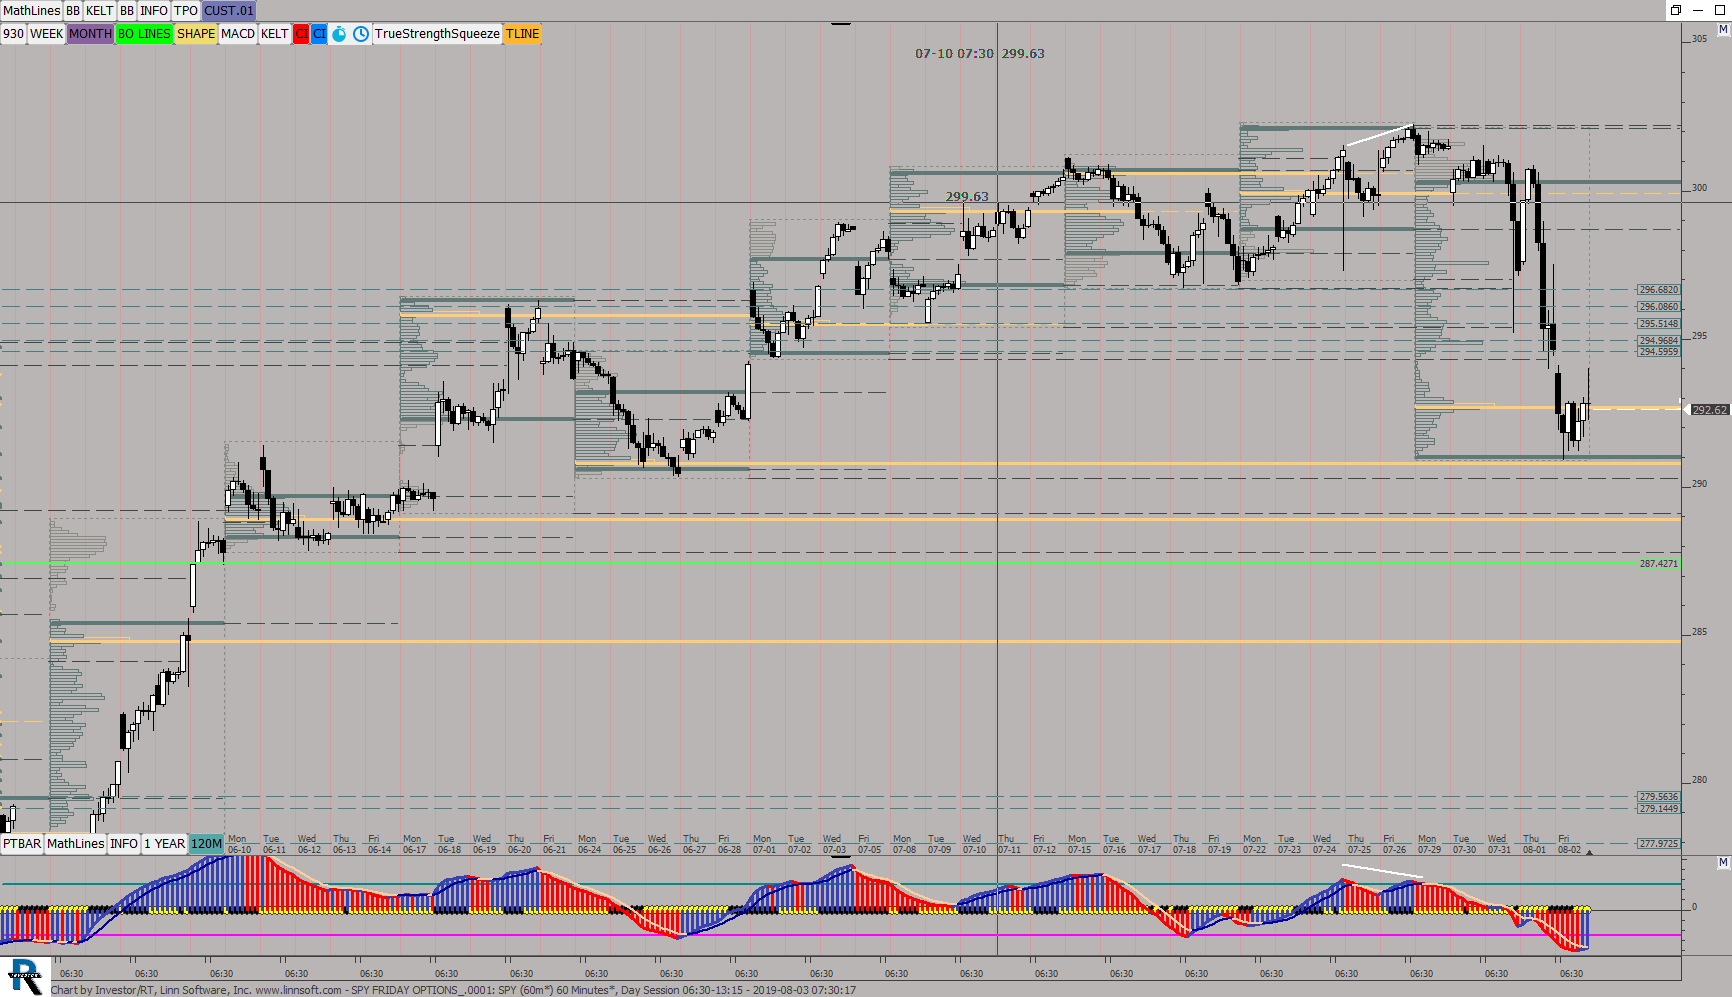 |
SPY FRIDAY OPTIONS (SPY) ES42 [totalcount]
6 years 12 months ago
This chart was uploaded by Investor/RT 13.5.24 showing symbol: SPY. |
View |
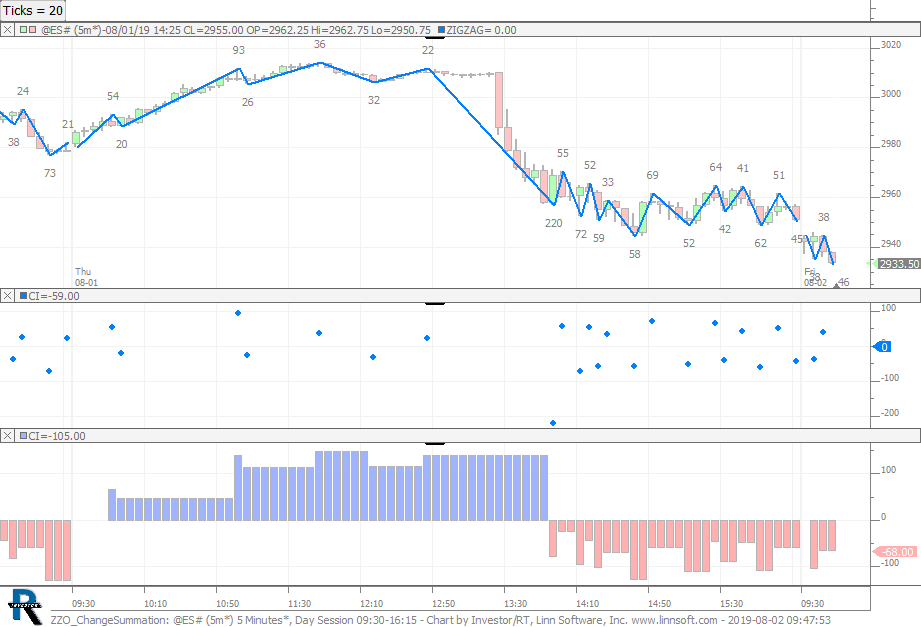 |
ZZO ChangeSummation (@ES#) cpayne [totalcount]
6 years 12 months ago
Sums the change (in ticks) from the zig zag moves for the session. This chart was uploaded by Investor/RT 14.1.1 showing symbol: @ES#. |
View |
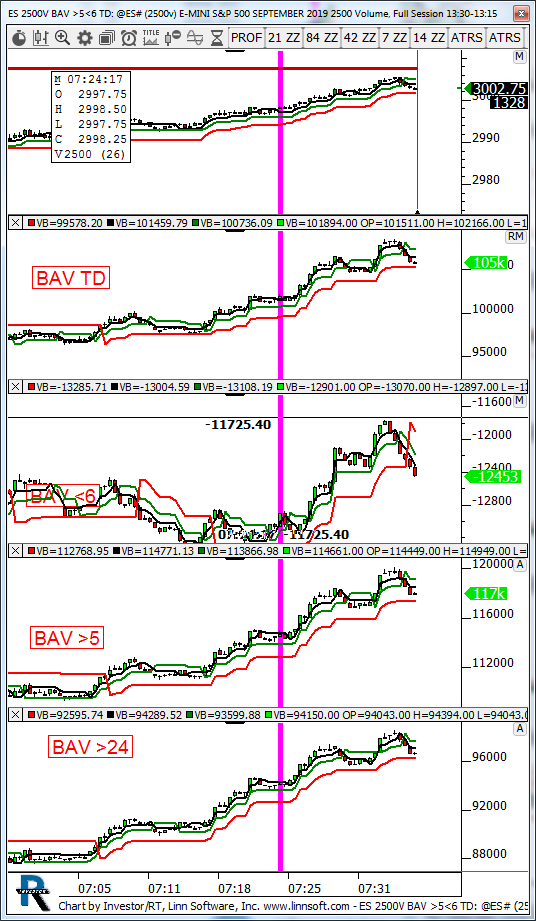 |
ES 2500V BAV 56 TD (@ES#) kencassorla [totalcount]
7 years 3 hours ago
2500V. This chart was uploaded by Investor/RT 13.5.24 showing symbol: @ES#. |
View |
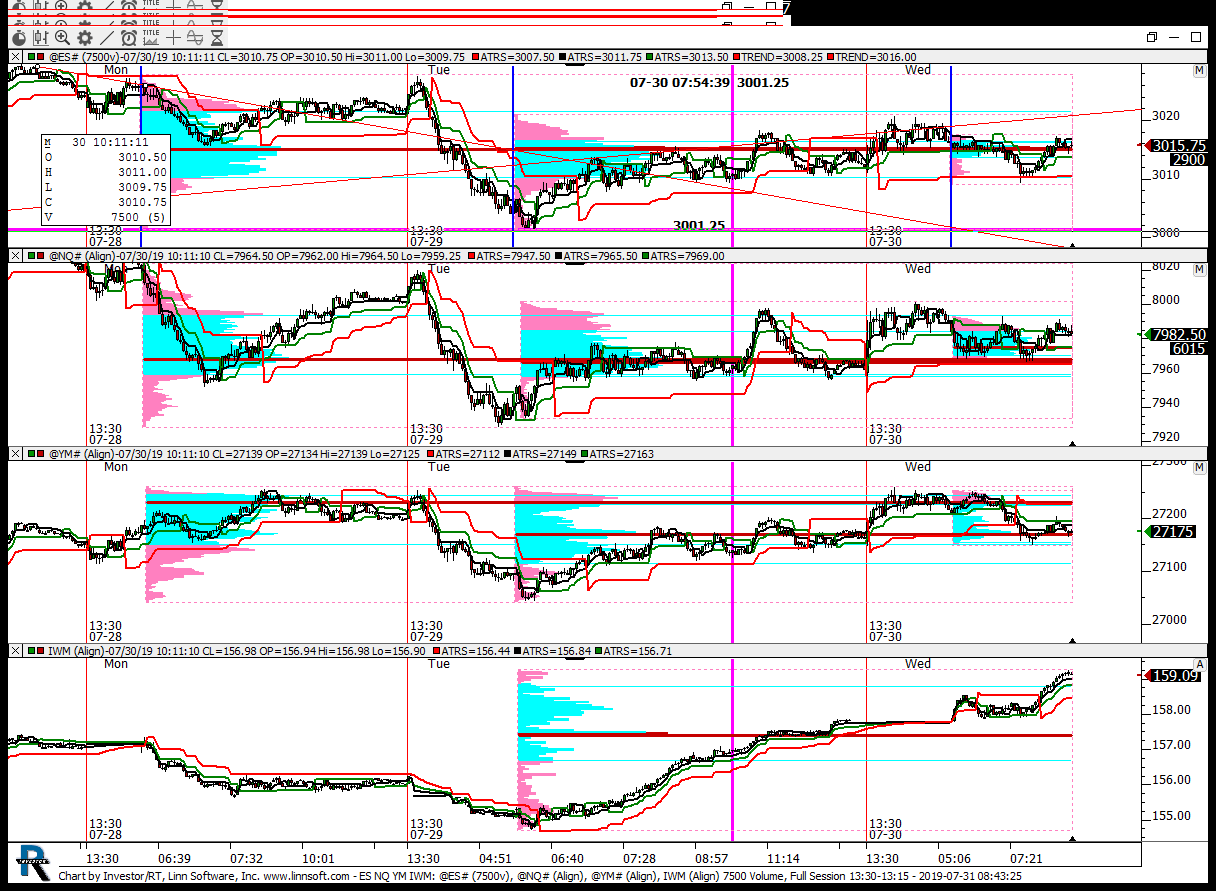 |
ES NQ YM IWM (@ES#) kencassorla [totalcount]
7 years 1 day ago
indexes. This chart was uploaded by Investor/RT 13.5.24 showing symbol: @ES#. |
View |
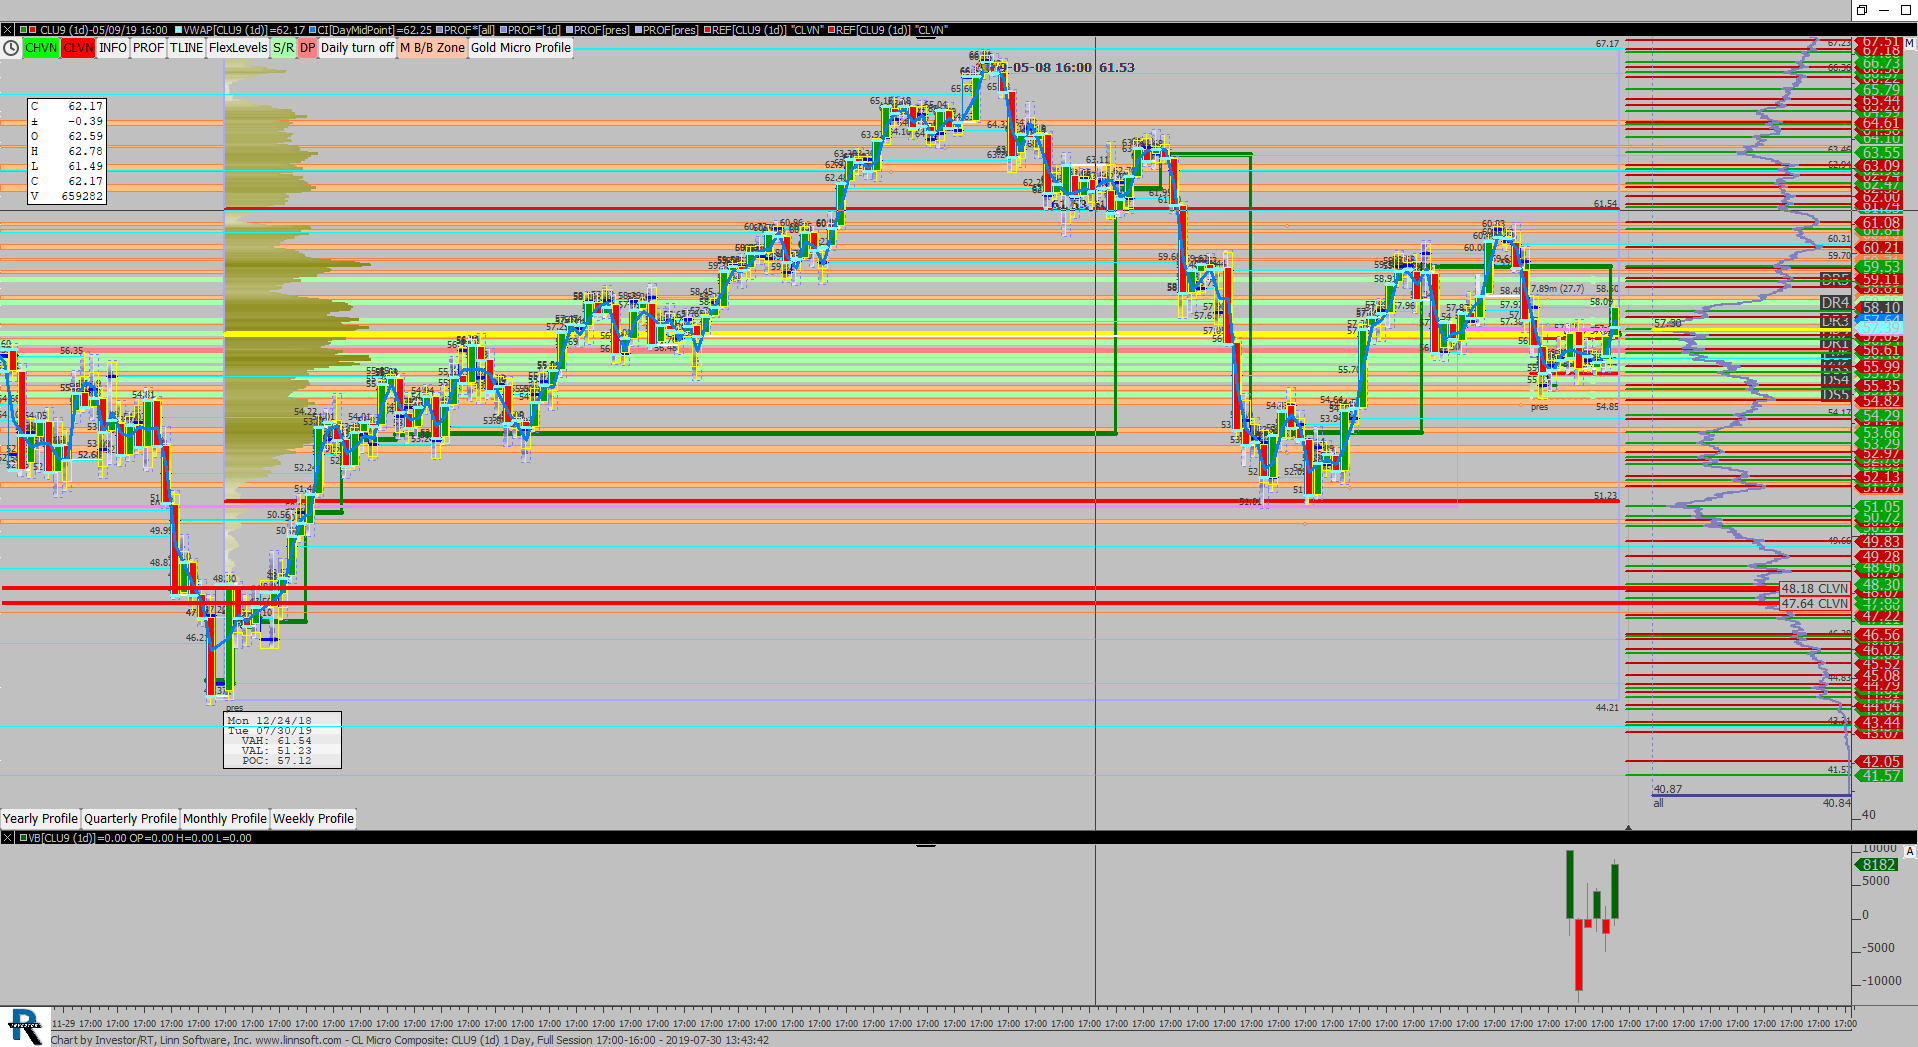 |
CL Micro Composite (CLU9) scottz46 [totalcount]
7 years 1 day ago
This chart was uploaded by Investor/RT 13.5.24 showing symbol: CLU9. |
View |
 |
YM0001a (@YM#) ES42 [totalcount]
7 years 4 days ago
Weekly Profiles, 120 Min Bars. This chart was uploaded by Investor/RT 13.5.24 showing symbol: @YM#. |
View |
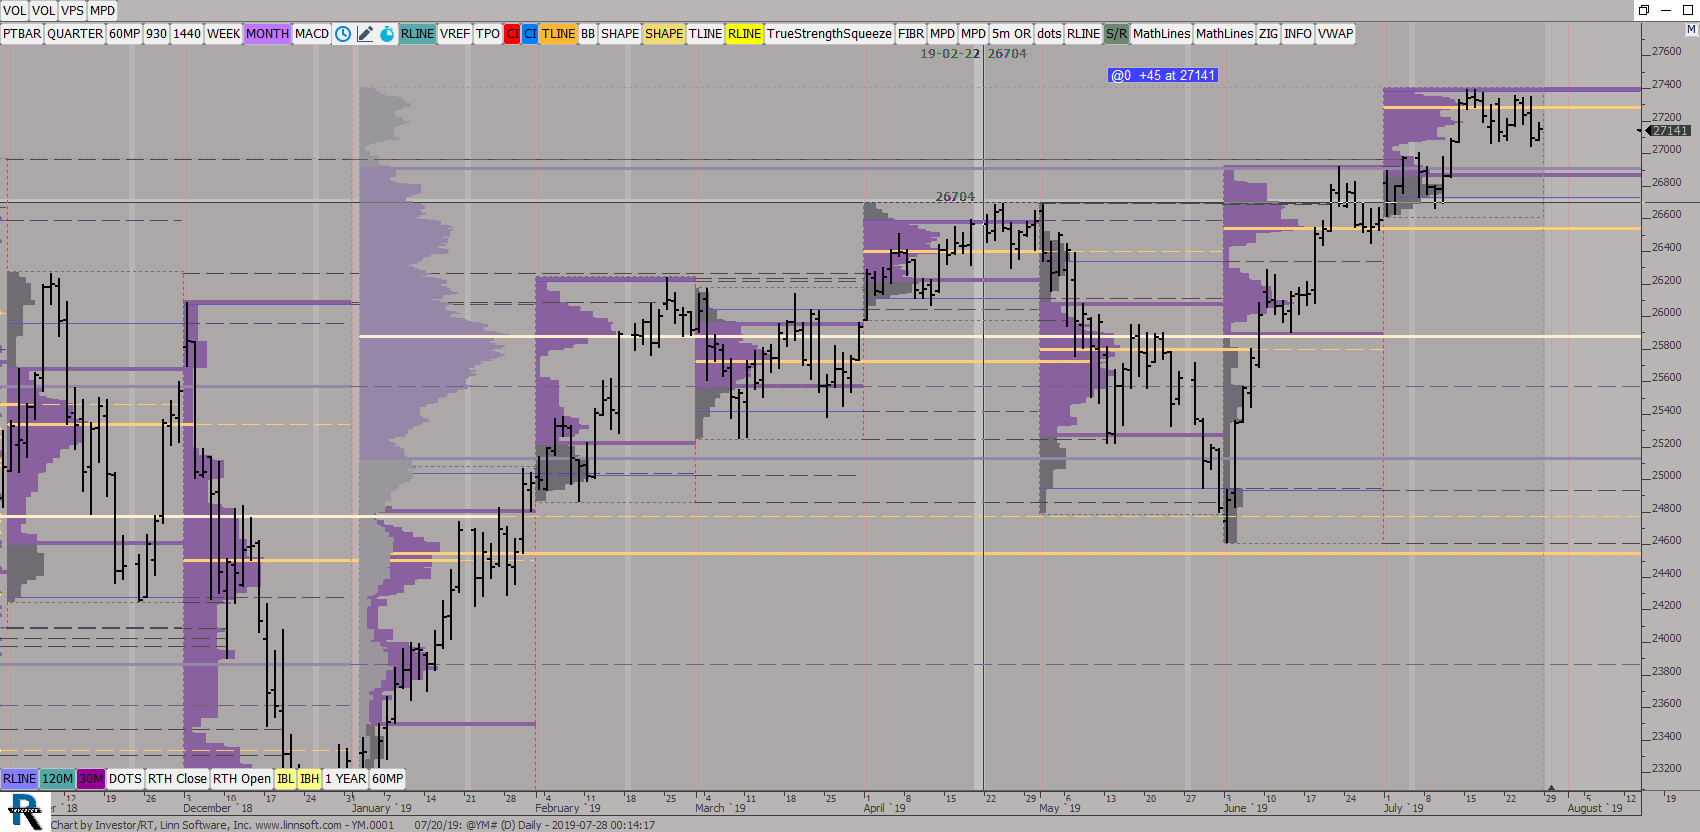 |
YM0001 07 20 (@YM#) ES42 [totalcount]
7 years 4 days ago
Monthly Profiles, Daily Bars. This chart was uploaded by Investor/RT 13.5.24 showing symbol: @YM#. |
View |
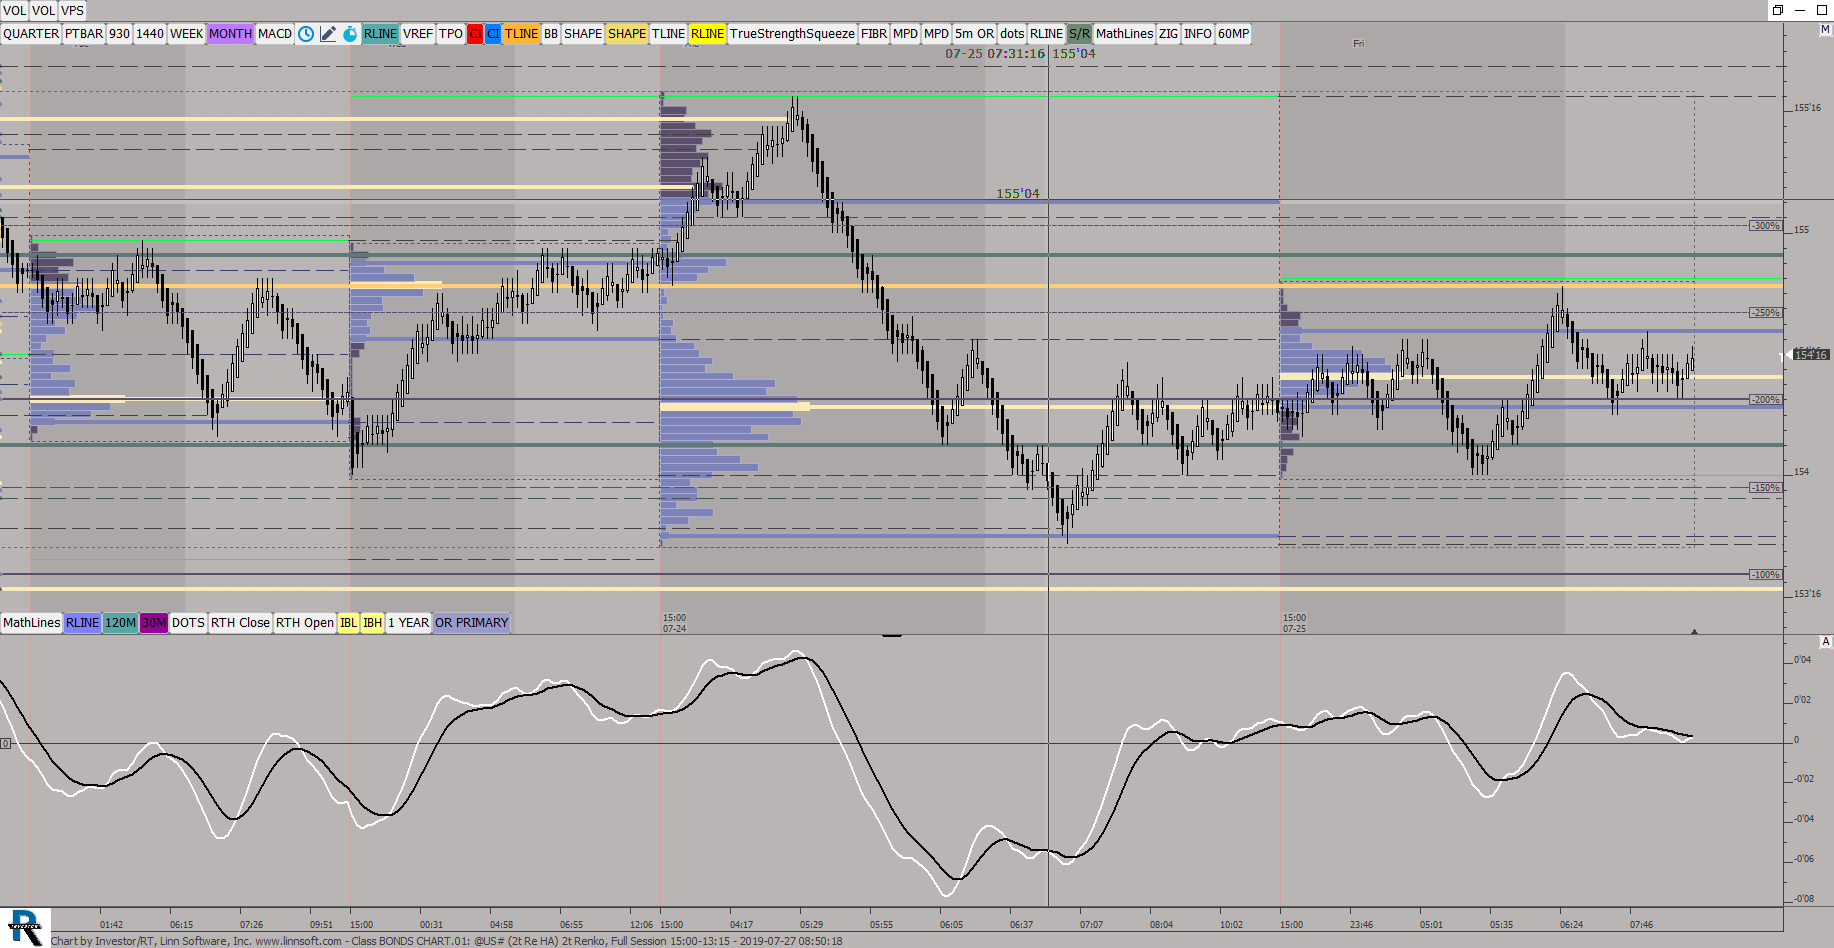 |
Class BONDS CHART (@US#) ES42 [totalcount]
7 years 5 days ago
This chart was uploaded by Investor/RT 13.3.5 showing symbol: @US#. |
View |
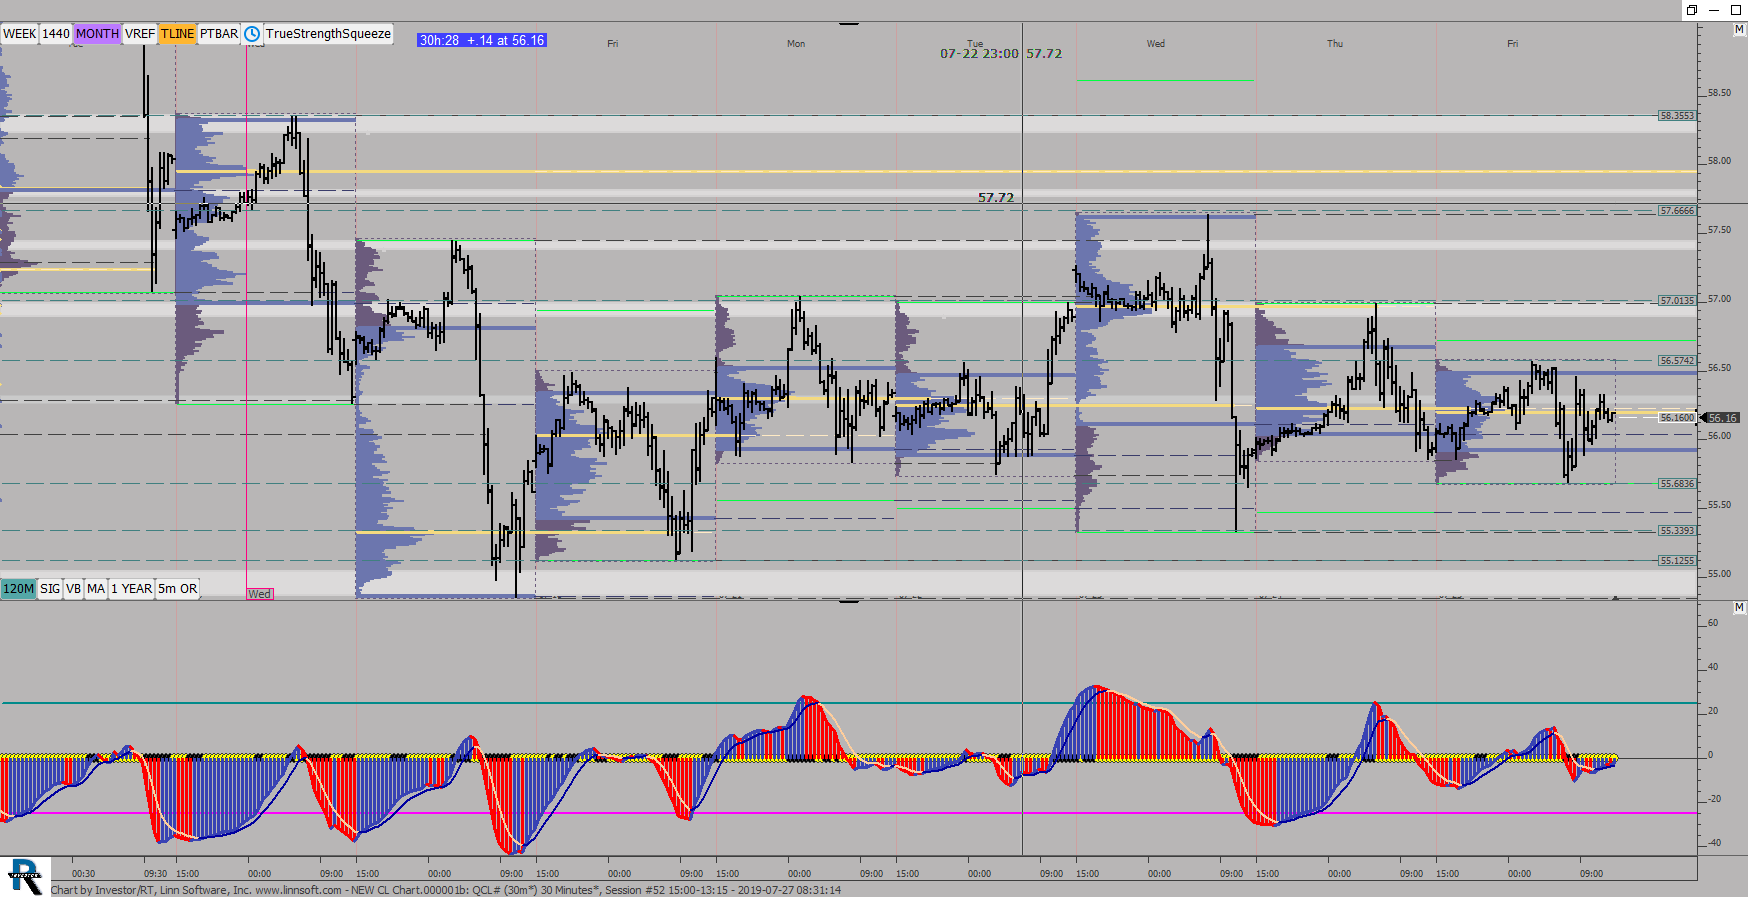 |
NEW CL Chart000001b (QCL#) ES42 [totalcount]
7 years 5 days ago
Daily Profiles, 30 min Bars. This chart was uploaded by Investor/RT 13.5.24 showing symbol: QCL#. |
View |
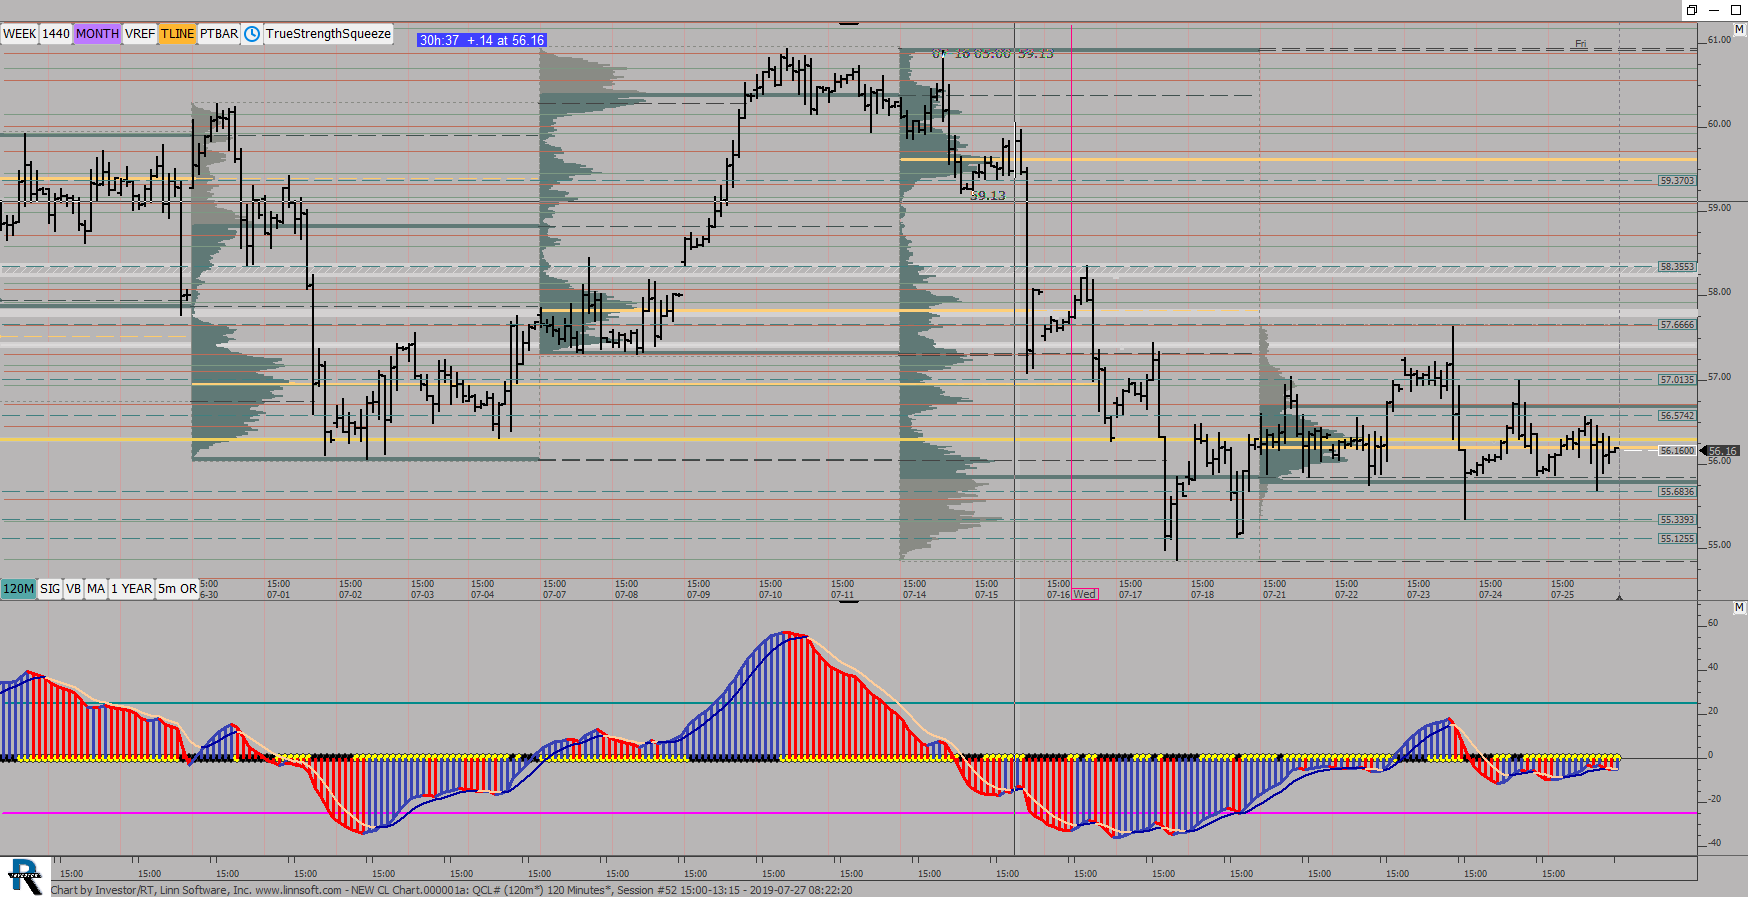 |
NEW CL Chart000001a (QCL#) ES42 [totalcount]
7 years 5 days ago
120 MIN Candles, Weekly Profiles. This chart was uploaded by Investor/RT 13.5.24 showing symbol: QCL#. |
View |