SE ZigRetracement (@TY#)
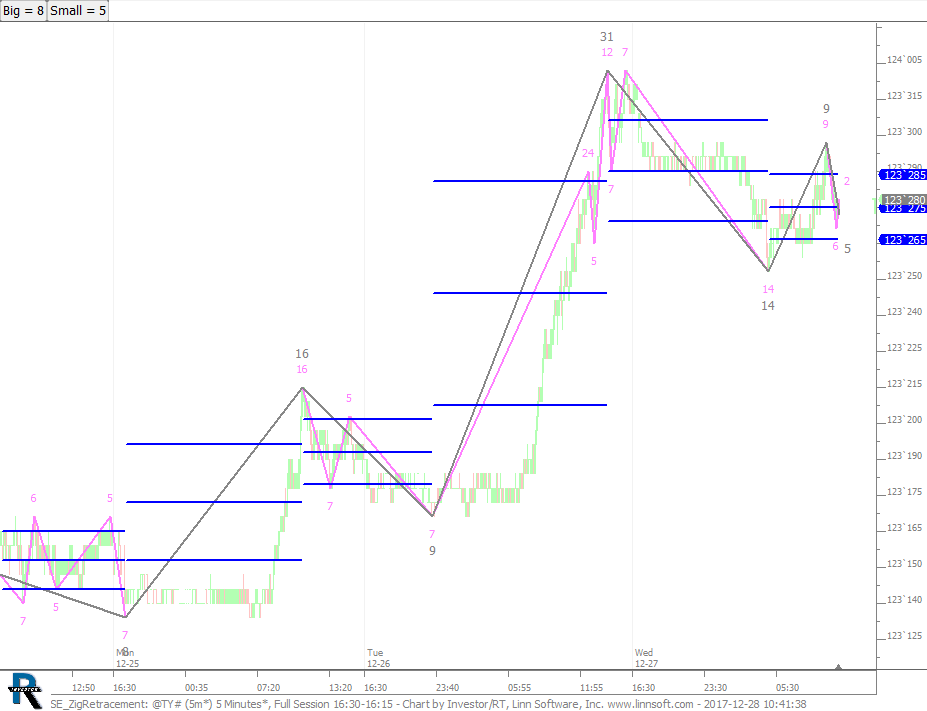
Zig Retracement - Big and Small Moves. This chart was uploaded by Investor/RT 13.1.4 showing symbol: @TY#.
Zig Retracement - Big and Small Moves. This chart was uploaded by Investor/RT 13.1.4 showing symbol: @TY#.
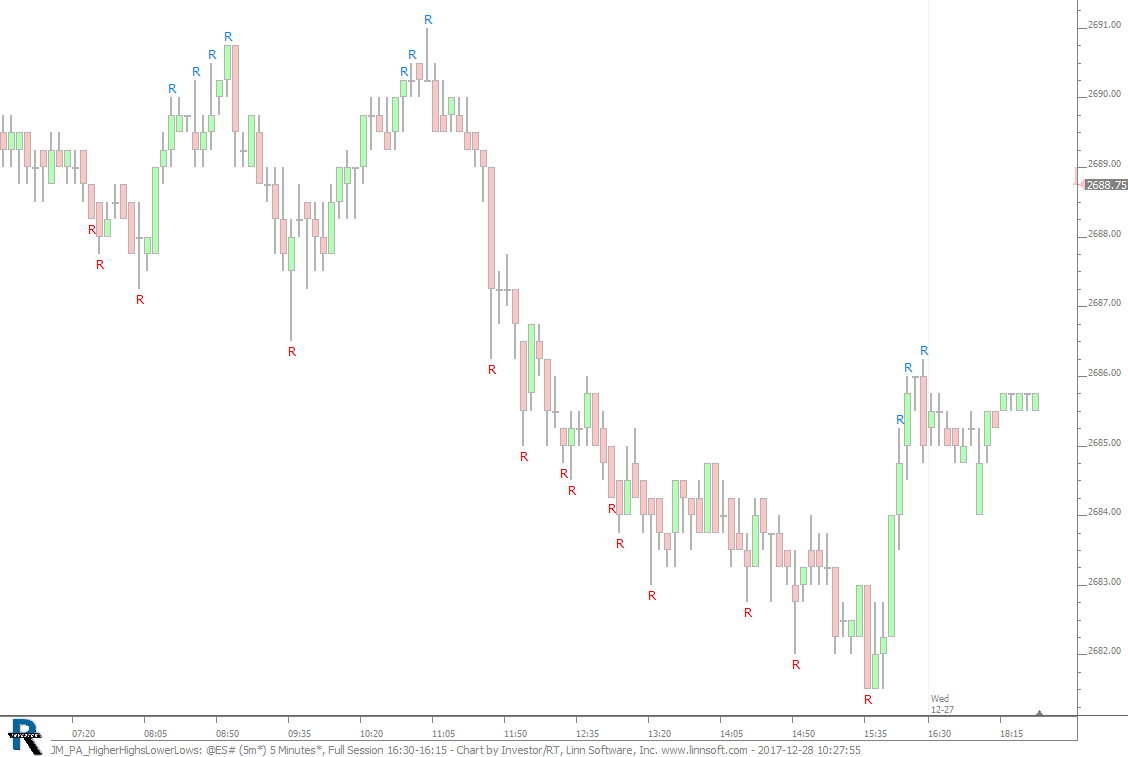
Higher Highs and Lower Lows (20 Bar). This chart was uploaded by Investor/RT 13.1.4 showing symbol: @ES#.
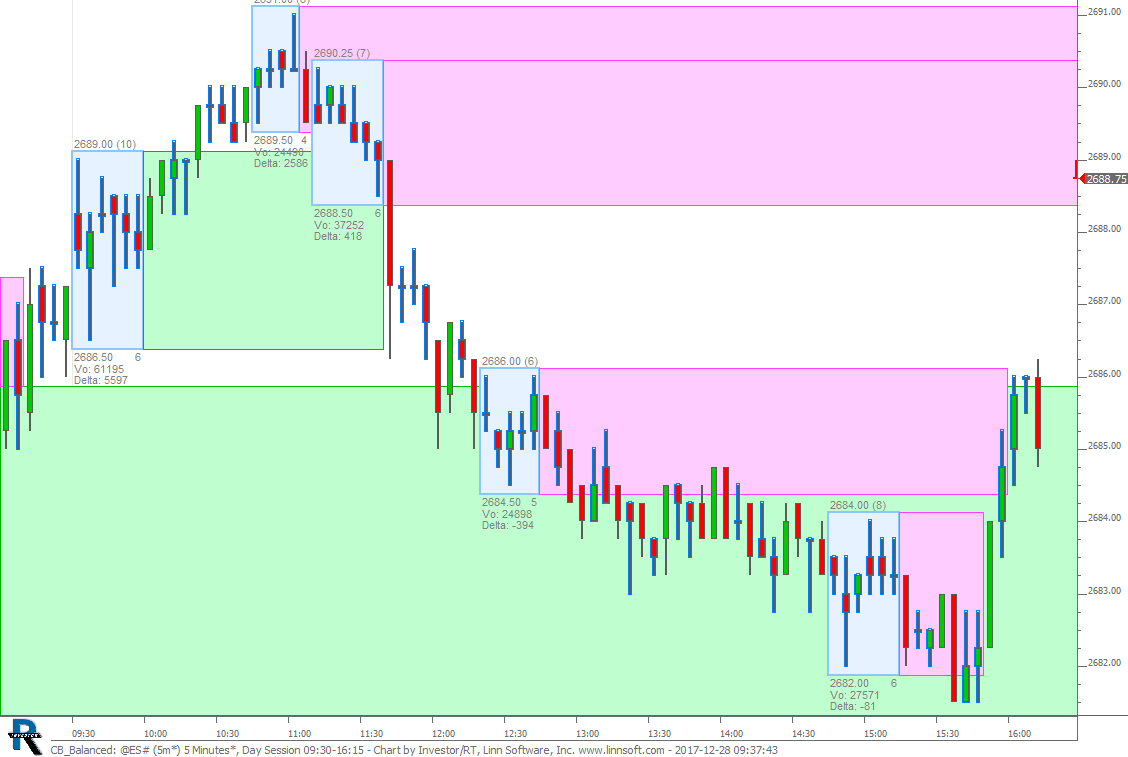
Balanced Candles. This chart was uploaded by Investor/RT 13.1.4 showing symbol: @ES#.
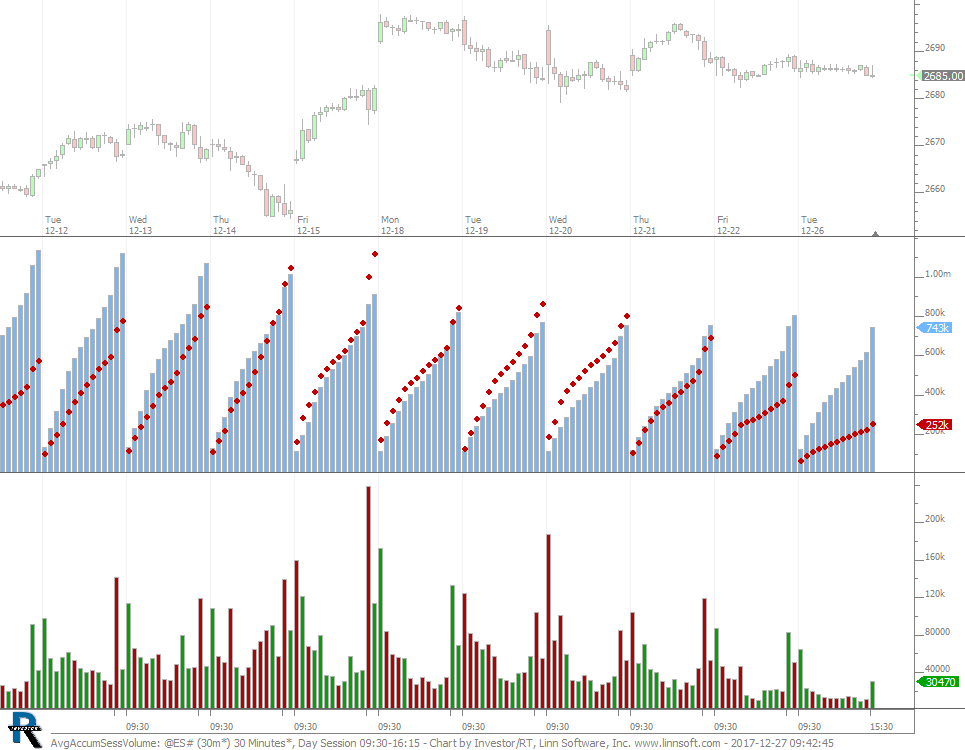
Average accumulated session volume. This chart was uploaded by Investor/RT 13.1.4 showing symbol: @ES#.
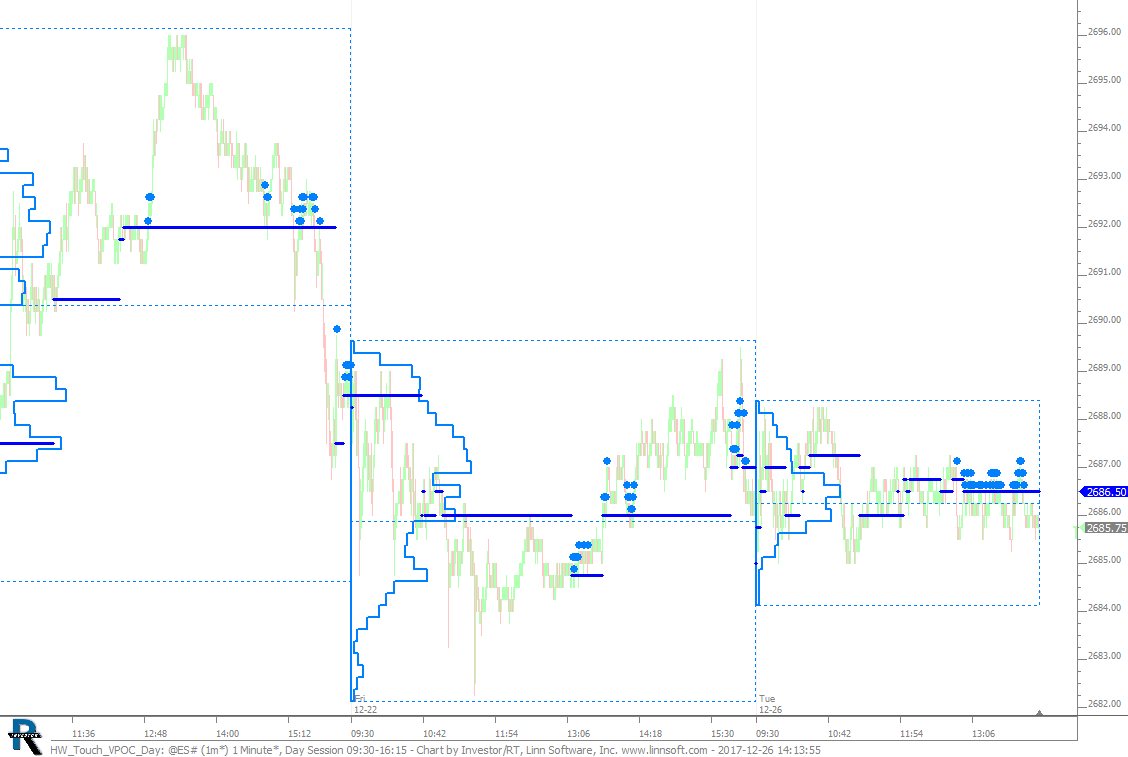
Touch VPOC after 200 Minutes. This chart was uploaded by Investor/RT 13.1.4 showing symbol: @ES#.
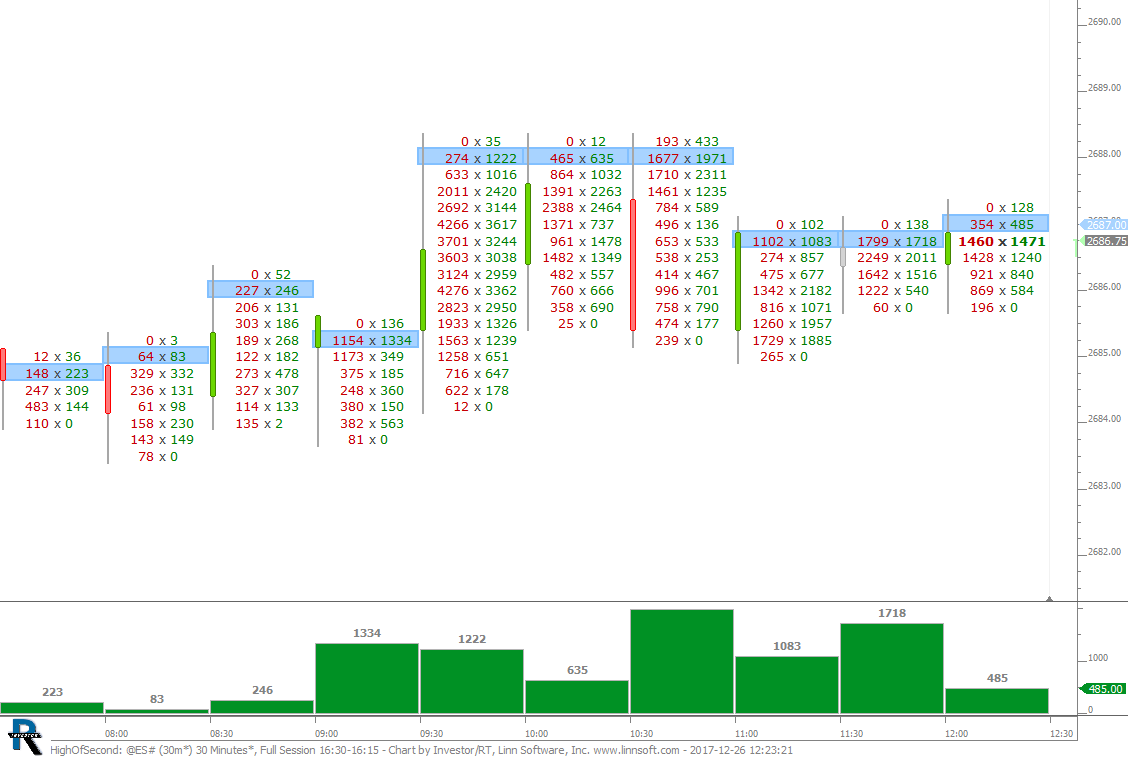
High Of Second Price. This chart was uploaded by Investor/RT 13.1.4 showing symbol: @ES#.
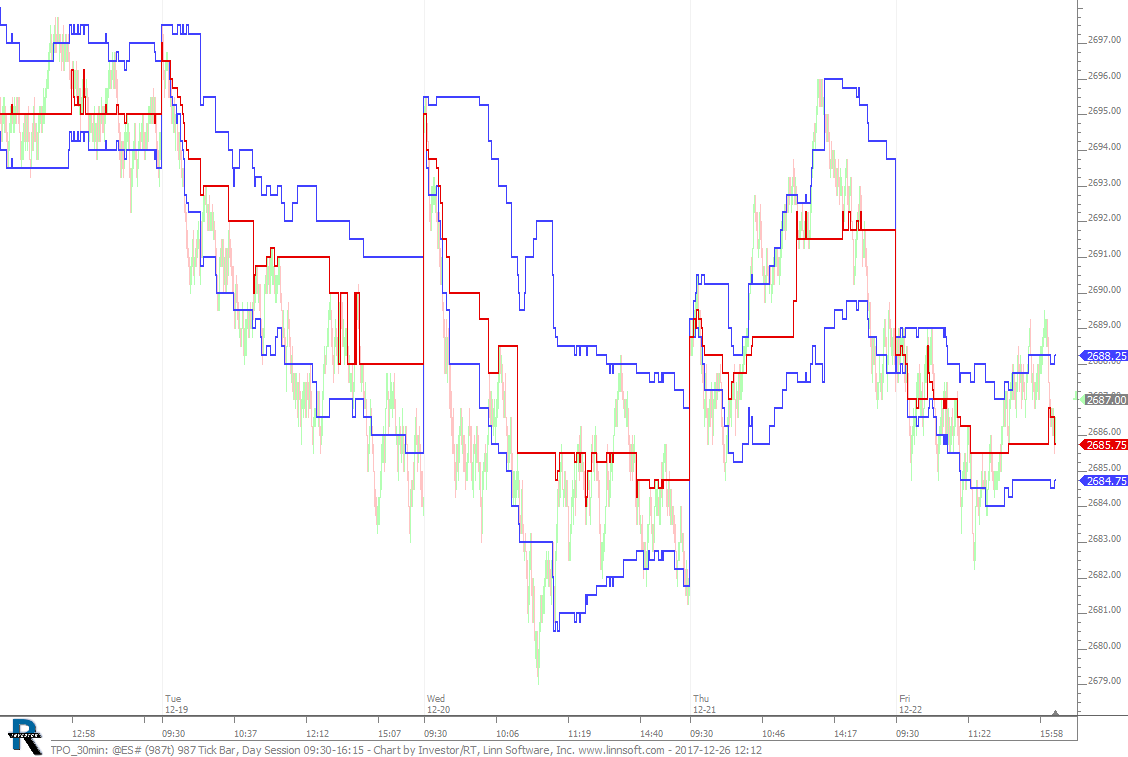
TPO 30 minute on 987 tickbars. This chart was uploaded by Investor/RT 13.1.4 showing symbol: @ES#.
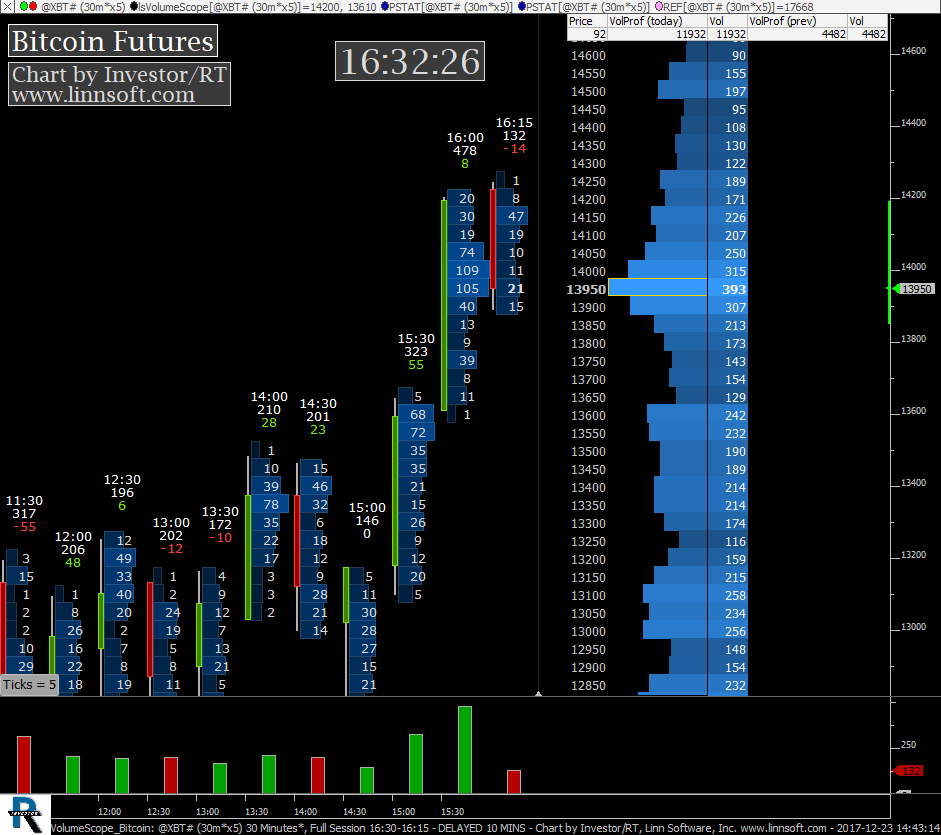
Bitcoin with VolumeScope®. This chart was uploaded by Investor/RT 13.1.4 showing symbol: @XBT#.
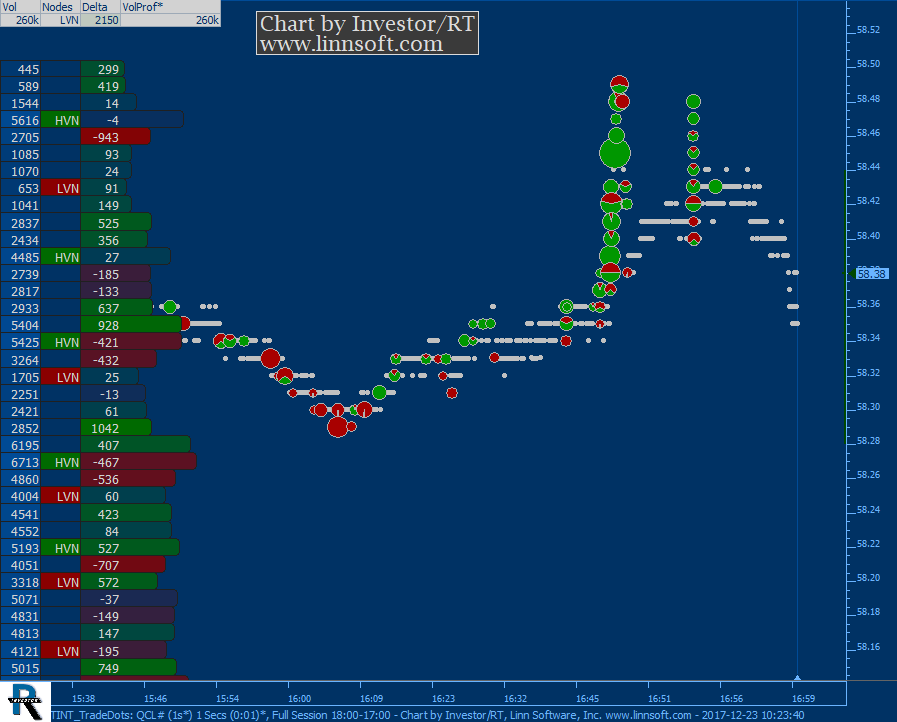
Trail of Intentions with Trade Dots. This chart was uploaded by Investor/RT 13.1.4 showing symbol: QCL#.
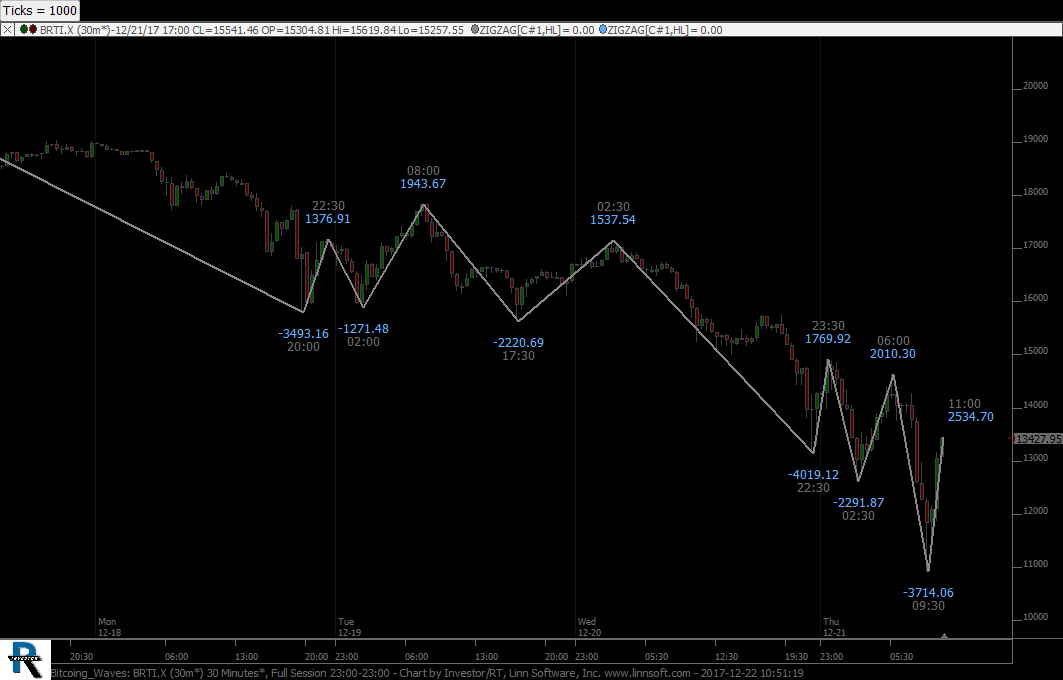
Bitcoin Waves. This chart was uploaded by Investor/RT 13.1.4 showing symbol: BRTI.X.