Duration:06:51
Variable speed version:
Watch
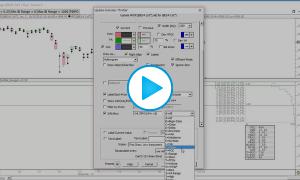
This video demonstrates how to implement a homework study which counts the number of times the day session high and low broke outside of the overnight session range, and present these values as a percentage of all days.
The chart computes the number of times price broke above ONH, below ONL, Both, and Either. This video highlights both the versatility of both the Signal Statistics, Session Statistics and MPD indicators
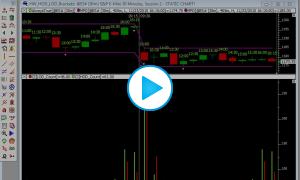
The following chart was used in the video.
Chart Reference
HW DayBreaksOvernight (@ES#)