WeeklyRangeVolumeStats (@ES#)
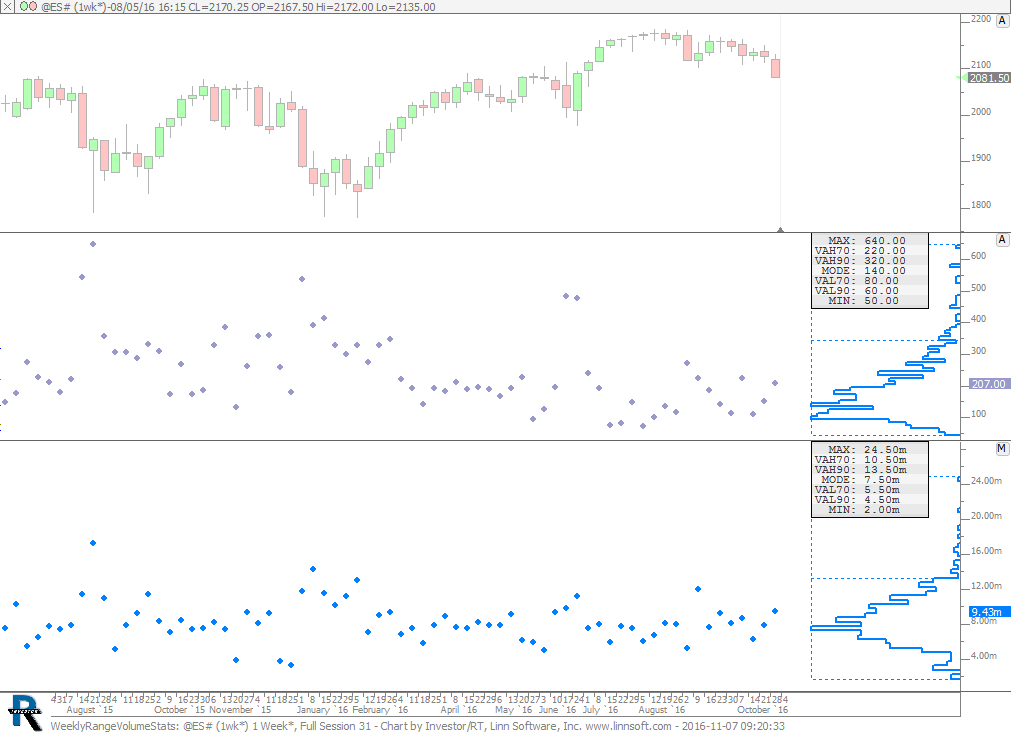
Weekly Range and Volume Statistics using Profile Indicator. This chart was uploaded by Investor/RT 12.6.8 showing symbol: @ES#.
Weekly Range and Volume Statistics using Profile Indicator. This chart was uploaded by Investor/RT 12.6.8 showing symbol: @ES#.
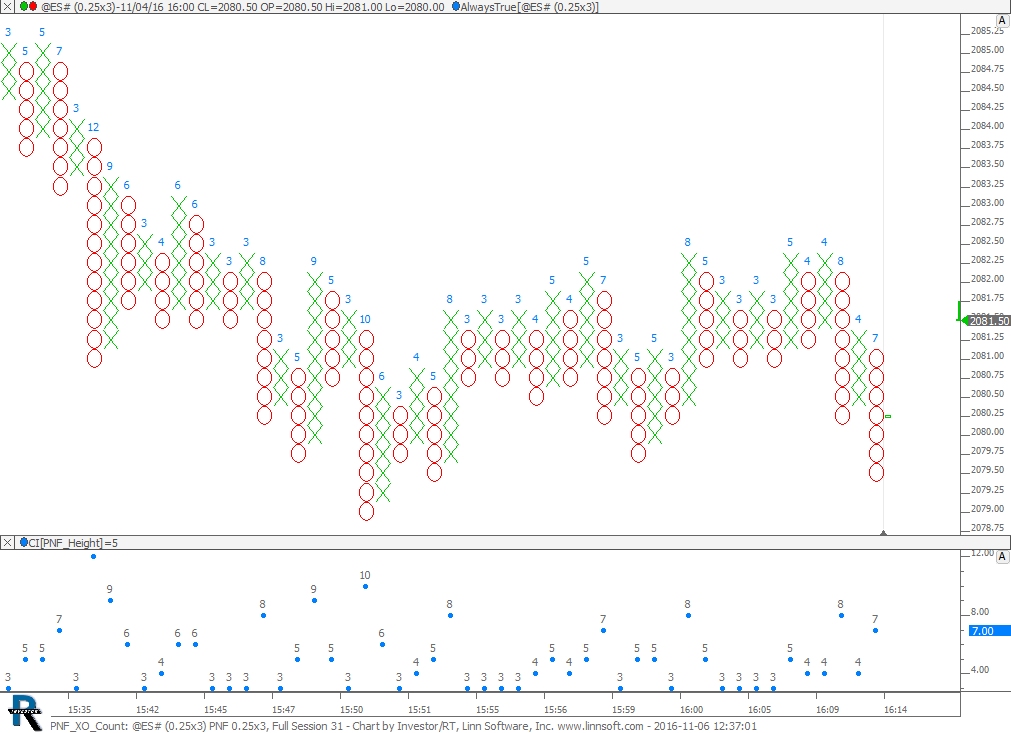
PNF Chart - Columns labeled with number of Xs or Os. This chart was uploaded by Investor/RT 12.6.7 showing symbol: @ES#.
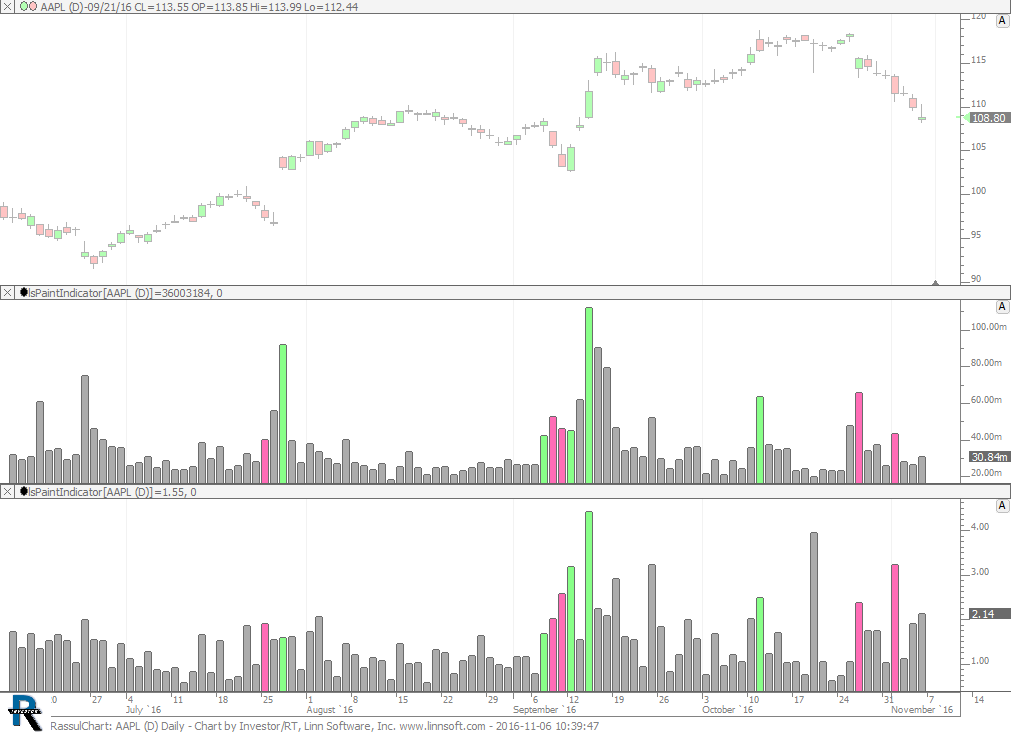
Range and Volume painted with PaintIndicator. This chart was uploaded by Investor/RT 12.6.7 showing symbol: AAPL.
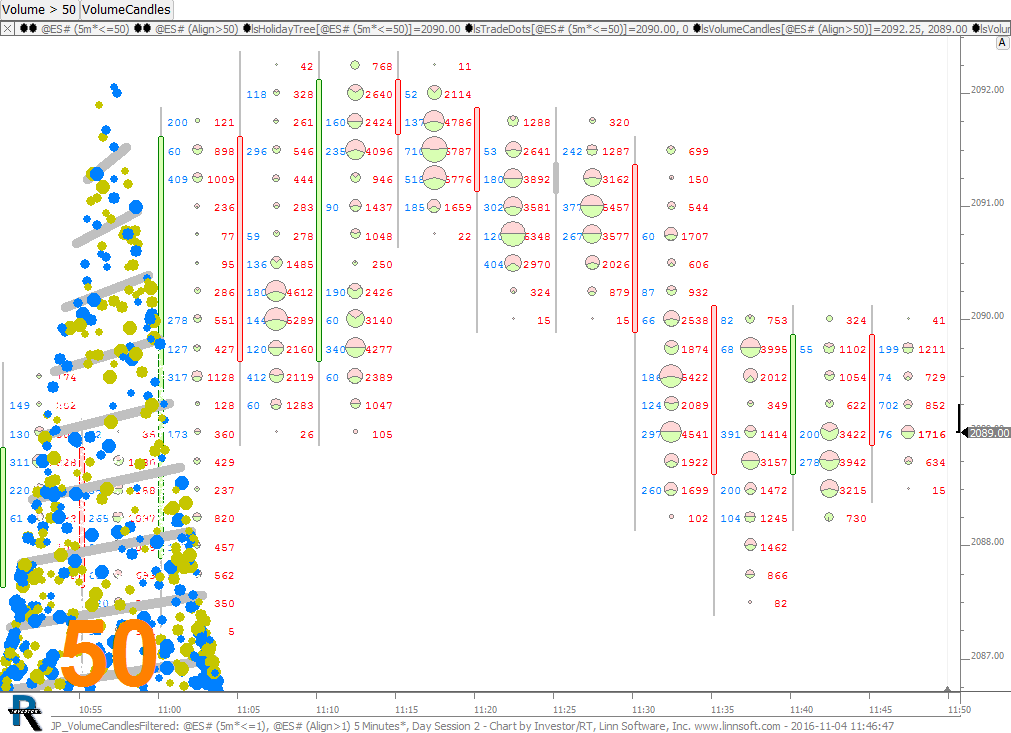
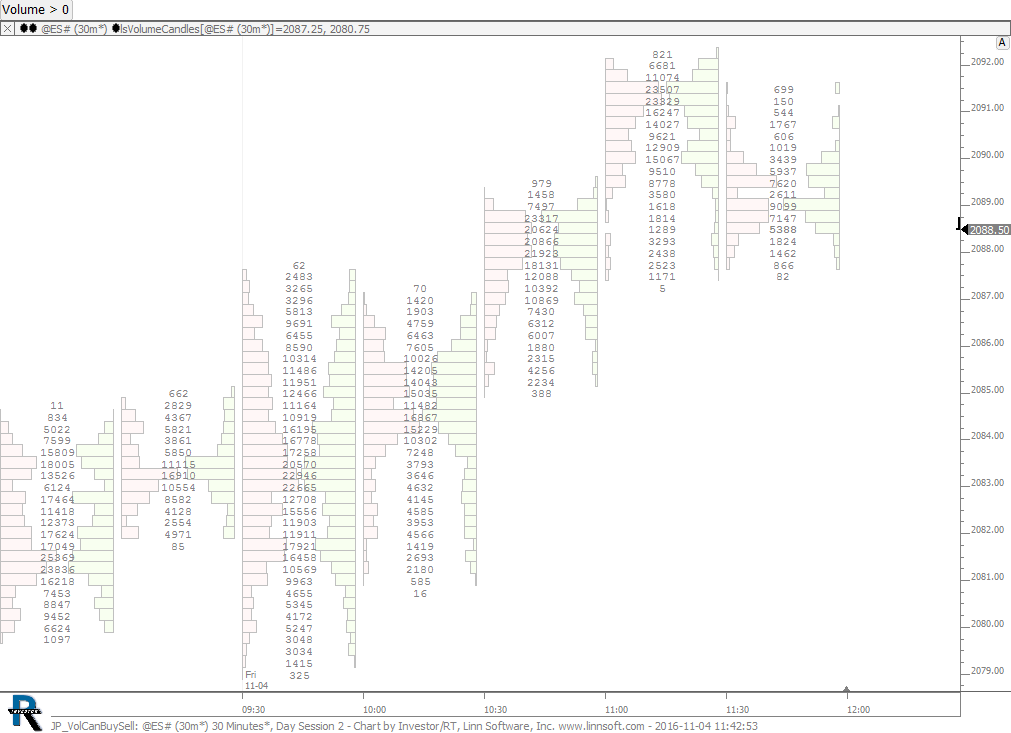
Volume Candles Filtered - With Holiday Tree. This chart was uploaded by Investor/RT 12.6.7 showing symbol: @ES#.

Session Prices. This chart was uploaded by Investor/RT 12.6.7 showing symbol: @ES#.
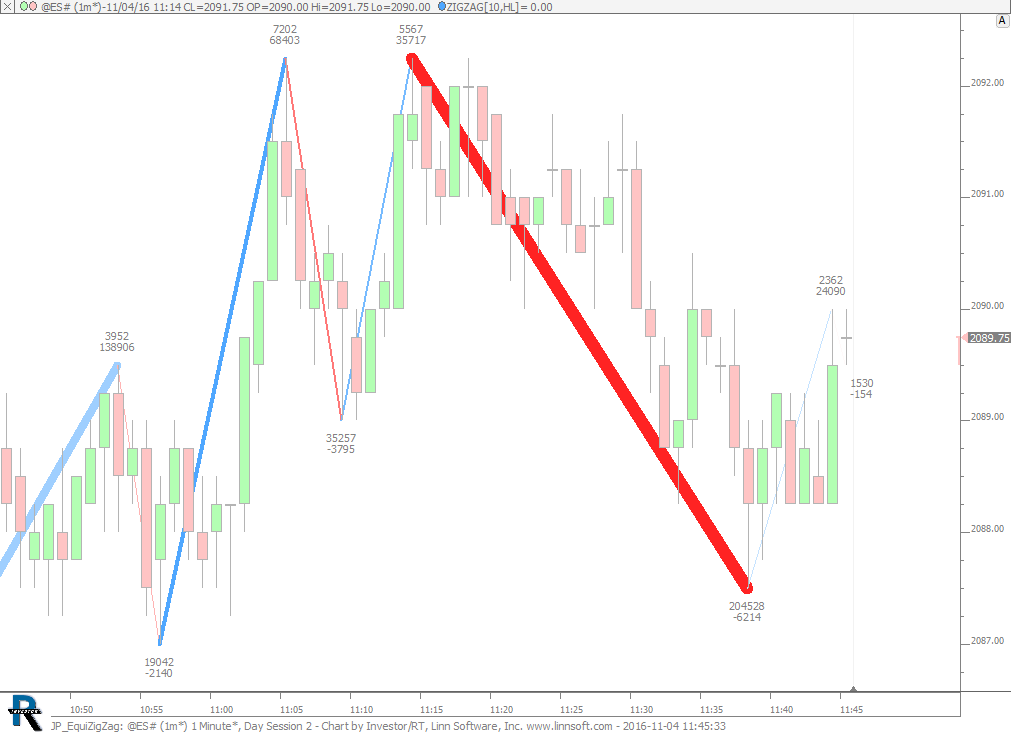
Equi Zig Zag. This chart was uploaded by Investor/RT 12.6.7 showing symbol: @ES#.
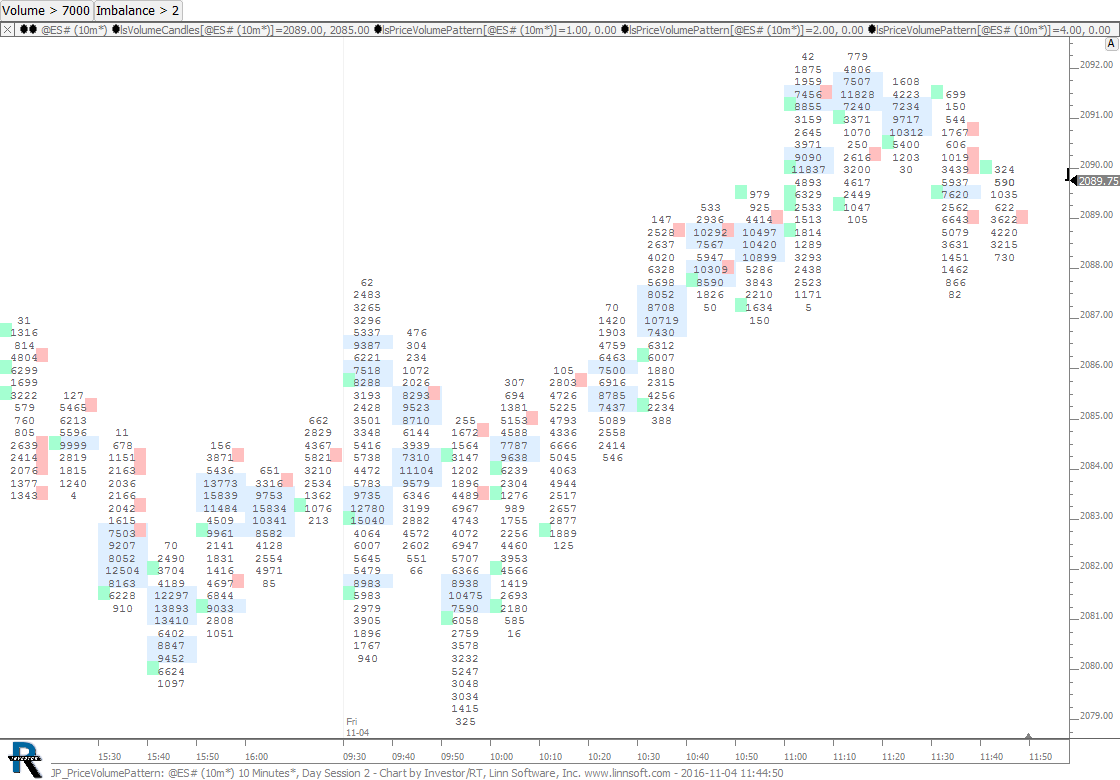
Price Volume Pattern. This chart was uploaded by Investor/RT 12.6.7 showing symbol: @ES#.
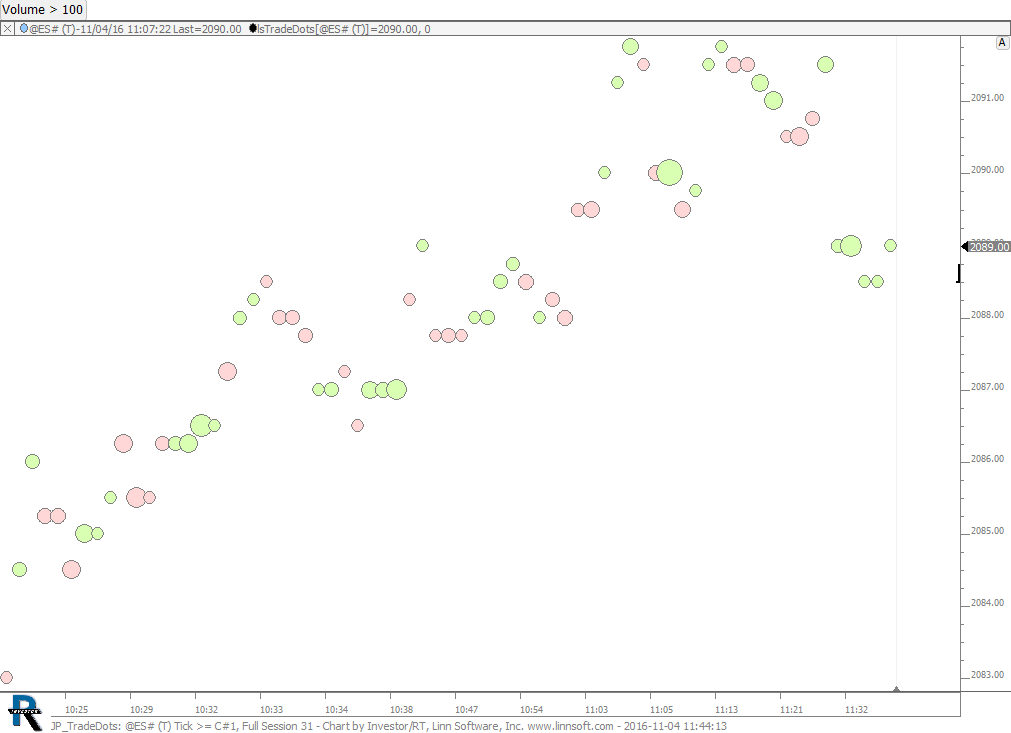
Trade Dots Filtered by Size (controlled by buton). This chart was uploaded by Investor/RT 12.6.7 showing symbol: @ES#.
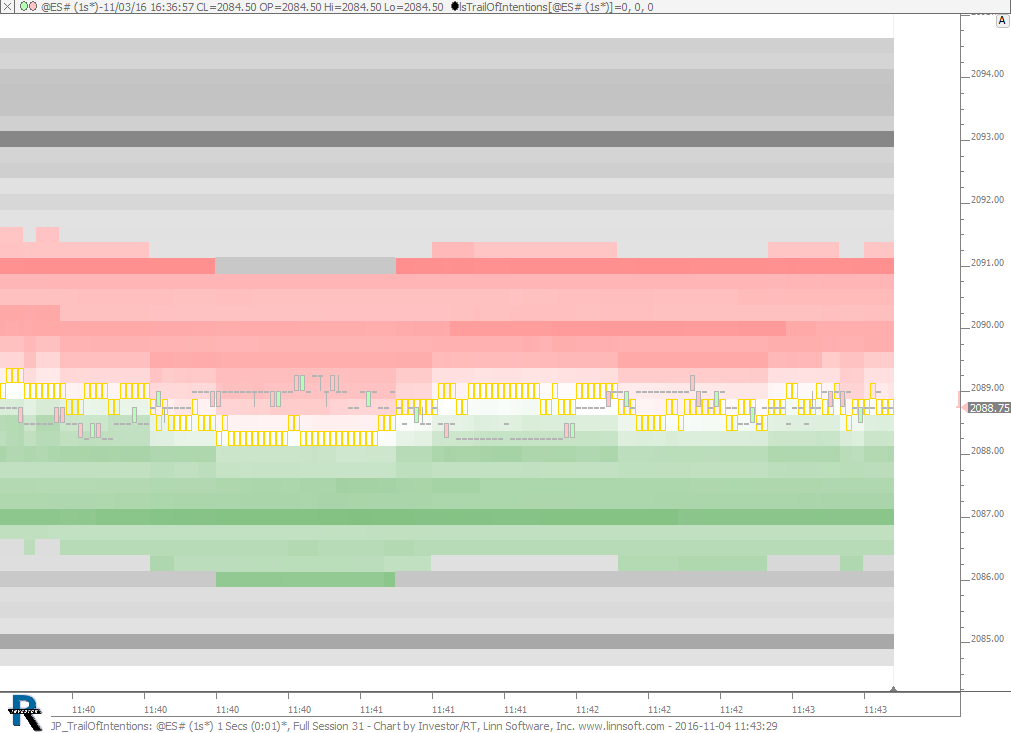
Trail of Intentions. This chart was uploaded by Investor/RT 12.6.7 showing symbol: @ES#.
Volume Candles Filtered by Volume. This chart was uploaded by Investor/RT 12.6.7 showing symbol: @ES#.