MeanReversionDaily (@ES#)
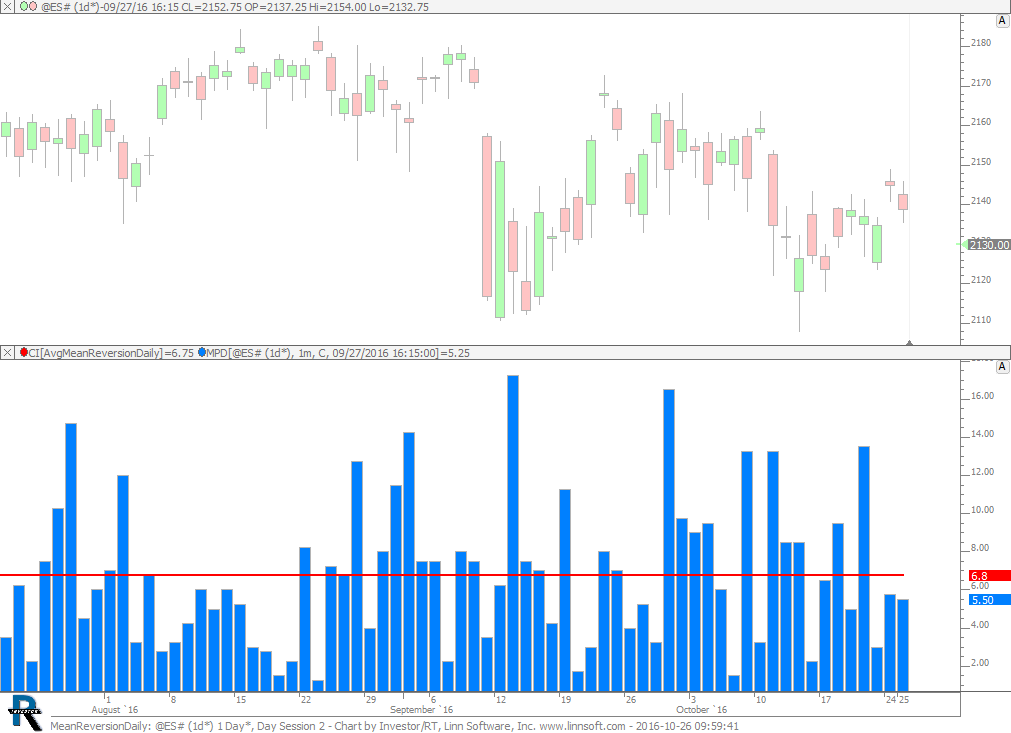
Mean Reversion - Daily. This chart was uploaded by Investor/RT 12.6.7 showing symbol: @ES#.
Mean Reversion - Daily. This chart was uploaded by Investor/RT 12.6.7 showing symbol: @ES#.
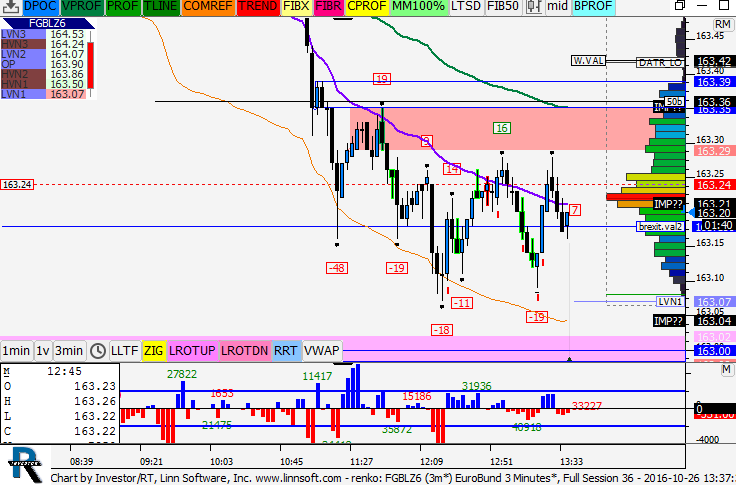
adeyf. This chart was uploaded by Investor/RT 12.6.7 showing symbol: FGBLZ6.
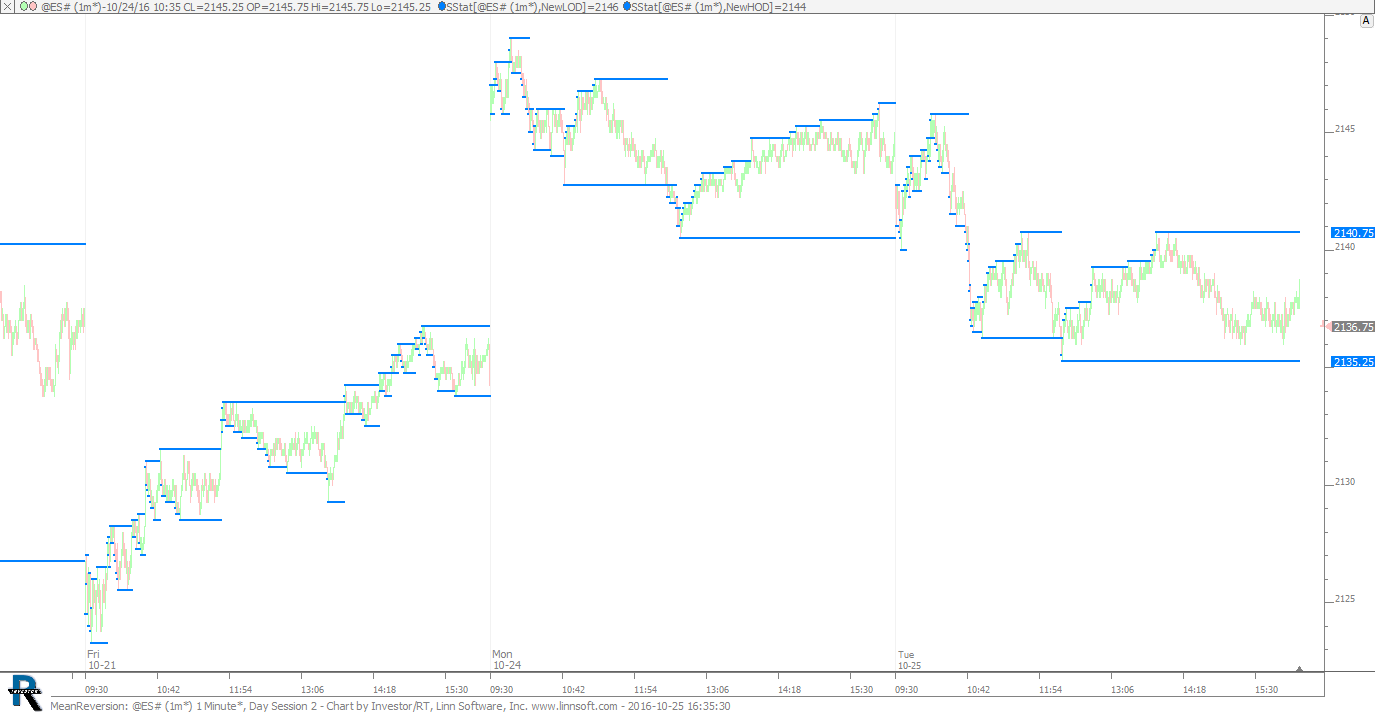
Mean Reversion. This chart was uploaded by Investor/RT 12.6.7 showing symbol: @ES#.
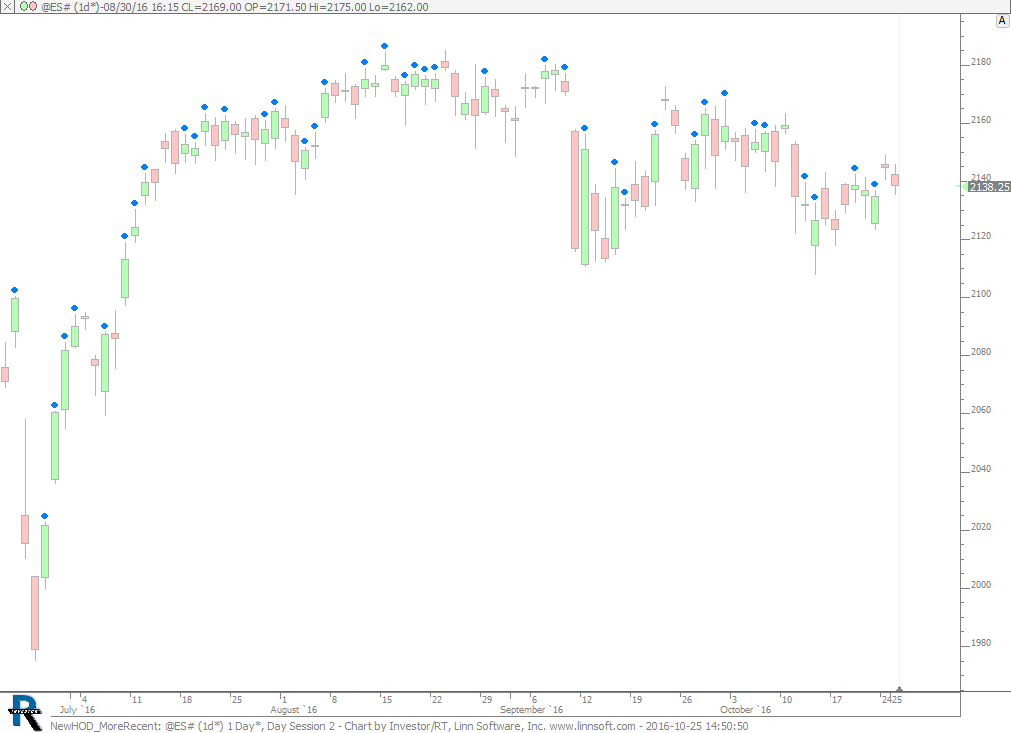
New HOD More Recent than New LOD. This chart was uploaded by Investor/RT 12.6.7 showing symbol: @ES#.
This chart was uploaded by Investor/RT 12.6.7 showing symbol: @ES#.
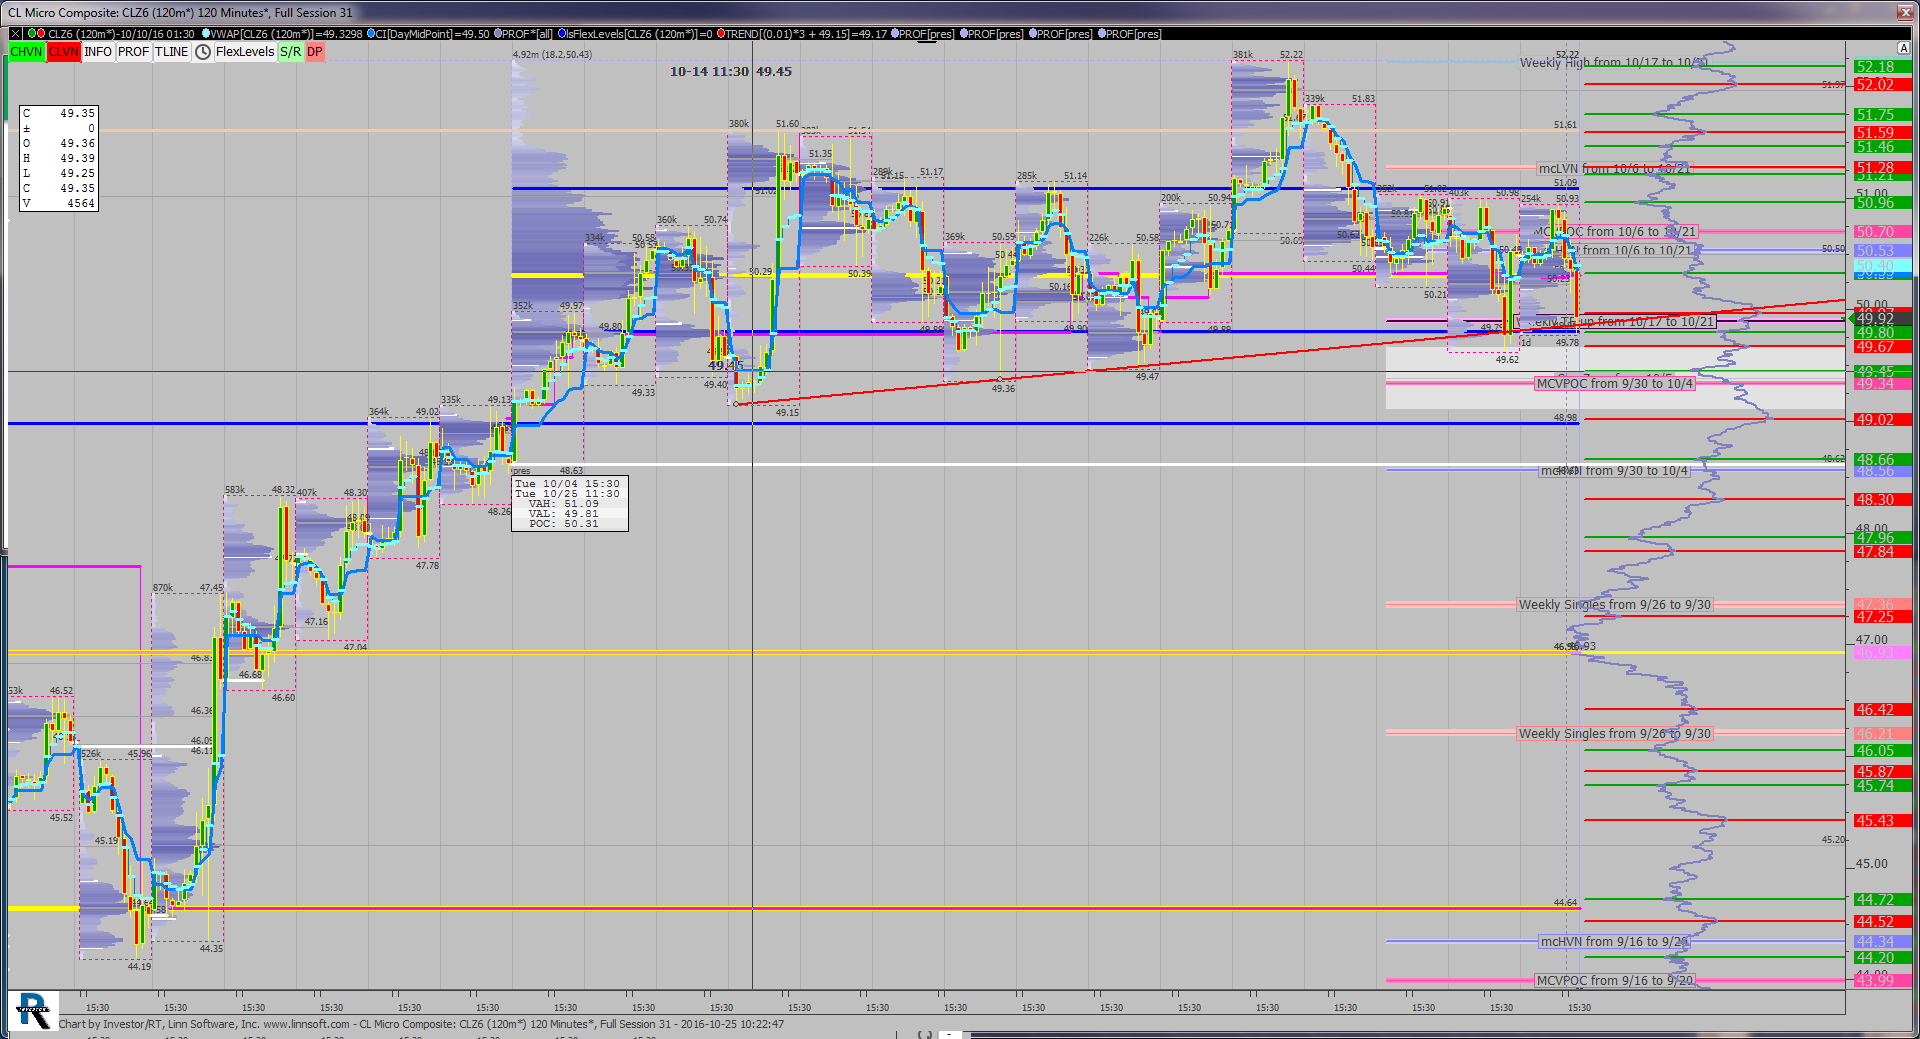
This chart was uploaded by Investor/RT 12.6.2 showing symbol: CLZ6.
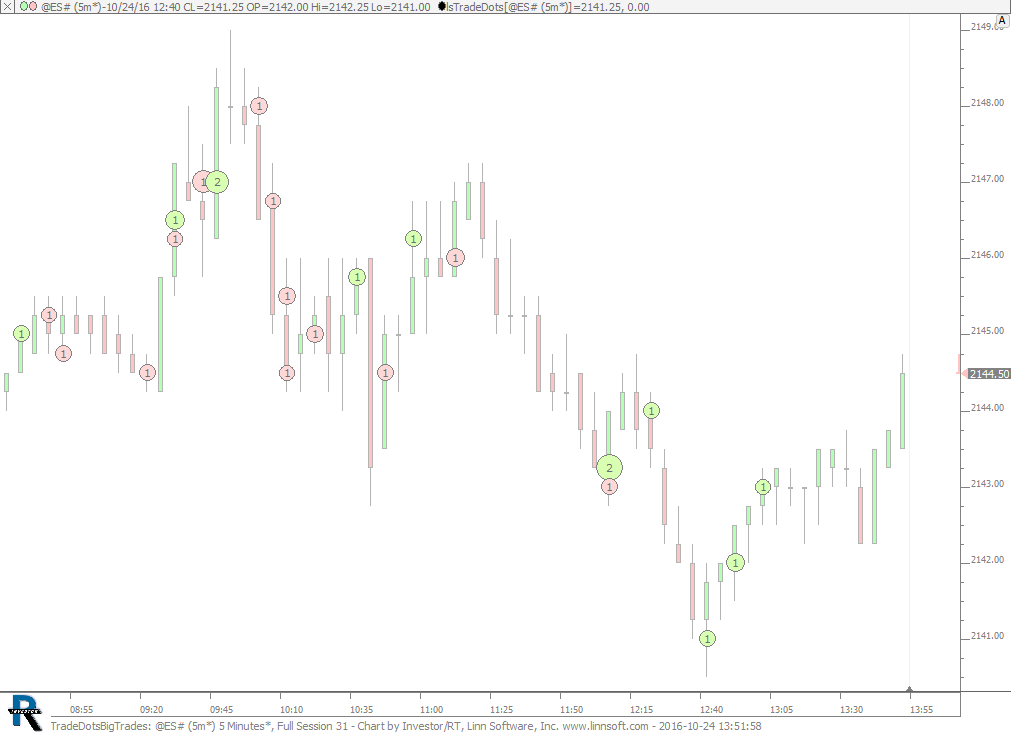
Trade Dots Highlighting Big Trades. This chart was uploaded by Investor/RT 12.6.7 showing symbol: @ES#.
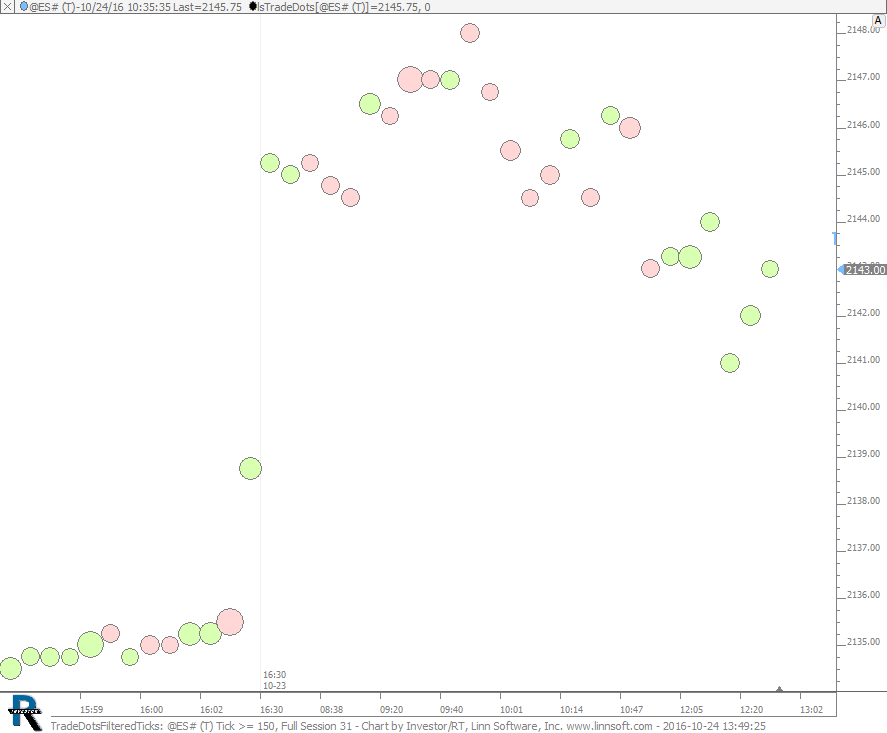
Trade Dots Filtered Ticks. This chart was uploaded by Investor/RT 12.6.7 showing symbol: @ES#.
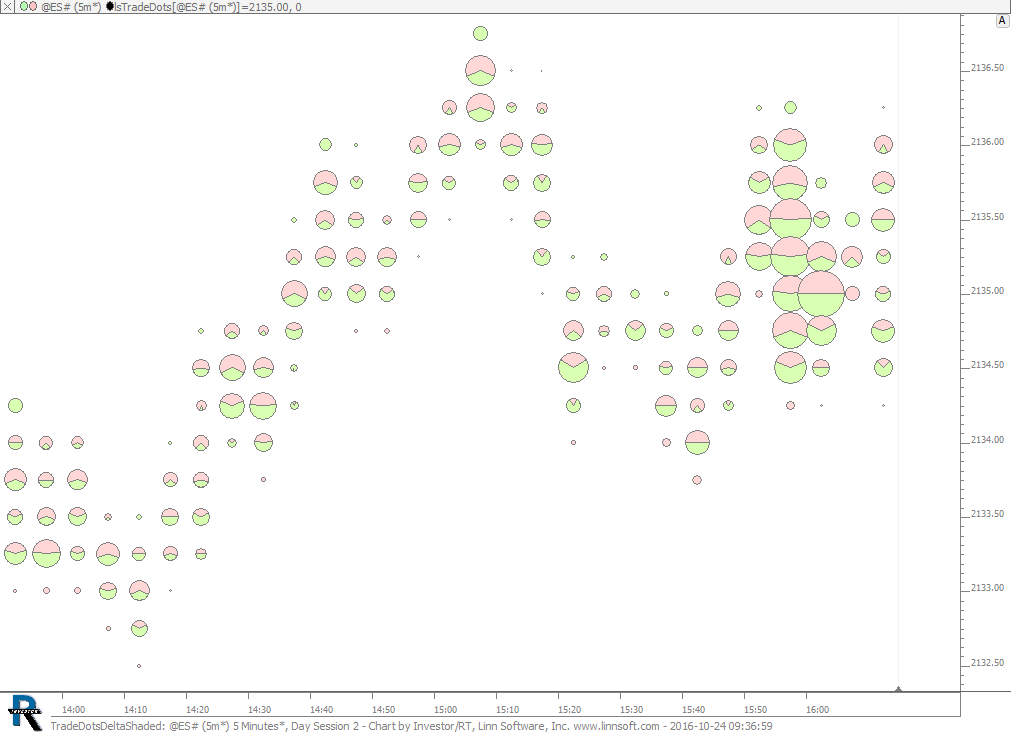
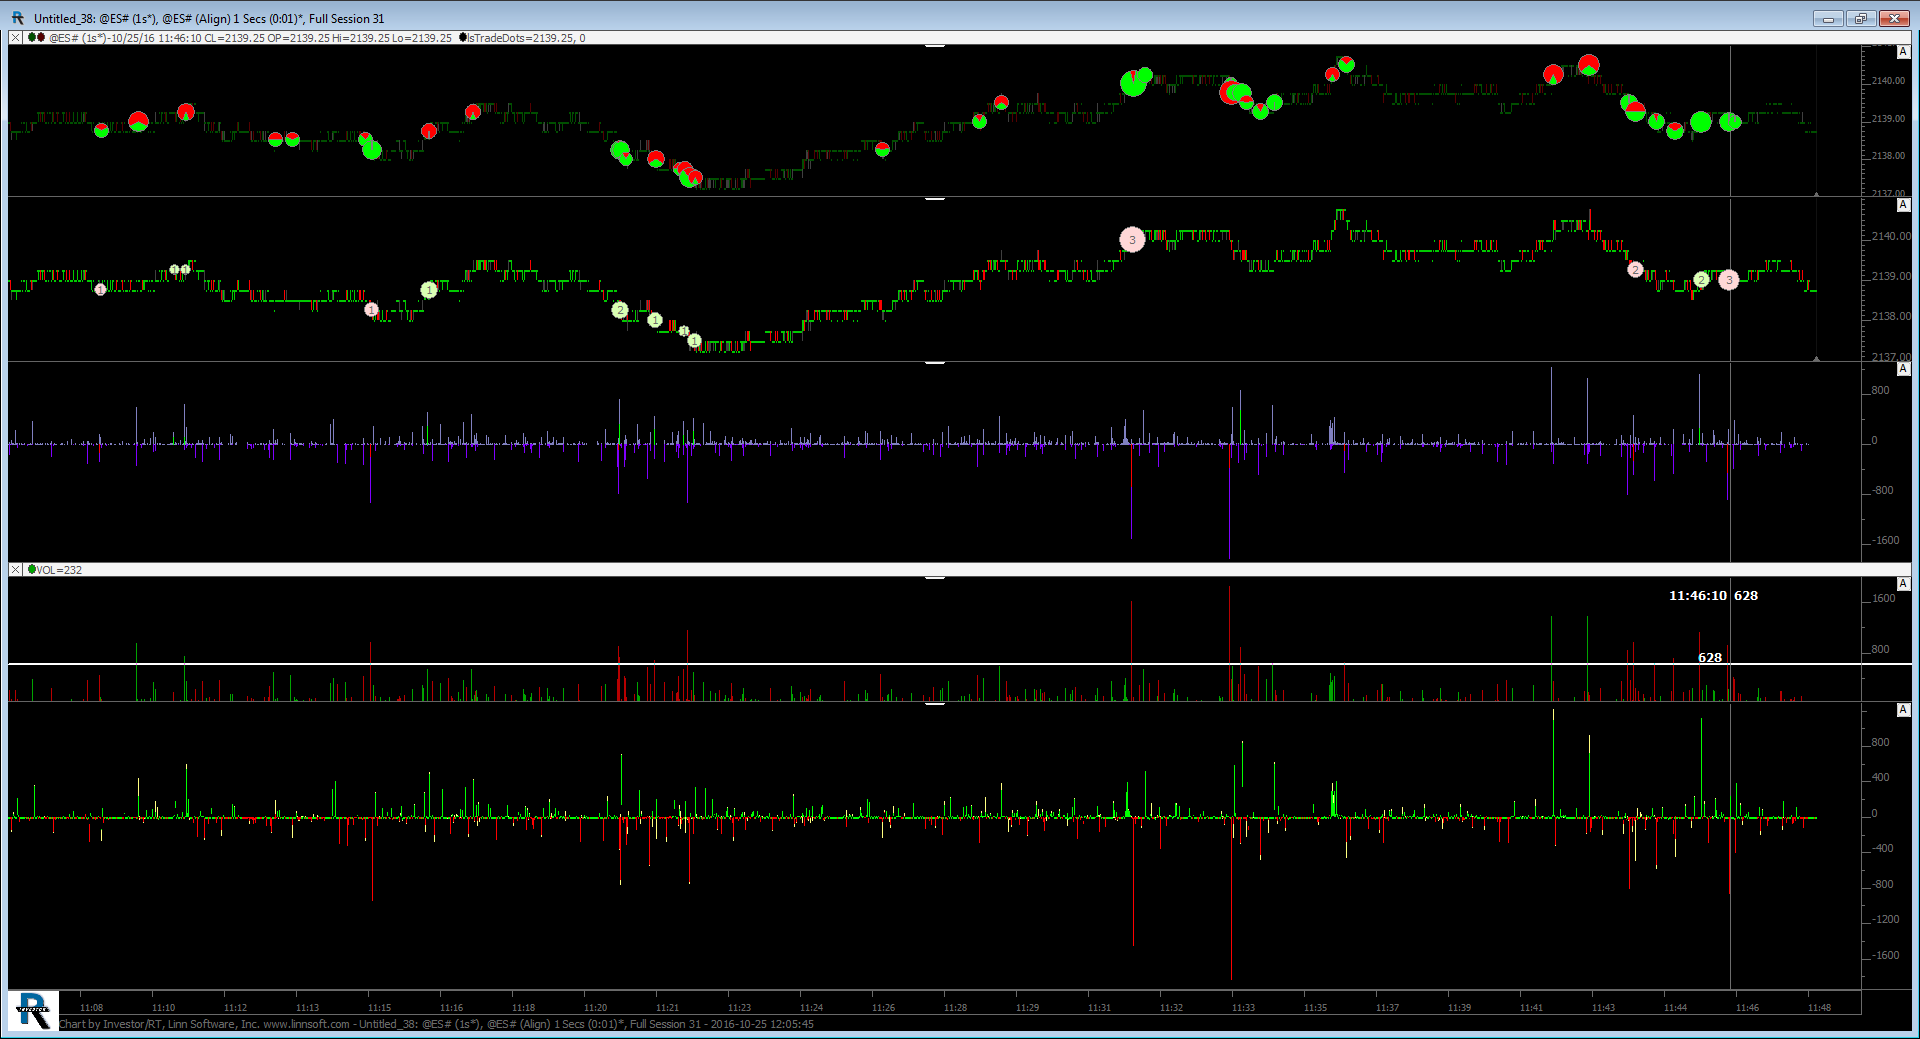
Trade Dots Delta Pie. This chart was uploaded by Investor/RT 12.6.7 showing symbol: @ES#.
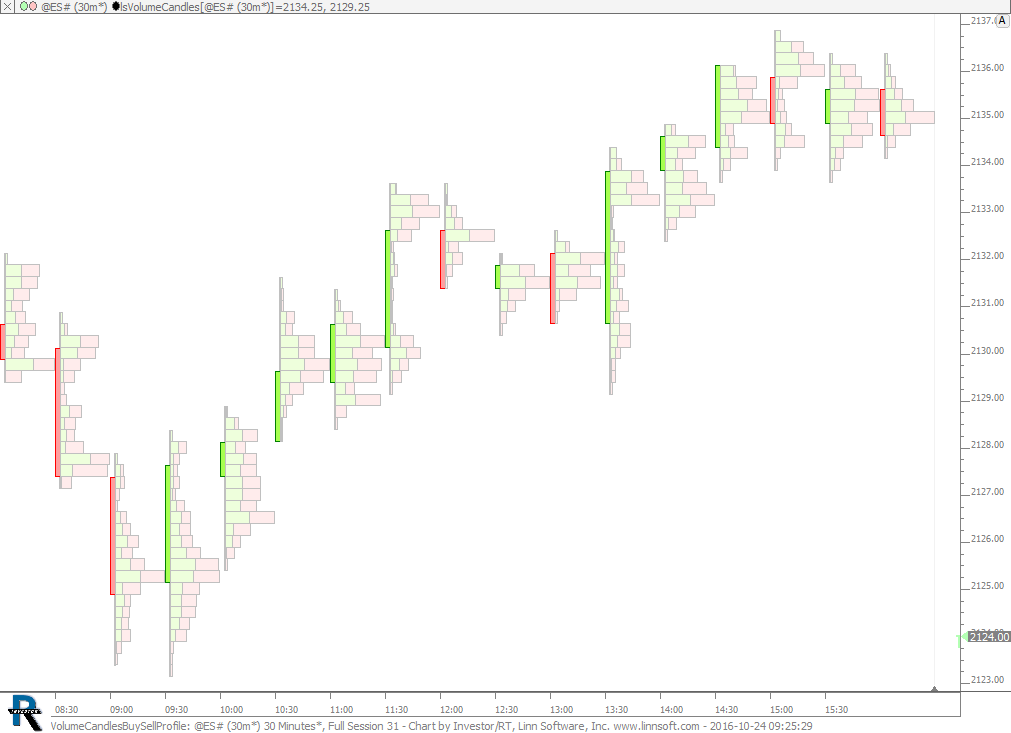
Volume Candles with Buy/Sell Profile. This chart was uploaded by Investor/RT 12.6.7 showing symbol: @ES#.