Hello,
I would like to configure my chart to display trade markers (dots) along the bottom axis, similar to the reference image provided. Could you please provide professional guidance or a step-by-step walkthrough on how to recreate this specific visualization within my platform?
Hello,
on a 1 second chart, to display a single "trade dots" on an horizontal line, there are 2 main options that comes in mind
First option : the vertical scale trick
This is the simplest one by far, even if this is not the one used in your screenshot (but final result is exactly the same)
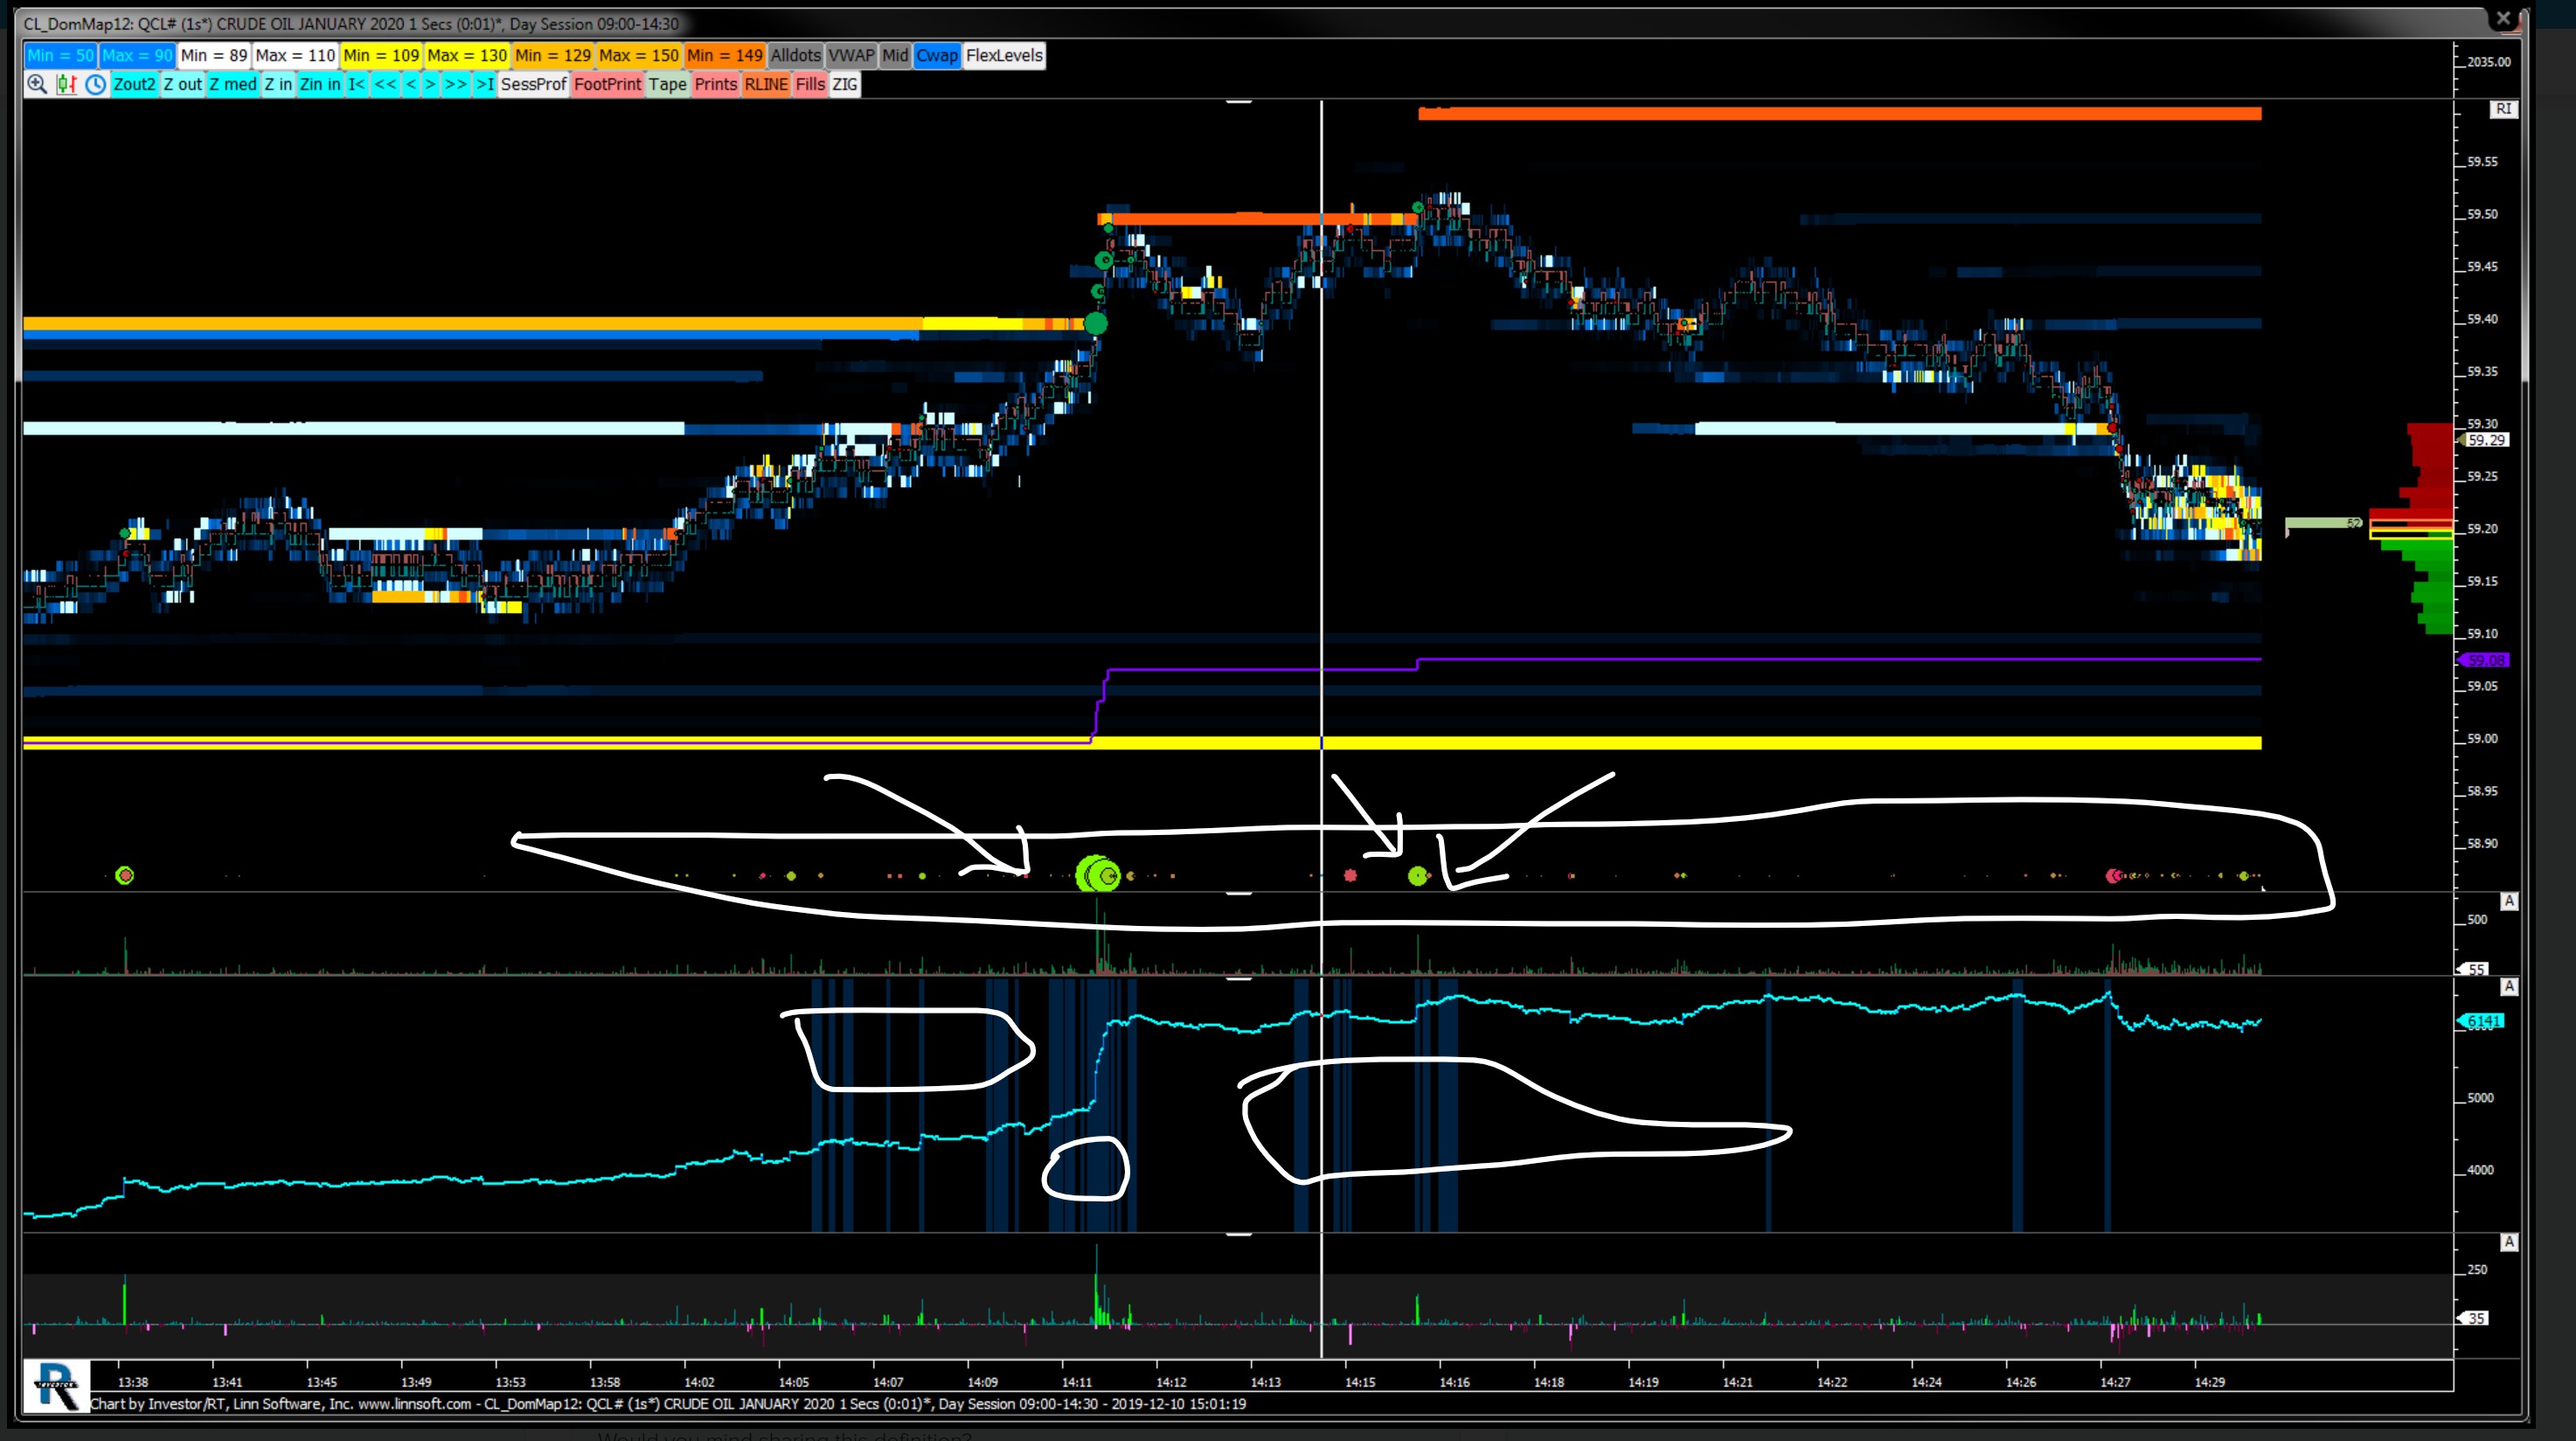
Step 1: Add the Trade Dots indicator with the following settings on a new pane
you might want to adjust the %width anywhere from 100 to 500% for the max dot size paramater
2) double click on the pane vertical size and select a very wide manual scale for that particular pane such as -100000 to 100000
Finally, just reduce the height of the pane, right click on the pane title, drag and drop the pane just below the main instrument pane, and then hide the pane title. This will do the trick
Second Option: the custom instrument trick (possibly the one used in your screenshot)
This is a bit more complicated, as you need to go through
a) the creation of a custom instrument that will duplicate an ES instrument, but force it to have a fixed price based on a V# variable (let's say V#55). However, that fake ES instrument will still have the same total/buy/sell volume, ie the same delta per bar, even if its price is constant (as the bid/ask value of every tick of such a custom instrument will be derived from the original instrument)
b) use a set V# button (asscoiated to the main ES instrument, ie @ES# in my case) to control the fixed horizontal price (ie V#55)
Push on the button to introduce a V#55 price corresponding to your current low scale value
c) add the custom instrument as a second instrument on the chart main instrument pane (select an invisible drawing style)
d) add the Trade Dots indicator (with the same settings as in the option 1), BUT associate it with the custom instrument (ES FIX) and select the main instrument pane as target (see bottom right corner)
You will get the same exact display as in option 1, but you need to adjust V#55 from time to time to follow the overall ES price action (and that change won't be retroactive)
Eddy