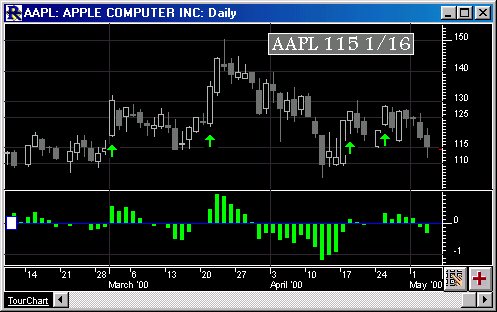
Core Indicator

Paint Candles (RTX)

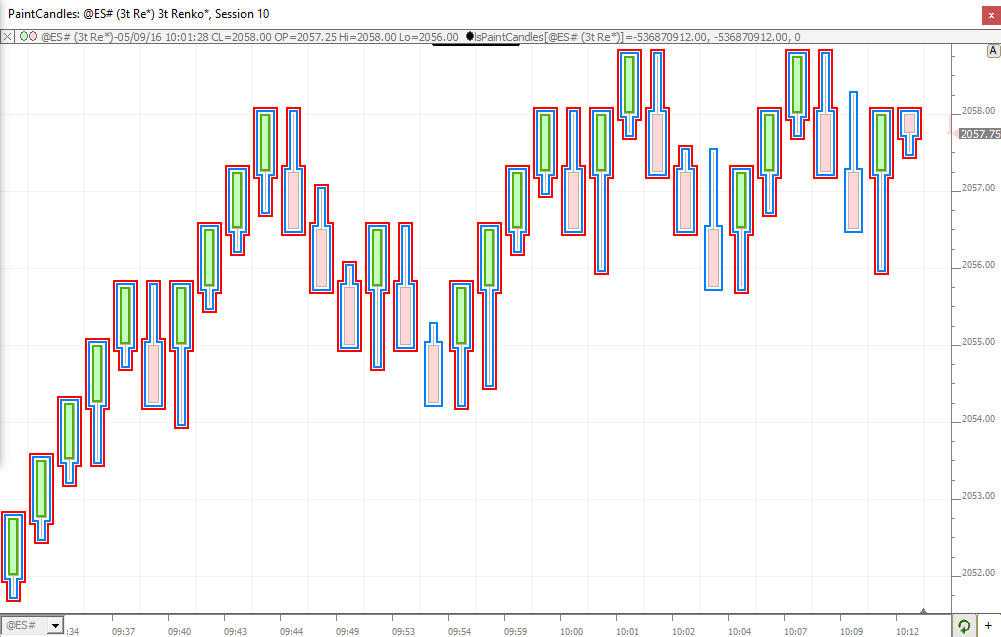
The PaintCandles RTX Extension decorates candlesticks in a variety of ways. The user may choose to decorate all candles or just those candles that meet a specific condition determined by an RTL Signal . Decoration options include the width in pixels, the Position relative to the candle (in pixels offset from candle) and whether to draw inside or outside of the candle.  Up to 4 painting options are available in each instance of PaintCandles, one to decorate all candles and three options to decorate candles based on an RTL Signal being true for that candle (bar).

ScatterPlot (RTX)

ScatterPlot takes two custom indicators and plots one on the horizontal (X Axis) and one on the vertical (Y Axis) and then computes a best fit polynomial regression line through the data of user-specified degree. Any two custom indicators may be used for the data set of this analysis. Each data point represents the values of the two custom indicators on any given bar. Each bar is drawn as a point/dot in the scatter plot. For example, the indicator can plot the daily volume versus the daily range in price.

Trading Rule Indicator

The Trading Rule Indicator operating inside a chart tests a user-specified trading signal. When the trading signal fires true, the trading rule indicator executes a user-specified trading order.

Chart Buttons

Chart Buttons enable you to add push buttons or menu buttons to any chart window to perform a variety of actions as shown in the image below. Buttons can be added to any pane of any chart just as you would add any indicator. If you have a series of button indicators that you wish to appear in every chart, set the scope of the button to "All Charts, Any Instrument" at the bottom of the Button Preferences window. From that point forward, any chart you open or create in the future will have the these ticker and periodicity buttons.

Zig Zag Oscillator Indicator (ZZO)

The Zig Zag Oscillator indicator provides a way of viewing the Zig Zag Indicator information in a different form. Through the years, the Zigzag oscillator has become one of the most versatile indicators of the whole Investor/RT unique toolkit when it comes to analyse waves and identify market conditions.

Zig Zag Indicator (ZIG)

The Zig Zag Indicator is a series of trendlines that connect significant tops and bottoms on a price chart. The Minimum Price Change parameter specifies the percentage that the price must move to form a new zig or zag leg. It can be used to identify potential chart patterns and Elliot Wave formations.

Signal Statistics (SSTAT)

The Signal Statistics indicator (SSTAT) allows for statistical calculations on signals, including summation, consecutive signals, frequency, bars since last signal, change since last signal, and more. SSTAT allows the user to select any existing scan or signal, and any custom statistical result to calculate on that scan/signal. Currently, the available statistical results are:

Session Statistics (SESST)

The Session Statistics Indicator computes historical statistics for an instrument or an indicator. The The Session Statistics preferences use the general format: [Statistic] of [Price] of the [First/Last] X [Minutes/Bars] of the Session The Statistic options include:

Signal Markers

The Signal Marker indicator tests a user specified RTL signal or a specified Plugin Indicator that produces a signal using the periodic data in the chart. The purpose of the indicator is to mark all of the bars for which the signal is true. The signal marker setup can also perscribe a particular signal action to be executed when the signal fires true on the current bar forming in real-time. Signal Actions can in turn trigger the execution of a Trading Order and many other alert actions.

Position Indicator (POS)

The Position indicator is a versatile indicator: it calculates various output results related to the position of the bar with regards to multiple references such as session start or end (the calculated position can be expressed in bars, minutes, or seconds from the start or end of the trading session) or various calendar references (day/week/month/quarter/year).

It is primarily used through the POS token in the RTL syntax of filter rules within signal or custom indicators. Some outputs are also dedicated to being used inside SCAN or backtesting rules

Pages