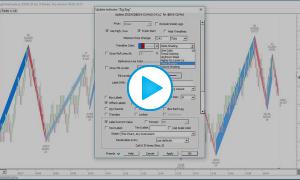
1) Price related inputs
Price: Price used as input for the calculations (Close, (High+ Low)/2, etc.). These options appear when the default use "high/low" checkbox is not selected.
Exclude Inside Legs: When checked, this option forces "inside legs" to get gobbled up by the outside legs. Inside legs are back to back legs which are completely within the leg which proceeds them.
Fresh Start:When checked, this option forces to start a new zigzag line at the first bar of each session using the relevant price input (ie high/low price). If you want to attach the starting point of the zigzag line to the open of the first bar of the session, you need to set the configuration variable ZigFreshStartUseOpen to True (this is a global option that will then apply to all zigzag lines with the "fresh start" option checked).
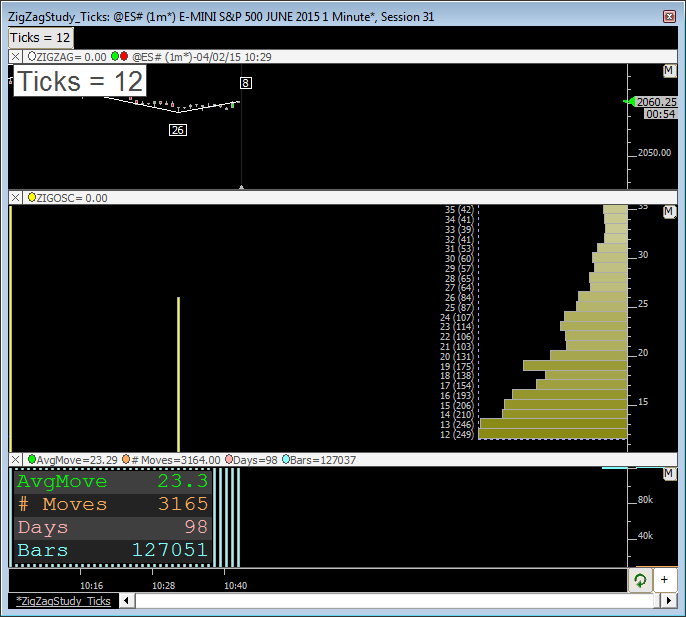
Minimum Price Change -This is the minimum distance price must move in order to confirm a new leg of the Zig Zag. Minimum Price Change can be specified in units of %, $, Bars, Ticks, or Fractals as detailed below (knowing input values can be introduced as a C# or V# variables)
-
Percentage uses a percent of current price for the minimum move.
-
The $ choice allows users to specify price or points for the minimum move.
-
Ticks is very similar to $ but specified in the number of tick increments that price must move instead of point move ($).
-
Bars : When "Minimum Change" is specified in "Bars" (20 bars for instance), this does not mean that each leg will be 20 bars in length. Instead, it uses the bar count in respect to new highs and lows. If the last leg was downward, then only a bar with a high greater than the high of the previous 20 bars can establish a new pivot and a new upward leg. Once that upward leg is established, only a bar with a low that is less than the lowest low of the previous 20 bars can establish a new pivot and a new downward leg. After establishing a downward leg, if we encounter a bar with a lower low than our pivot bar, that bar replaces the pivot for the downward leg (just like "$" and "%" currently work). This "Bar" method allows the volatility of the market to power the Zig Zag instead of requiring the user to supply a specific $ or % value. The "Bar" method should also translate well among various instruments and security types;
-
Fractals When this option is chosen, the user specifies the number of Fractal bars to use and the Zig Zag will compute the pivots just as it would a Fractal indicator with the same bar settings and "Alternate High Low" checked (as Zig Zag must alternate between high/low). Providing this option allows users to label their Fractal Markers with the wealth of options available for labeling Zig Zag pivots. To use a Zig Zag in combination with a Fractal in same pane, set the Zig Zag label to an offset of at least 1 to move the labels outside the Fractal markers. Finally, you may filter the fractal bars (used as pivot) upon a minimum price change criteria (indicated in ticks), i.e. a legitimate fractal bar won't be considered if the corresponding zigzag move is less than X ticks. This is a very efficient way to remove noise, i.e. skip non relevant fractal bars.
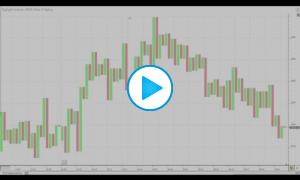
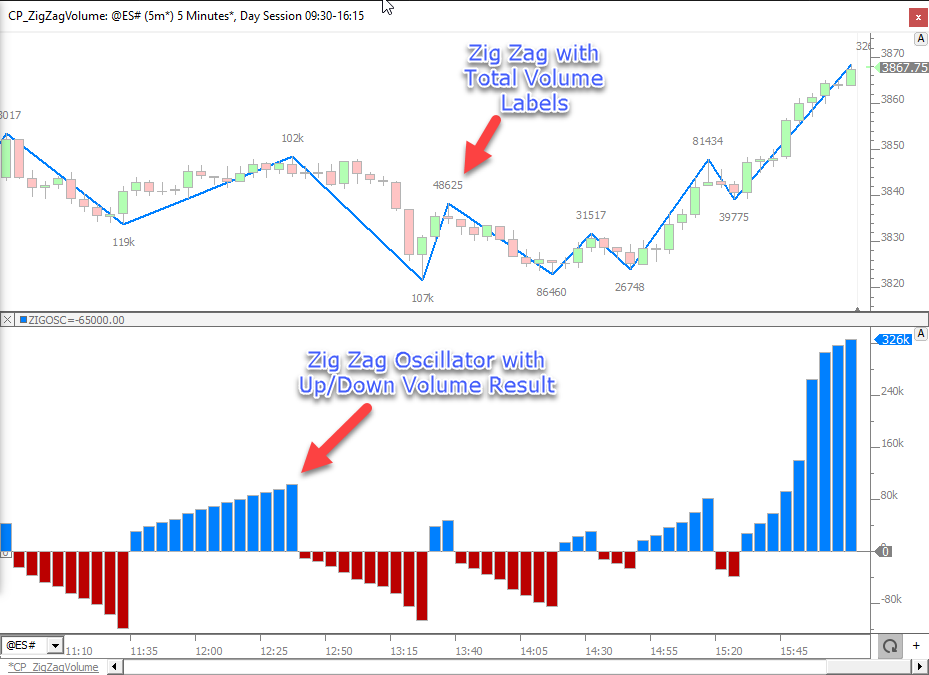
2) Zigzag line display options
Here are the main Zigzag line coloring options (other than the straight forward "one color" and "up/down slope")
-
Trend coloring : When seledted, each leg of the Zig Zag will be colored green when in an uptrend and red when in a downtrend. When in an uptrend, our state can only be reversed to a downtrend by a downward leg whose pivot low is lower than the previous downward leg pivot (a lower low). When in a downtrend, our state can only be reversed to an uptrend by an upward leg whose pivot high is higher than the high of the previous upward leg pivot (a higher high). This coloring options gives the user visual feedback to reflect whether the instrument is in an upward or downward trend.
-
Higher High / Lower Low : First color will be used for an up leg making a higher high or a down leg making a higher low / Second color will be used for an up leg making a lower high or a down leg making a a lower low
-
Volume shading :Volume Shading will use bolder colors for legs with greater volume, and will blend into the background for legs with low volume.
-
Delta shading : Delta Shading allows the user to provide two colors for positive and negativedelta, and paints each leg with bolder colors when the magnitude of the delta is greater, and blends into the background for smaller delta magnitudes.
-
Delta : Legs will be colored upon the positive / negative delta values
-
Delta Divergence : Legs will be painted with the second color whenever the direction and delta are diverging (ie an up leg with negative delta or down leg with positive delta)
-
Equi-change :When selected, this option highlights any leg which has an amplitude similar to the previous leg (in the same direction, ie 2 legs back). The second color is used to highlight such legs knowing that a wiggle (introduced as ticks) is being considered
Note: Hide Trendlines - only zigzag labels will be displayed (may be useful when overlaying several zigzag indicators with different "Custom Indicator" label)
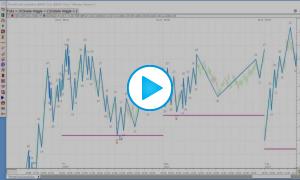
3) Zigzag lines additional features
Draw Reference Lines At - This allows for the drawing of reference lines on each leg of the Zig Zag, at a user-specified % / $ / tick change level from the base of the leg.
Equi-zig -This option results in variable width of each leg representative of the volume of each leg. The user may choose the maximum width in pixels; each leg is drawn with a width that is a percentage of that max width. The width is computed by multiplying the max width by the volume of the leg and dividing by the maximum volume of all visible legs. This option makes it very easy to visually compare the volume of different moves without inspecting textual labels. It includes a "Max Volume" option which gives any leg with that volume or greater the same (max) drawn width.
Fib Levels - This option is similar to the Fibonacci levels retracement drawing tool, ie horizontal lines will be displayed at the listed retracement %, with the levels being extended until the next leg starts, or being displayed as long as there are naked.
Zig channel - A trendline channel is automatically built based on the last 3 pivots
Parallel Lines - A set of lines parallel to the main zig zag line are displayed
Box each leg : a rectangle is drawn, encapsulating each single wave. A solid boxes option is available (on top of the default hollow one)
Triangles: a line connecting every pivot high (resp. pivot low) is displayed
Hide when pixels/bar is below X pixels: zig zag lines indicator is hidden when the min pixel/bar value is hit
"Alert When": a signal action is triggered when the selected condition is met on the current leg. Conditions include: a Change value for the leg (in tick or $) with the option to differentiate a move up or down, when a Delta Magnitude is hit (Absolute cumulative delta value for the leg), a delta per price conditions or finally a delta divergence conditions (ie an opposite zig direction and delta value). All these alerts could also be further customized using a separate signal marker with conditions based on a ZZO token.
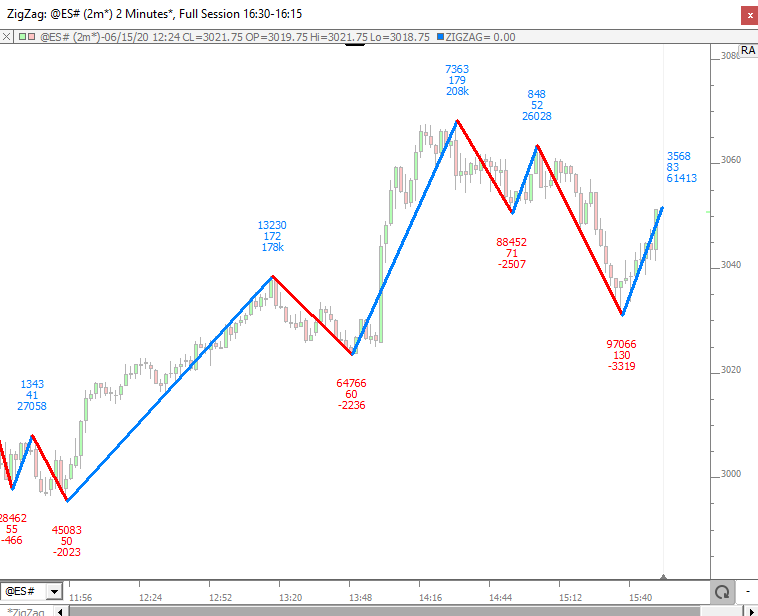
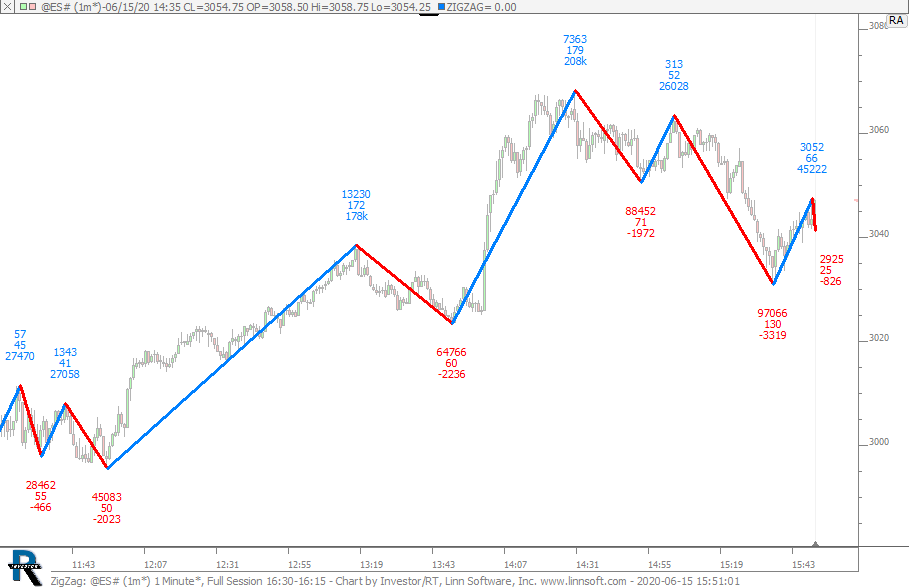
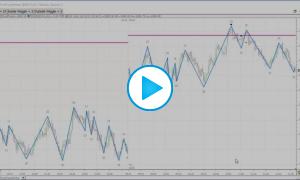
4) Label display options (next to each high/low pivots)
The labelling feature is determined by 3 types of inputs, displayed on 3 consecutive rows
-
The different "Label With" choices are discussed in the section 4.1) below
-
The different statistical options, that appears when checking the second row selection box, are discussed in section 4.2
-
The third row is a simple optional display filter rules
4.1) "Label With" : the ability to label each leg of the endline with one or several stacked labels among the one listed below.
-
No Labels - No text label at end of line/leg.
-
End Price - Ending price of each line/leg.
-
Begin Price - Labels the begin price of each line/leg. Label appears on left/begin of each line. Only of use for Trendline labeling.
-
Begin/End Price - Both begin and end prices are labeled at respective position of line. Only of use for Trendline labeling.
-
Percent Change - Change in price of the line/leg expressed as a percentage of the price.
-
Change in Price - Change in price of the line/leg is labeled at end of line/leg.
-
Slope (Price/Bar) - Slope measured in change in price divided by number of bars. The change per bar of the line/leg.
-
Number of Bars - Number of bars which the line/leg spans.
-
% Change and Bars - % Change is measured as the difference in price multiplied by 100 and divided by the begin price. To the right of % Change, the number of bars is presented in parenthesis.
-
Change and Bars - Change in price with the number of bars presented to the right and in parenthesis.
-
End Price and Bars - Ending price of the line/leg with the number of bars presented to the right in parenthesis.
-
Prices and Bars - Prices represents the number of prices or tick increments spanned vertically by the line/leg. The number of bars is presented to the right in parenthesis.
-
Slope (Degrees) - Slope measured in degrees from horizontal. Downward sloping lines have a negative slope. Slope will change when zooming or resizing chart. User other slope option (change per bar) for a consistent reading regardless of zooming/resizing.
-
Prices - Number of prices or tick increments spanned vertically by the line/leg.
-
Total Volume - Cumulative Volume of all bars spanned by the line/leg. By default, the bar which begins the line/leg is not considered in this total. A configuration variable ZigIncludeStartBarVol can be turned on to include the start bar volume.
-
Average Volume - Average Volume per bar computed by dividing the Total Volume by the number of bars.
-
Total Delta - Cumulative Delta (buying volume minus selling volume) of all bars spanned by the line/leg.
-
User Specified... - Allows user to enter custom label for the end of each line/leg. Label is presented at the end of each line/leg.
-
User Specified (left)... Allows user to enter custom label for the end of each line/leg. Label is presented at the begin/left of each line/leg.
-
Delta Percent - Total Delta of line/leg as a percentage of total volume of line/leg.
-
Delta Per Price - Total Delta (buy volume minus sell volume) of line/leg divided by the number of prices or tick increments spanned in the line/leg. The average delta required to move price one tick increment.
-
Delta Per Bar - Total Delta divided by the number of bars spanned vertically by the line/leg.
-
Volume Per Price - Total Volume of line/leg divided by the number of prices or tick increments spanned in the line/leg. The average volume required to move price one tick increment.
-
Bars and Time (d:h:m:s) - Number of bars spanned by the line/leg along with the time it took to complete the line/leg to the right in parenthesis. If the time is under an hour, only the minutes and seconds will be presented. The rightmost digit is always seconds. 2nd from the right is always minutes. 3rd from the right is always hours (if line took longer than 1 hour). 4th from right is always days (if line took longer than 1 day).
-
Bars and Time (Secs) - Number of bars spanned by the line/leg along with the time it took to complete the line/leg to the right in parenthesis. Time is presented in number of seconds elapsed from begin of line/leg to the end (number of seconds to complete line/leg).
-
Total Delta (Last VB) - This result looks for the last instance of Volume Breakdown in the chart and will only work if the Volume Breakdown indicator is added to the chart. It sums the per bar values of the Volume Breakdown for all bars within each line/leg. This allows users to label with filtered total delta of each line/leg by placing a volume filter within the Volume Breakdown. Volume Breakdown should have the Accumulate option UNchecked for this to work properly.
-
Total Delta (2nd to Last VB) - This result looks for the 2nd to last instance of Volume Breakdown in the chart and will only work if there are at least two instances of Volume Breakdown in the chart. It sums the per bar values of the Volume Breakdown for all bars within each line/leg. This allows users to label with filtered total delta of each line/leg by placing a volume filter within the Volume Breakdown. Volume Breakdown should have the Accumulate option UNchecked for this to work properly.
-
Delta Diff (Last 2 VBs) - Delta Diff takes the Total Delta (Last VB) and subtracts from it the Total Delta (2nd to Last VB). See descriptions of these two labels above. This option can be used to see the difference between two volume filtered delta values within each line/leg.
-
Time (hh:mm) - Time of day on which the line/leg is completed. Hours and minutes only.
-
Time (hh:mm:ss) - Time of day on which the line/leg is completed. Hours, minutes, and seconds.
-
Date (mm/dd) - Date on which the line/leg is completed. Monthy and day only.
-
Date (mm/dd/yy) - Date on which the line/leg is completed. Monthy, day, and year.
-
Total Trades - Total number of trades which took place during each line/leg. Sum of the total trades within each bar spanned.
-
Average Size - Average size of all trades which took place during each line/leg. Total Volume divided by Total Trades.
-
End Price and Change - Ending Price of each line/leg accompanied by the change in price of the line/leg in parenthesis.
-
Dollar Value Change - The Dollar Value equivalent of 1 traded contract/share. For stocks, the dollar value change will be same as change in price. For futures, the number of prices will be multiplied by the Point Value of each tick increment for the futures contract ($12.50 for ES for instance).
-
Volume of End Bar - Volume of the bar that ends the line/leg.
-
Volume of End Price - Volume of the extreme price of the bar that ends the line/leg. For Zig Zag, on upwards moves, the high price of the ending bar will be presented. Users may turn on a configuration variable ZigZagUseLastHiLo which will force the Zig Zag to end on the last bar with matching highs with several bars hit the same high. When this option is turned on, the volume of the highs of all the matching highs will be summed and presented.
-
Retracement - Percent retracement of each line/leg relative to the previous line/leg. This label is valid only for use with the Zig Zag Indicator. A value of 75% on a line/leg means the vertical price move of the line/leg was 75% of the move of the prior line/leg.
-
Delta of End Bar - Delta of the bar that ends the line/leg.
-
Delta of End Price - Volume of the extreme price of the bar that ends the line/leg. For Zig Zag, on upwards moves, the high price of the ending bar will be presented. Users may turn on a configuration variable ZigZagUseLastHiLo which will force the Zig Zag to end on the last bar with matching highs with several bars hit the same high. When this option is turned on, the delta of the highs of all the matching highs will be summed and presented.
-
Custom Stack - input a sequence of letter/number (see the available options in the box below) to create a stack of the corresponding data that will appear for each pivot point
-
Volume Retracement - Percent retracement of the volume of each line/leg relative to the previous line/leg. A value of 75% on a line/leg means the cumulative volume of the line/leg was 75% of the volume of the prior line/leg.
-
Volume Divided By... - Volume divided by the value included in the second checkbox
-
Volume/Price Retrace - Percent retracement of the volume/price ratio of each line/leg relative to the previous line/leg. A value of 75% on a line/leg means the cumulative volume/price ratio of the line/leg was 75% of the volume/price ratio of the prior line/leg.
-
Time (Seconds) / Time (Minutes) - Duration of the leg expressed in seconds / in a rounded number of Minutes
-
Time (mm:ss) / Time (hh:mm) - Duration of the leg expressed in the mm:ss and hh:mm formats
-
Percent Change (Rounded) - Change in price of the line/leg expressed as a percentage of the price (an integer value is displayed)
-
On Balance Volume - Cumulative OBV value for the leg (sum of all volumes for up bar minus all volumes for down bars)
-
Waves - Elliot Wave style labeling where higher highs are labeled with increasing numbers and lower lows are labeled with increasing letters.
-
Custom indicator - When CustInd is checked, Zig Zag will identify the custom indicator present in the chart that has the identical Text Label as the Zig Zag Indicator itself. Please note:that the text Labels (seen below the indicator preferences) must match precisely. Zig Zag will label each pivot with the value of that custom indicator at that pivot. This provides a great deal of flexibility to the already extensive list of Zig Zag pivot labeling choices.
4.2) Statistical computations & additional display options (offered on the input selection box on the second row)
The following computations can be applied to the "Label With" optiosn selected on the first row chekbox:
-
Accumulate
-
Average
-
Count
-
Maximum
-
Minimum
Above 5 options require a second input, i.e. the period on which the computation takes place, ie either Day, Week, Month, Quarter, Year or Chart
The following computations, based on the last completed Leg, are also available
-
Per Bar
-
Per Price
-
Per Second
-
Per Minute
Two other computations are available: "% of Previous" and "% of 2 back". As an example, if the label was setup to show "Total Volume", and "% of Previous" was turned on, the value shown might be 120%, which indicates that the volume of the labeled leg is 120% of the volume of the prior leg. If "% of 2 Back" was specified, then a value of 75% would reflect that the volume of the labeled leg was 75% of the volume of 2 legs back (the previous leg in the same direction). These new options allow the user to easily identify when volume is high or low relative to the prior leg or the prior leg in the same direction.
Finally, multiple value scaling options are available so that only the significant digits are being displayed in case of large numbers: /10, /100, /1000, /10k, /100k, /1m
Additional label display options: a font size can be selected. The labels can be boxed, colored and shifted up or down according to a number of lines (derived from the font size).