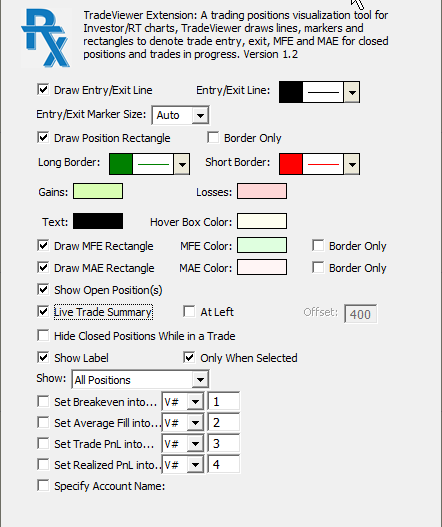
TradeViewer is a trading results visualization tool. It draws lines, markers and color coded rectangles to denote the entry price and exit price of each of your trades with optional highlighting of the maximum favorable (MFE) and adverse (MAE) excursions of price during the trade. TradeViewer has the option to show your interim trading results while in a live trade. There are 4 optional drawings:
- The entry to exit line is drawn with user-specified color/width/style.
- The position rectangle is the rectangle that includes all the bars formed during the trade, confined to the price range extending from the entry price to the exit price. The position rectangle border is color coded to convey that the position was a LONG or SHORT. This rectangle is filled with the user-specified gain or loss color based on whether the trade was profitable or you may elect to draw only the border of the postion rectangle. If the position rectangle is drawn border only, a small triangular swatch of color is drawn at the entry side of the position rectangle to visually convey gain or loss.
- The MFE rectangle encloses the bars of the trade extending from the entry price to the most favorable (MFE) price. If price never moved favorably then this rectangle is empty. This rectangle is filled with the user-specified MFE color or you may elect to draw only the border of the MFE rectangle.
- The MAE rectangle encloses the bars of the trade extending from the entry price to the most adverse (MAE) price. If price never moved against you then this rectangle is empty. This rectangle is filled with the user-specified MAE color or you may elect to draw only the border of the MAE rectangle.
Trader viewer supports various button events. For example, create a button; set up the button with purpose RTX Event and event name TradeViewer:Cycle Style. Each click of the resulting button cycles the display including more content, drawing rectangles with color fill and with border only. Starting with the entry/exit line, then adding the position rectangle, then showing MAE rectangle, then the MFE rectangle, then both MAE and MFE rectangles with and without borders. This is an excellent way to cycle though various combination of setting to find the style you most prefer.
In large part, this RTX replaces the Trading Notes Marker indicator functionality. If you elect to include both TradeViewer and Trading Notes in the same chart, some of their drawing content will overlap. TradeViewer draws a dot, color coded to denote LONG/SHORT, at each price when a position was initiated and a diamond marker when the position was closed. Hovering the mouse pointer over a dot or diamonds pops up a small text callout box reviewing the results of the trade or the interim results of the trade in progress. The size of the entry dots and exit diamonds can be user-specified or you can choose Auto for size and Tradeviewer will draw size 8 or larger based on the spacing available between bars (pixels per bar setting) of the chart; increasing/decreasing the marker size as you zoom in and out with the mouse wheel.
To select the TradeViewer indicator in the chart, click on any corner of any displayed rectangle or on any dot or diamond marker. When selected, some text is drawn for each position to show Long or Short and Qty. When selected, press enter key to view the current preferences, or press Del key to delete the indicator. Various keyboard shortcuts and mouse wheel shortcuts apply when TradeViewer is the selected indicator.
A trader may wish to focus on his winning trades or losing trades, or perhaps study long positions apart from shorts. The TradeViewer indicator by default shows all trades that occurred during the chart's viewing period. You can create a button in any chart containing TradeViewer; setup the button with purpose RTX Event and event name TradeViewer:Cycle Positions. Each click of the resulting button cycles through various display modes: all positions, long positions only, short positions only, winners only, losers only.
When using TradeViewer in a very busy chart with many indicators, it may be useful to add the extension twice to your chart pane. One instance can be setup to draw with lowest priority to draw the rectangular areas of interest (the position rectangle, MFE rectangle, and MAE rectangle). The second instance of the RTX can be setup to only draw the entry to exit line; use the Chart Element Manager to make this one top most in the list of elements in the pane. This way, you can see the shaded rectangles in the background, overlaid with your other indicators and instrument drawings, with the entry/exit line clearly showing where you entered and exited each position. You can of course setup a button in your chart to show hide either or both of these instances.
Hover the mouse point over any entry dot or exit diamond and a hover box will apear showing you the details of the particular trade. Mover away from the marker and the hover box will disappear. Note that the hover box always appears over the entry dot of the trade; thus you can move your mouse over an exit diamond and see the hover box popup over the entry dot for that particular trade. Depending on the background you prefer for your trading chart(s) you can adjust the hover box background color so it blends well yet stands out to show the trading details. When TradeViewer draws the hover box, it connects the box to the entry dot with a triangular shape; this triangle is filled to denote Gain or Loss, the same color that fills the position rectangle.
Presentation
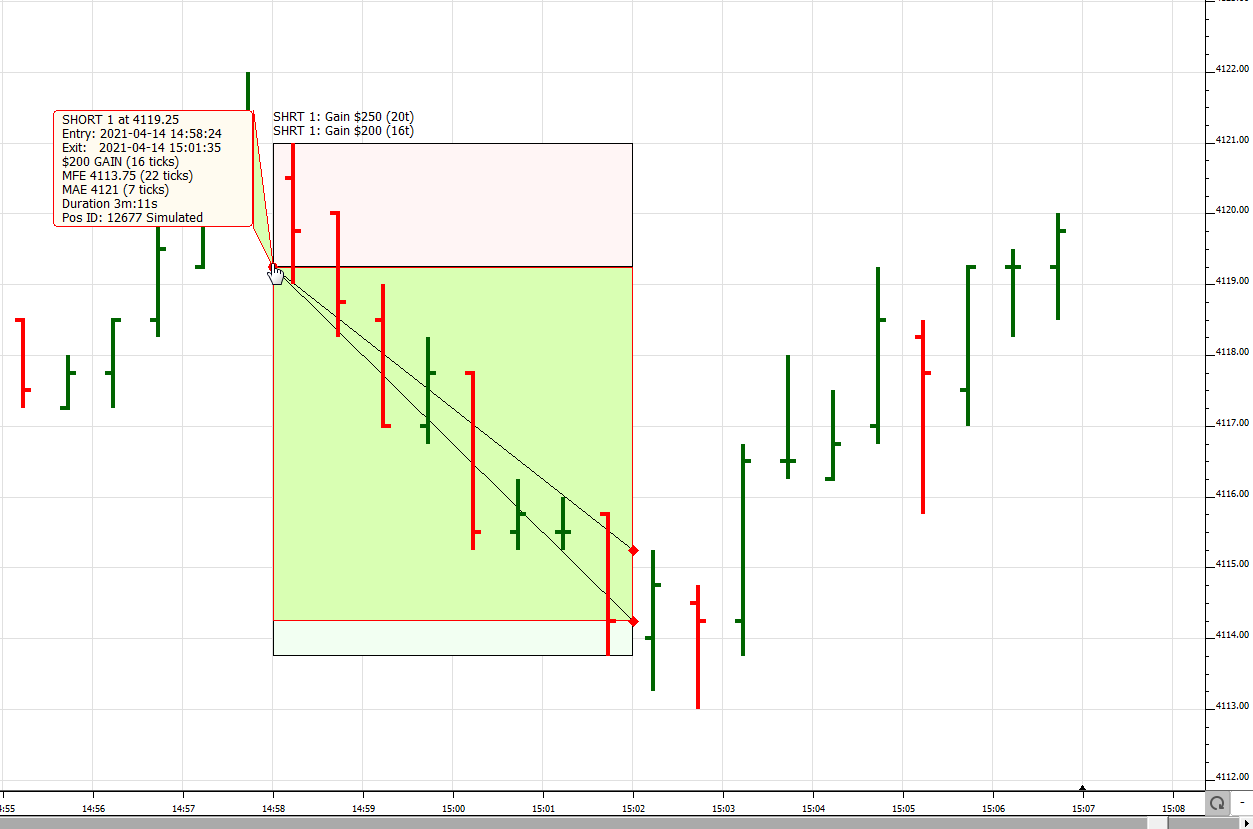
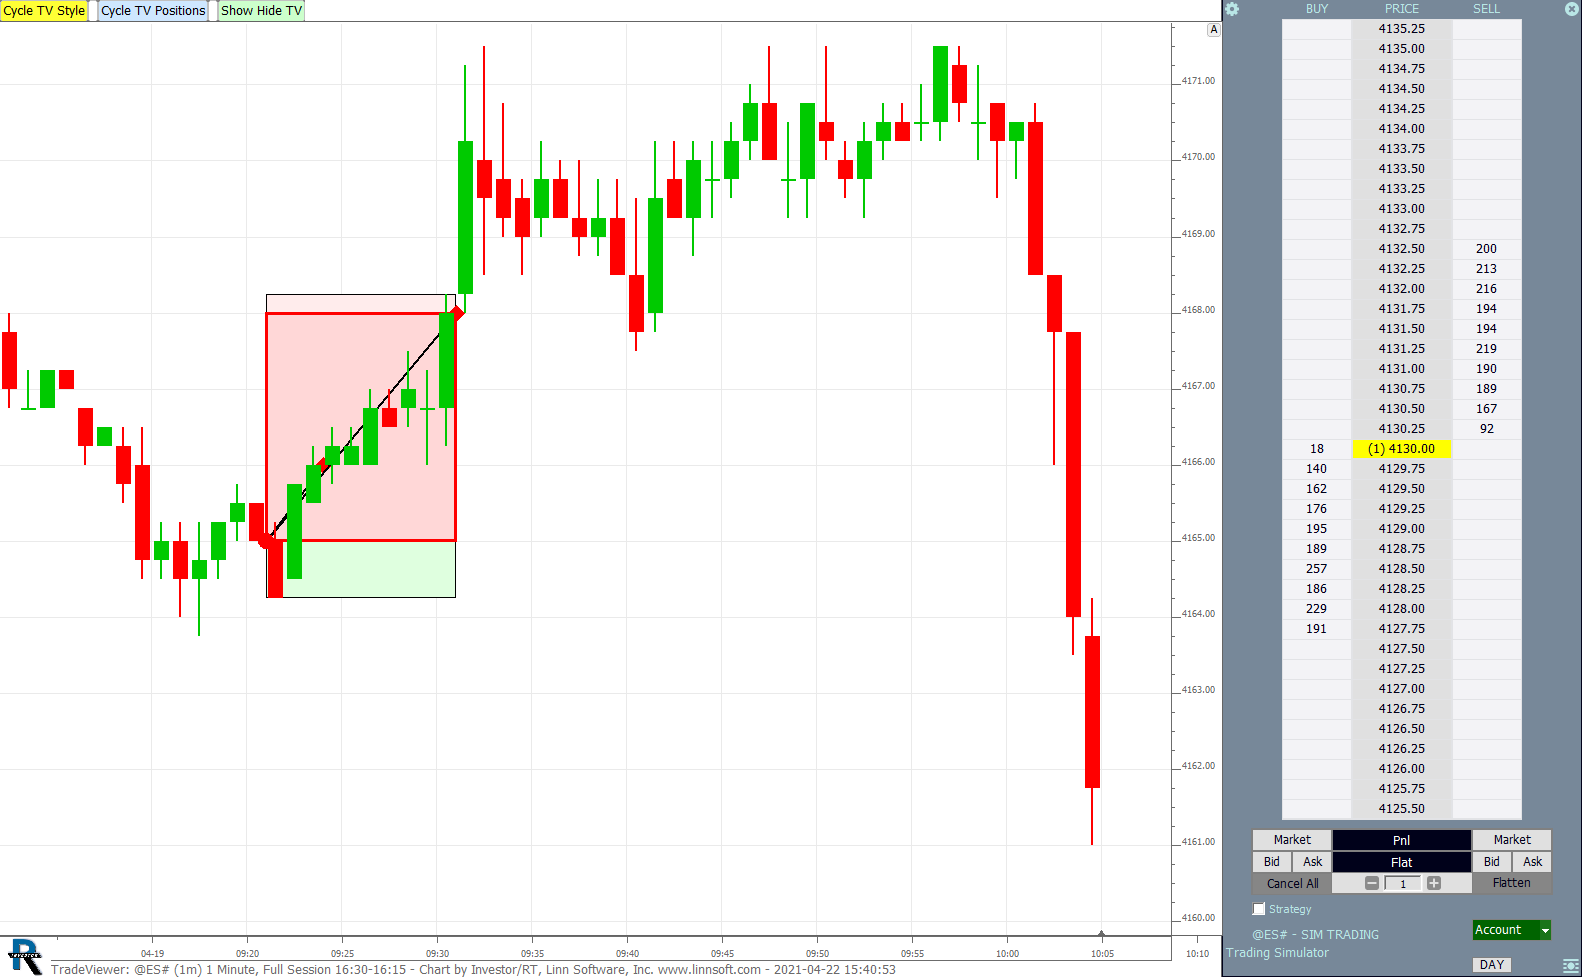
Here the mouse is hovering over the short entry dot marker where the position was opened SHORT 2 with two target OCO brackets in the Trading Strategy. Both had 8 tick stops and the first target had a 16 tick target, the second a 20 tick target. Entry to exit lines for each 1 lot are closed in the green rectangle to denote a profitable trade. The border of the position rectangle and the entry/exit markers are red to denote that this was a short. The MAE rectangle in lighter red and the MFE rectangle in lighter green shows the adverse and favorable price movements outside the entry to exit price.The first leg hit the 16 tick target and shortly thereafter (same bar) the second leg hit its 20 tick target. The exit prices are marked with red (the Short Color) diamonds to denote a SHORT exit.
Here is an example of TraderViewer displaying a trade in progress with the Live Trade Summary option on. Here the position LONG 3 was entered with three buys of 1 contract.
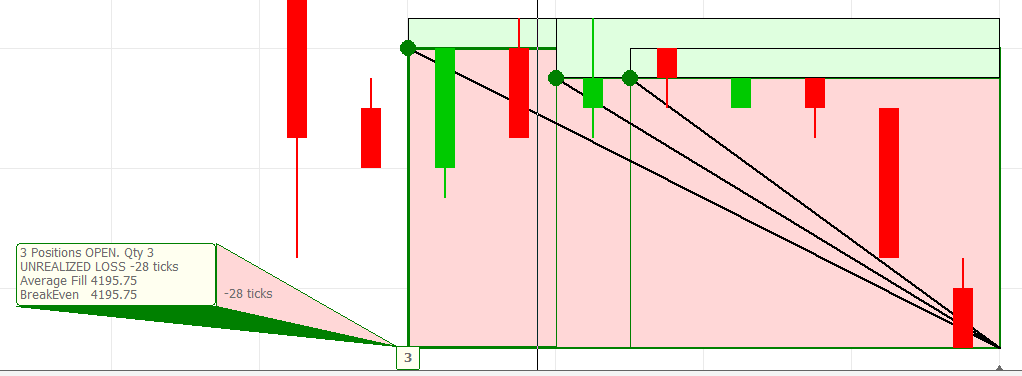
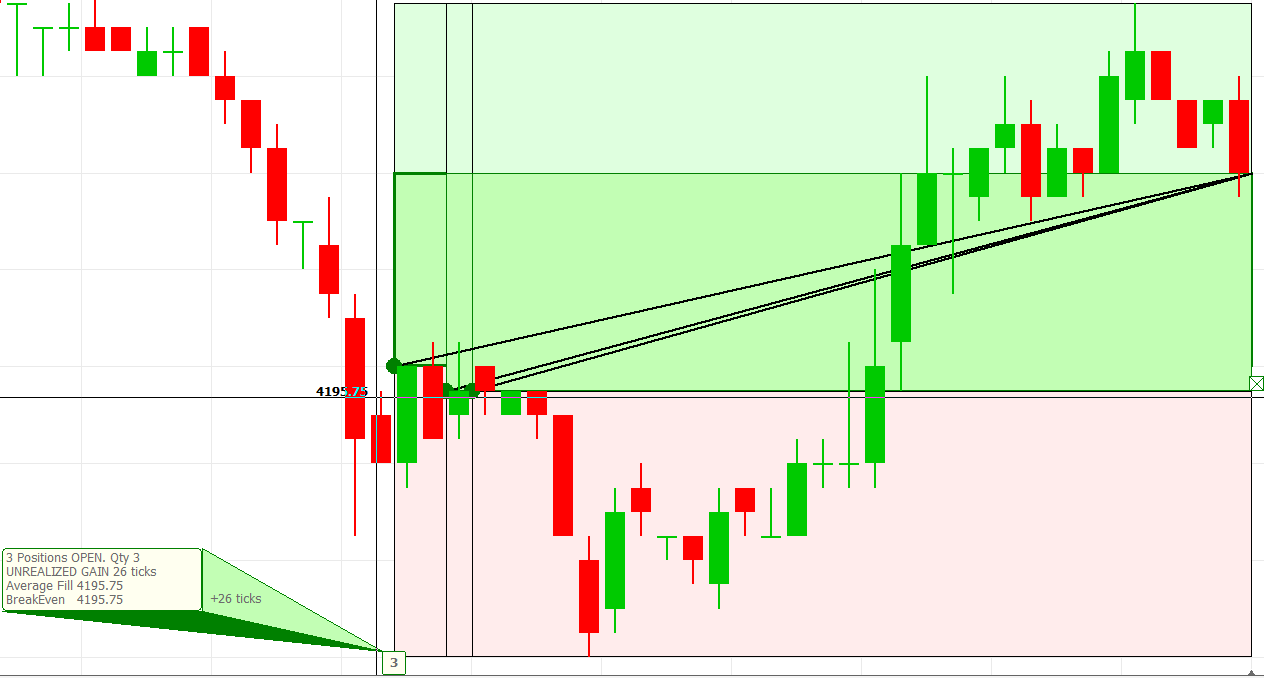
Should you partially exit a multi-position trade, the Live Summary updates to show both realized and unrealized PnL in ticks and the breakeven exit price. The callout box underside color (green) indicates the trade is LONG and the side color (showing -28 ticks) indicates the overall trade thus far is unprofitable. Here is the same trade, a few minutes later after the ES recovered and the trade becomes profitable:
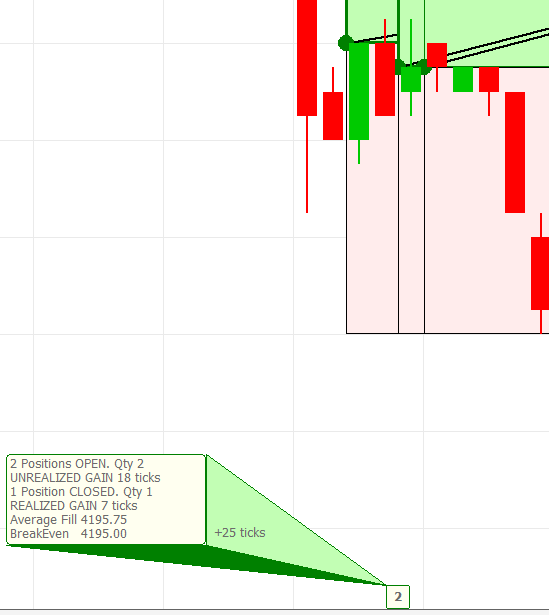
After selling one contract, the TradeSummary updates and the position size box shifts over to the first remaining position of the LONG 2 position:
Keyboard Adjustment
You can add buttons to a chart to trigger actions by the TradeViewer indicator. Add a button with purpose RTX Event and specify one of the supported RTX Events below:
- Cycle Style will cycle the display including more content. Starting with the entry/exit line, then adding the position rectangle, then showing MAE, then the MFE, then both MAE and MFE, color filled, then with borders only
- Toggle Display will alternately show or hide the positions indicator from view.
- Cycle Positions will cycle the positions shown. Starting with all positions, then long positions, then short positions, then winners and finally losing trades.
- Toggle Label will alternately toggle the setting Show Label Only When Selected.
- Toggle Posn Border will alternate between showing the position rectangle filled with the Gain/Loss color and showing only the border with no fill (hollow rectangle).
- Toggle MFE Border will alternate between showing the MFE rectangle filled with the MFE color and showing only the border with no fill.
- Toggle MAE Border will alternate between showing the MAE rectangle filled with the MAE color and showing only the border with no fill.
- Toggle Show Live will alternately toggle the setting Show Live Position. This can be useful when you are in a multi-leg position with some contract(s) remain open but a portion of the position has been closed. Temporarily hiding the live position display will reveal the closed portion of the trade. Toggle Show Live again and the live trade visualization returns.
- Toggle Live Summary will alternatively toggle the setting Show Trade Summary Text While in a Trade, The summary text shows details of the current live trade, the remaining size, realized and unrelealized PnL.
The TradeViewer is selected by clicking one the corner of any rectangle or on any extry or exit marker. While in a trade, clicking inside the trade summary text box if present also selects TraderViewer. Selection is visually indicated by the entry/exit lines drawn thicker that usual. When TradeViewer is selected, using the Ctrl key in combination with up, down, left or right arrow keys are keyboard shortcuts. Ctrl up/down (or mousewheel) cycles through the styles (see RTX Event Cycle Style above). Ctrl+left/right arrow keys cycle through which positions are displayed (see RTX Event Cycle Positions above).