Note: TINT requires access to market depth from your data provider. Market depth is available from these feed providers: IQFEED, Rithmic or CQG. TINT requires the Market Depth Analysis add-on package.
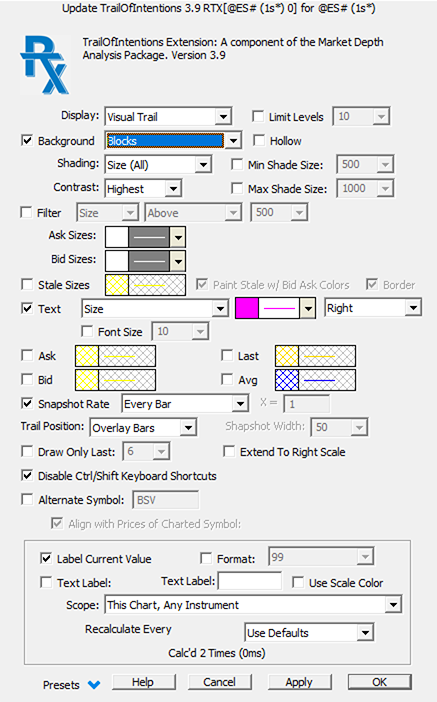
Trail of Intentions (TINT) is an RTX Extension designed to display historical snapshots of the depth of market. The market depth provides numeric insight into the intention of traders to buy and sell at various prices. TINT provides a wealth of options to visually identify relative size and changes in sizes among prices within same snapshot or from snapshot to snapshot over time. Users may customize the shading of the background of each price to reflect size or change in size of each price. Optional text may be displayed at each price showing size, change in size, size inside, or size outside. (sum of size at or outside any given price) Key prices such as Ask, Bid, Last, and Average (size-weighted average) may be highlighted within each snapshot. Snapshots may be taken at a variety of rates driven by periodicity (Every Bar), trades (Every X Trades), time (Every X Seconds), and volume (Every X Volume). Shapshots may overlay bars, or be positioned on the right or left edge of the chart and users have the option to limit the number of snapshots displayed.
Presentation
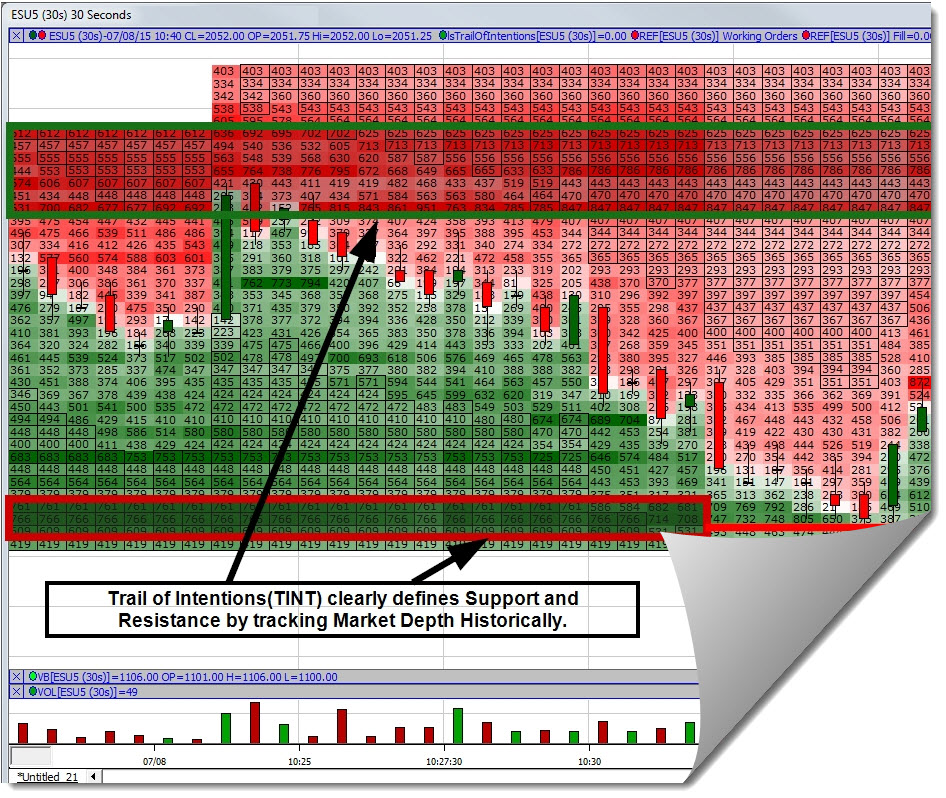
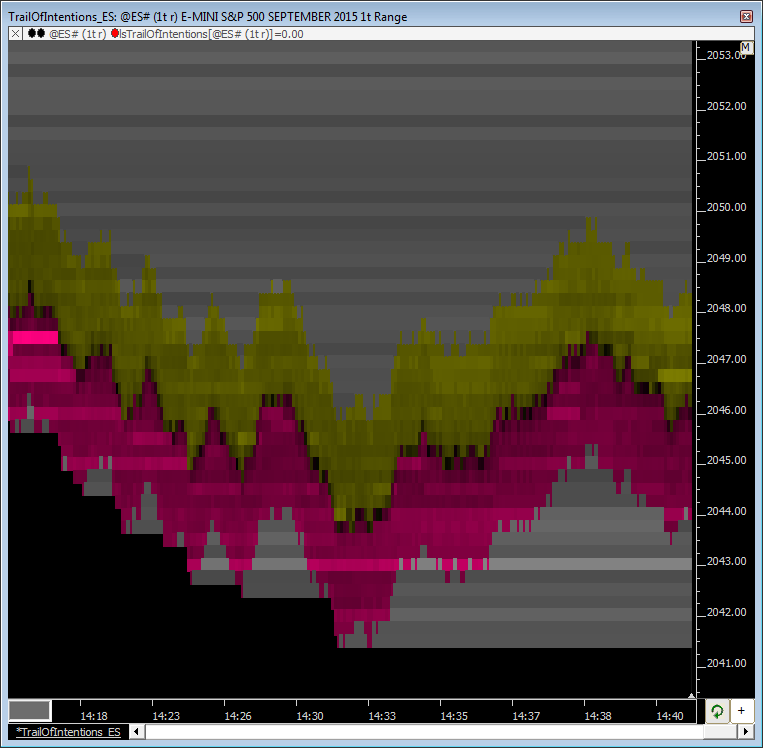
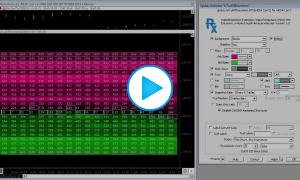
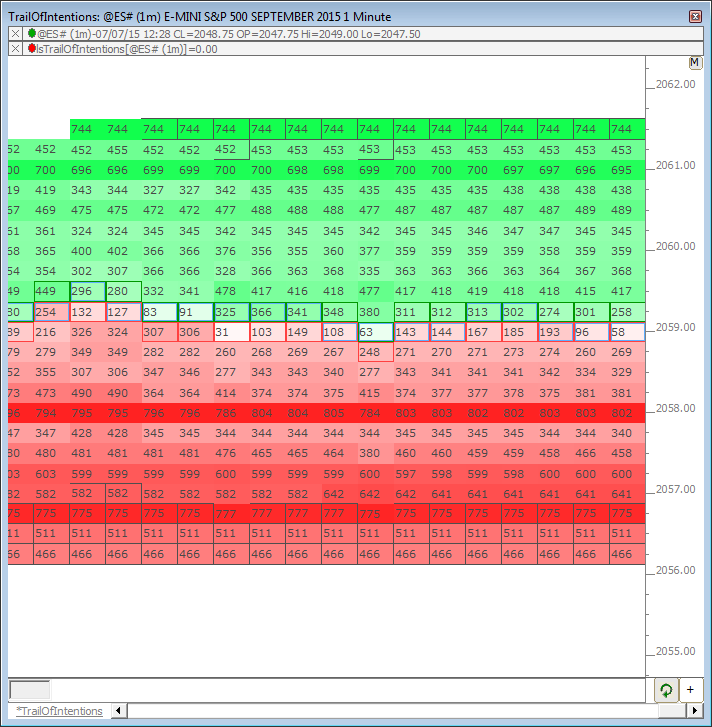
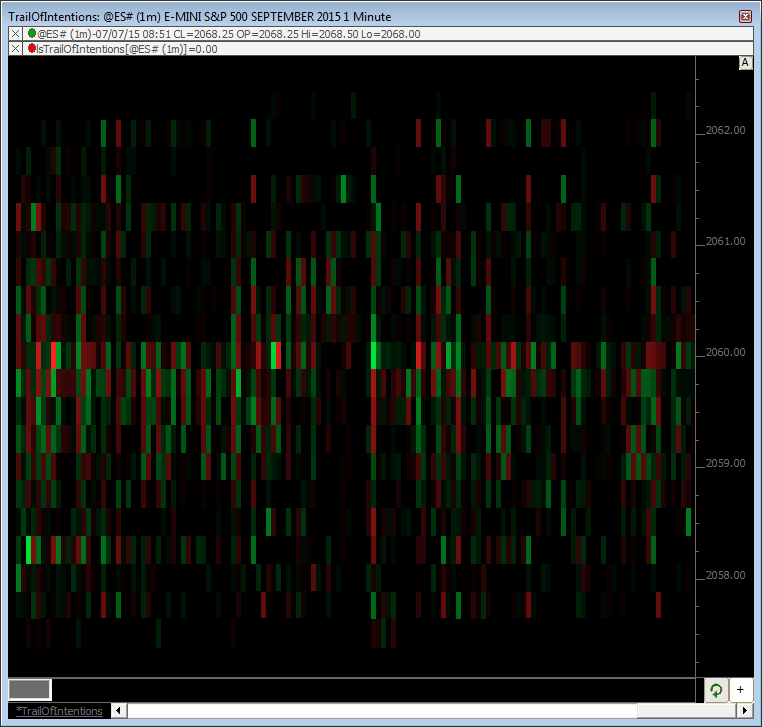
Here is a representation of Trail Of Intentions data being captured with snapshots every 1 second, with the cells shading being based on the relative depth size.
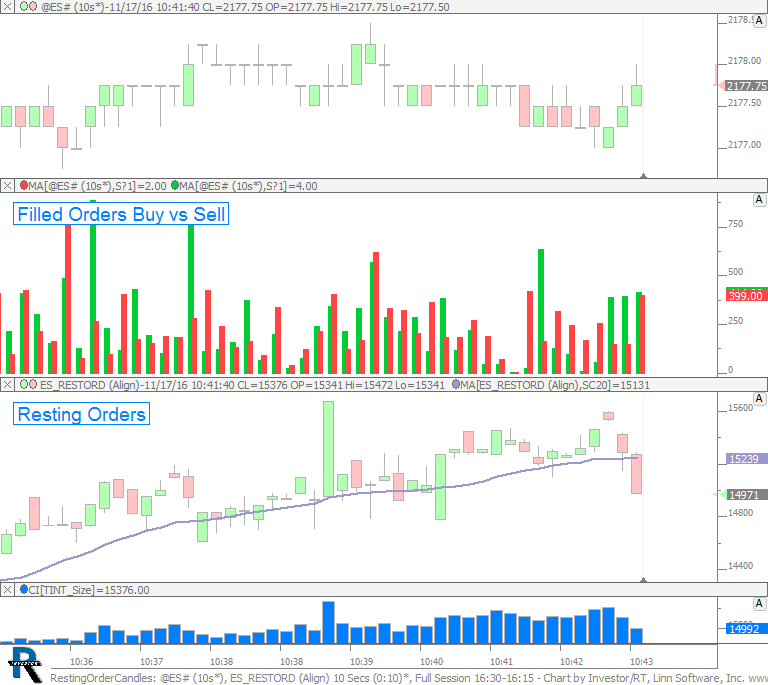
TINT is typically used together with the TradeDots RTX indicators to build custom historical market depth charts
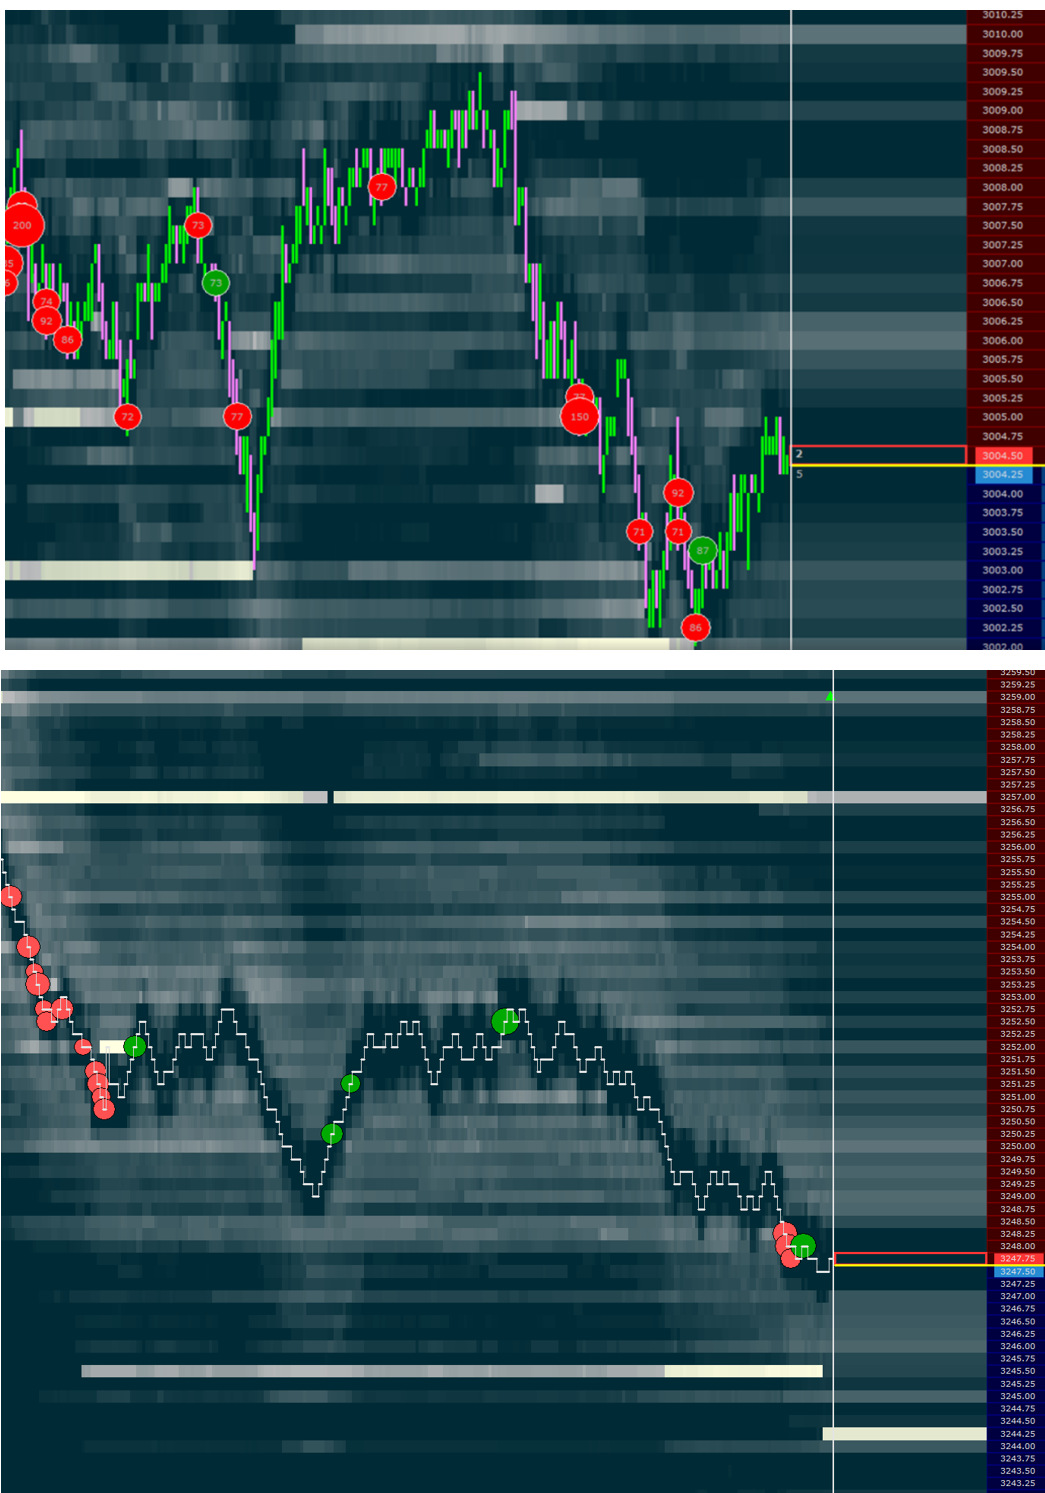
Max. and min. shading settings can be either automatically controlled or dynamically updated upon a custom range of historical depth size values so that only extreme values (percentile wise) of resting orders are highlighted.
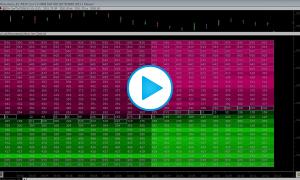
The chart below shows Trail Of Intentions set to display changes in size. Green represents a positive change in size and red represents a negative change in size. Brighter colors represent a larger magnitude. This data can be recovered through the TINT token and used in custom indicators to generate any kind of alert (sound, text message) whenever a heavy pocket of liquidity (near the current spot prices) appears or disappears
Keyboard Shortcuts
- Up/Down Arrow Keys - Adjust the width of each snapshot / column.
- Left/Right Arrow Keys - Adjust position of TINT between left side, right side, and overlay bars.
The keyboard shortcuts listed below are only enabled if the checkbox "Disable Ctrl/Shift Keyboard Shortcuts" is UNchecked. For users wishing to changing any of these display settings quickly and easily without opening the preferences, these Ctrl/Shift shortcuts may come in handy. Otherwise, they can get in the way of zooming, resizing, and scrolling operations that can be achieved via combinations of Ctrl/Shift Up/Down/Left/Right arrows.
- Shift+Up Arrow Keys - Adjust background shading between size, change, and none
- Shift+Left Arrow Keys - Adjust text display option between size, change in size, size inside, size outside.
- Ctrl+Up Arrow Keys - Increase the number of snapshots/columns drawn by 1.
- Shift+Down Arrow Keys - Adjust the background style between blocks, size histogram, and change histogram.
- Shift+Right Arrow Keys - Adjust position of text within each snapshot between left, right, and center.
- Ctrl+Down Arrow Keys - Decrease the number of snapshots/columns drawn by 1.