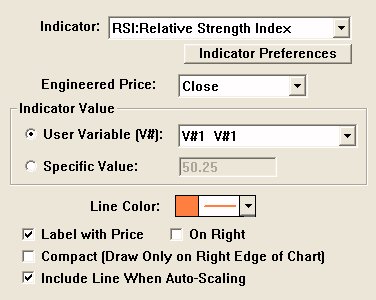
The Reverse Engineer indicator answers the following question: "What current price would be required to attain an indicator value of X". For instance, you may want to know what closing/last price (on a daily chart) would be required in order for the RSI value to reach 70. Or you might want to know what high price would have to be reached (on a daily chart) in order for the current day's range to exceed its average range over the past 20 days. There are three key components the user specifies in the Reverse Engineer indicator: (1) the price to use (close, high, low, open, or volume), (2) the underlying indicator, and (3) the indicator's "projected" value. Once the three settings are specified, Reverse Engineer computes a single resulting value representing the price needed to attain the underlying indicator's projected value. The result is a single "current" value (no historical values) based on a single projection of the current value of the underlying indicator. Since there is only one result, it is displayed in a chart as a horizontal reference line, with similar display options as the horizontal reference line indicator. Options include: "compact", "Label with Price", Label "On Right", and "Include Line When Auto-Scaling". The user specifies the underlying "Indicator" at the top of the preferences window. Once the underlying indicator is selected, the "Indicator Preferences" button is used to adjust the settings for the indicator. The "Engineered Price" provides options of "Close", "High", "Low", "Open", and "Volume". The "Engineered Price" is the type of price involved in the calculation of the indicator. The "Indicator Value" can be specified directly using "Specific Value") or as a User Variable (V#). If User Variable is selected, then the indicator value will be obtained from the corresponding V# variable for the symbol associated with the indicator. Allowing the user to specify the indicator value as a V# variable opens up some interesting possibilities. First, the user can set the V# variable of many symbols using a scan. For example, the V# can be set to the highest value of the indicator over the past 5 days, or the previous day's value of the indicator plus some percentage. The V# values can be adjusted automatically each day (or more frequently) by specifying that the scan be run on a schedule (see Setup: Schedule). The user can put a reference line in the same pane as the underlying indicator, associating that reference line to the corresponding V# variable ("Use: V#1"). This way, the user can drag the reference line to adjust the V# indicator level at any time. The Reverse Engineer indicator will then display the price needed to attain that level in the instrument pane.
Presentation

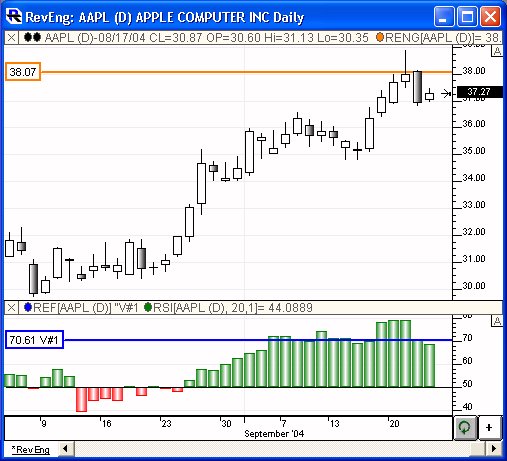
The chart above shows daily candlesticks of AAPL overlaid with an orange Reverse Engineer line. The Reference Engineer indicator is setup with the preferences seen below. In this specific example, the Reverse Engineer is calculating the closing price necessary to achieve an RSI value of V#1 (which happens to be 70.61). In the lower pane, the RSI indicator is overlaid with a blue Reference Line indicator which is setup to "Use: V#1". When setup in this fashion, the line can be dragged to any level, and the V#1 will reflect the new level. By changing the V#1 value in this way (dragging the ref line), the Reverse Engineer will then reflect the change and compute the price needed to achieve the new RSI value. NOTE: The user may need to shift-click on the Download/Refresh button at lower right corner of the chart to force the Reverse Engineer indicator to recalculate/redraw after dragging the V#1 reference line.


