Price Volume Pattern (RTX)

Price Volume Pattern (PVP) RTX Extension is included with the Volume Analysis Package. PVP complements the order flow analysis done by the VolumeScope Package and is included for all subscribers to the VolumeScope package as well as all Professional Trader subscribers.

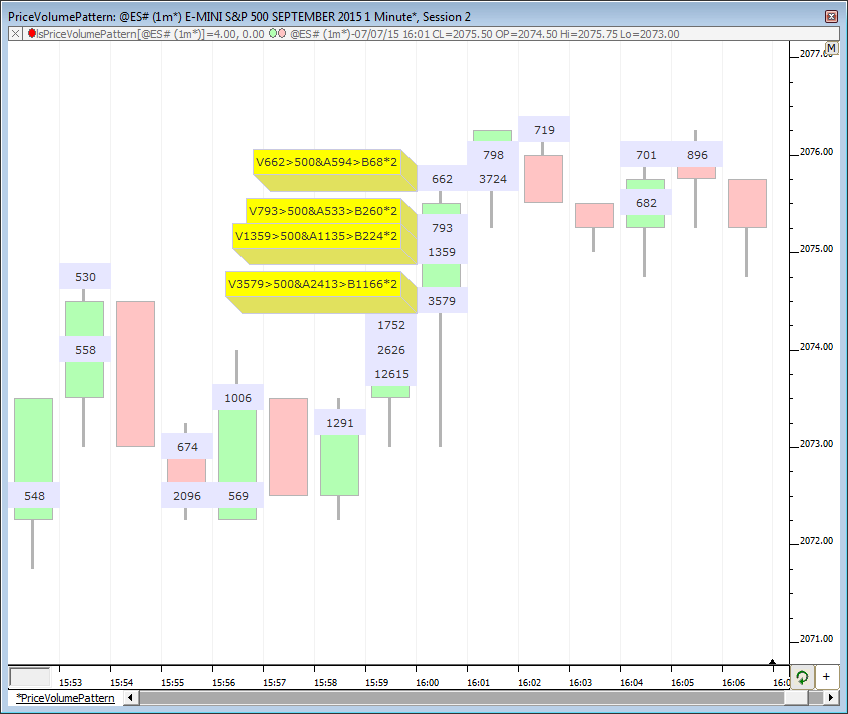
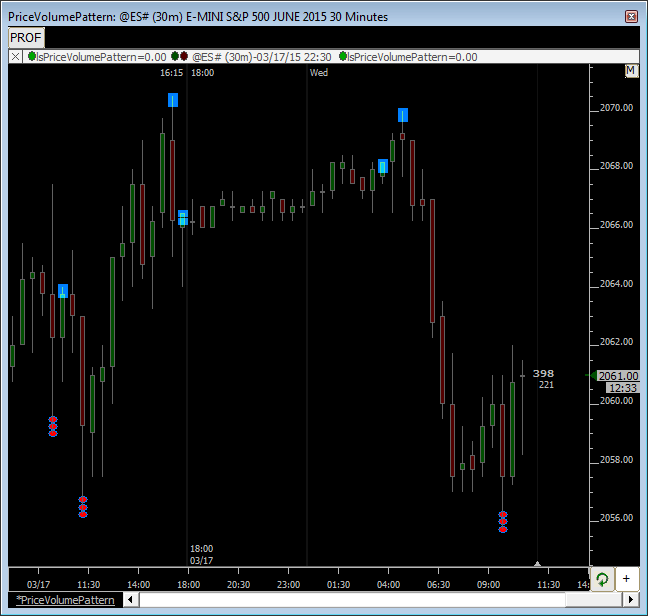
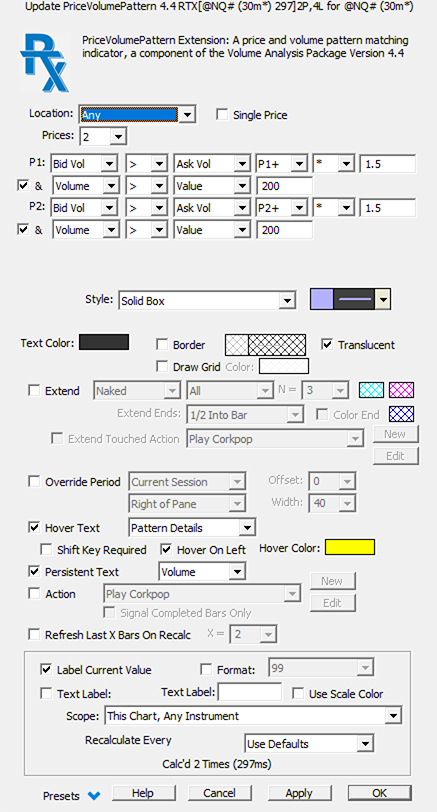
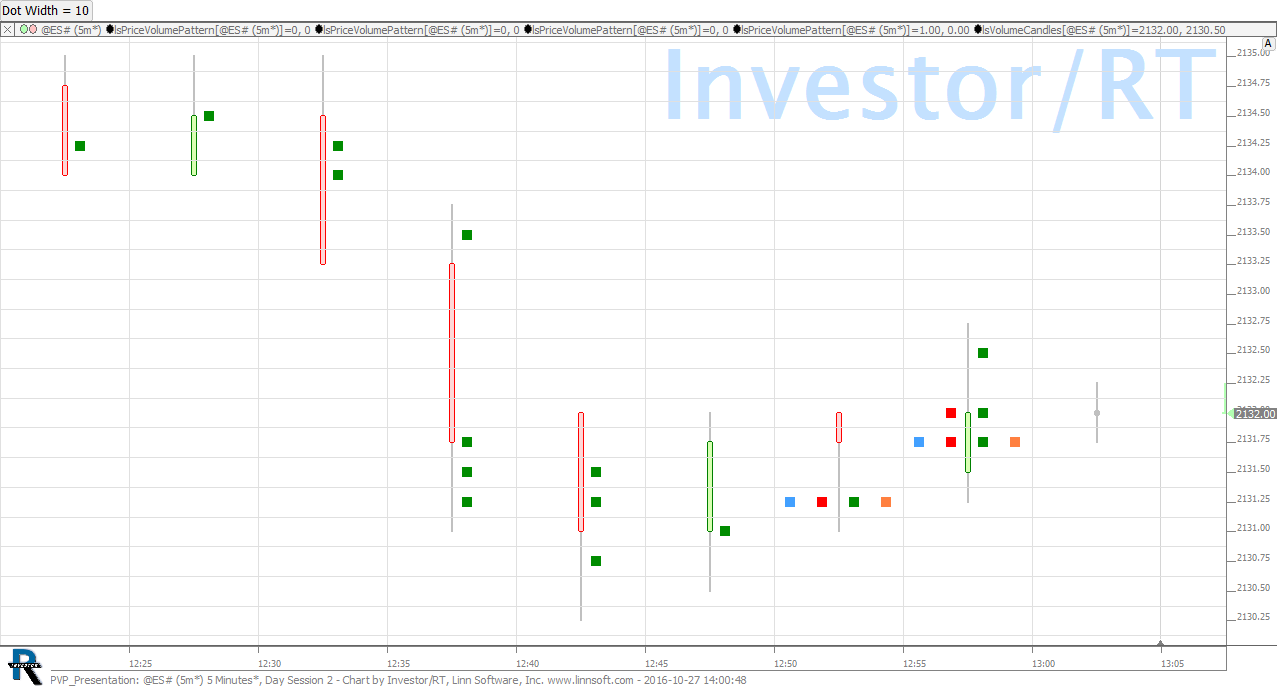
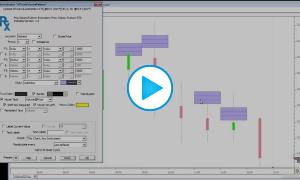
PVP is a powerful order flow pattern matching facility that works hand-in-hand with VolumeScope. It is designed to identify buy and sell volume-based patterns within a sequence of one or more prices within each bar. One-price, two-price and three-price patterns can be identified at the high of bar, low of bar, the highest or lowest occurrence within the bar, or all occurrences within each bar. Within each price within a bar, volume, ask volume, bid volume, or delta may be compared to specific values, or to multiples of volume, ask volume, bid volume, or delta. A secondary criteria is optional for each price. Prices that meet the specified criteria are identified with a drawing style such as Solid Box, Hollow Box, Dot, or Line. Customization of each style is possible by specifying a number of horizonal slices and an offset (which slice) to use. Each PVP indicator in a chart can thus be setup to draw into a different slice for each price.

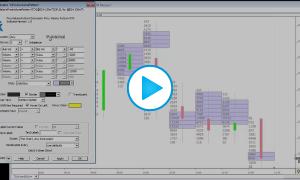
PVP can be added directly to a chart or it may be incorporated into RTL custom indicators and signals. Multiple pattern detection criteria may be operational within a single chart by adding the PVP extension two or more times. A price criteria can also compare the buy/sell volume or delta with a value computed elsewhere in the chart. For example, a Session Statistics indicator in the chart could compute an average volume per bar. The PVP can be set to detect a pattern where buy (ask) volume is some multiple of the SESST calculated average volume.

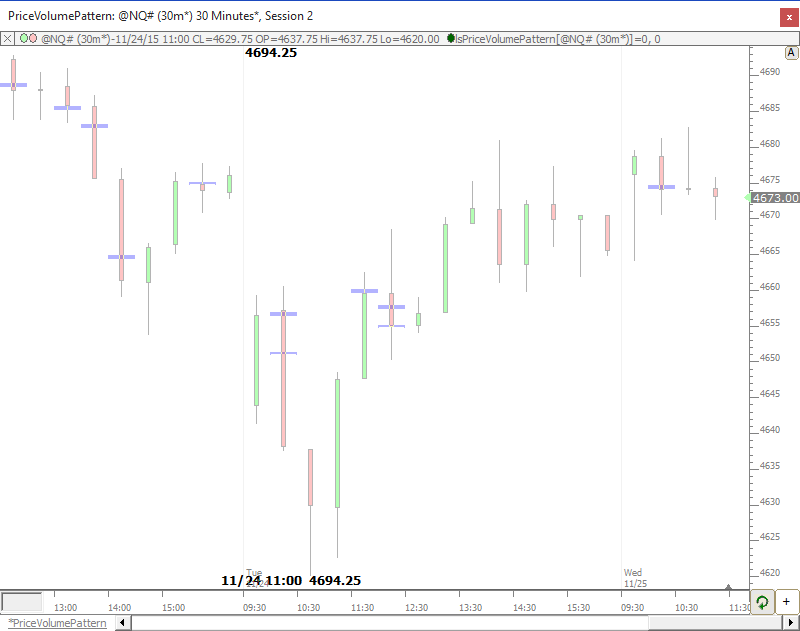
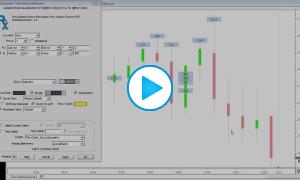
The PVP indicator features dynamic feedback display as the mouse pointer hovers over the high/low price range of a bar matching the pattern. The displayed values explain why the pattern matched the criteria. As a user option, PVP displays hover feedback only while the SHIFT key is held down as the mouse moves within the chart.

PVP is the RTL token for this RTX extension. An RTL signal or custom indicator can reference one or more PVP results. Thus RTL extends the power of PVP to enable detection of combinations of patterns, for example, patterns of interest that manifest in a series of bars.

Presentation

PVP Preferences

  • Location: Options available for High of Bar, Low of Bar, Highest, Lowest, or Any. High of Bar looks for the pattern to occur at the high of the bar with P1 looking at the highest price of the bar, P2 the price below that. Low of Bar looks for the pattern to occur at the lowest prices of the bar, with the lowest price listed in the preference window looking at the low price of the bar. Highest (price) looks for the highest occurrence of the pattern within the bar. Lowest looks for the lowest (price) occurrence within the bar. Any will identify any series of prices anywhere in the bar that meet the specified criteria, potentially identifying multiple series of prices within any given bar.
  • Prices: Options are availabe to identify 1, 2, or 3 price patterns.
  • P1, P2, and P3: P1 is always the highest price in the pattern. P2 will look at the price below P1 (if applicable) and P3 will look at the price below P2 (if applicable). P3 is only available for 3 price patterns. For a 3 price pattern at location "Low of Bar", P3 will be the critria used for the lowest price of the bar. P2 will be the criteria used for the price above the lowest price, and P1 the price above that.
  • Criteria: Each price, P1, P2, and P3, have a primary criteria and a secondary criteria. Both have these same options: [Volume , Ask Vol, Bid / Vol , Delta] [> , < , =] [Value, Volume, Ask Vol, Bid / Vol , Delta] [* , + , %] [Value]. Some common criterias may be: "Volume > Value 5000", "Bid Vol > Ask Vol * 1.30". When a secondary criteria is involved: "Volume > 5000 & Volume < 8000" or "Volume > 1000 & Bid Vol > Ask Vol * 2". For 3 price patterns, the criteria for P1, P2, and P3 must be all be met by a series of prices at the proper location specified.
  • Style: Several options are available for visually identifying the the prices that meet the criteria. The style will be drawn on each price within the series of prices. Options include Solid Box, Hollow Box, Dot, or Line as well as Custom version of each. Custom versions cut the bars width up into a user-specified number of slices and draws the style at the user specified offset from left. For instance, a Solid Box (Custom) with Slices: 5 and Offset: 3, will draw a box 1/5th the width of the full Solid Box and draw it right in the middle of the bar (3 slices into the 5 slices from left horizontally).
  • Border: An optional Border color is available to draw a border in a different color from the background.
  • Translucent: This option is useful when drawing Solid Boxes on top of bars instead of behind. It allows the bars to be seen through the solid boxes.
Price Volume Pattern Chart (RTX)
Price Volume Pattern is an RTX Extension designed to identify buy and sell volume-based patterns within a sequence of one or more prices within each bar. One-price, two-price and three-price patterns...

Read more Download

PVP Presentation (@ES#)
PVP Presenting New Drawing Options. This chart is explained in the video Price Volume Pattern - Understanding New Drawing Options. This chart was uploaded by Investor/RT 12.6.7 showing symbol: @ES#.

Read more Download

Pop-up Video Description View
Identifying Large Relative Volume at Price with PVP

Ths video demonstrate how to identify large volume at price relative to the average volume at...

 Watch
Price Volume Pattern - Filtering Patterns

This video explains how to filter the patterns shown to only bars which meet a given condition....

 Watch
Price Volume Pattern - Understanding New Drawing Options

This video explains the variety of custom drawing options available to Price Volume Pattern as...

 Watch
Using Chart Variables to Conveniently Control Imbalance Parameters within PVP

This video demonstrates the convenience of using chart variables with PVP when identifying...

 Watch
Identifying Buy and Selling Imbalance with Price Volume Pattern

This video demonstrates how to identify buying and selling imbalance easily and clearly with the...

 Watch
Understand PVP: Relative Prices

In this video on understanding PVP (Price Volume Patterns), we explore the concept of relative...

 Watch
Understanding PVP: Single Price and Clusters

In this video on Understanding PVP, we explore the Single Price and Clusters options of PVP. The...

 Watch
Price Volume Pattern Indicator (PVP) - Presentation Preferences (3 of 3)

This is the third video in a series of three on the Price Volume Pattern indicator being...

 Watch
Price Volume Pattern Indicator (PVP) - Data Preferences (2 of 3)

This is the second video in a series of three on the Price Volume Pattern indicator being...

 Watch
Price Volume Pattern Indicator (PVP) - Introduction (1 of 3)

Introduction to the Price Volume Pattern Indicator. This is the first video in a series of three...

 Watch