ExtremePriceHighlighter (RTX)

ExtremePriceHighlighter (EPH) RTX Extension requires the Volume Analysis Package and complements the order flow analysis of the VolumeScope® Package.

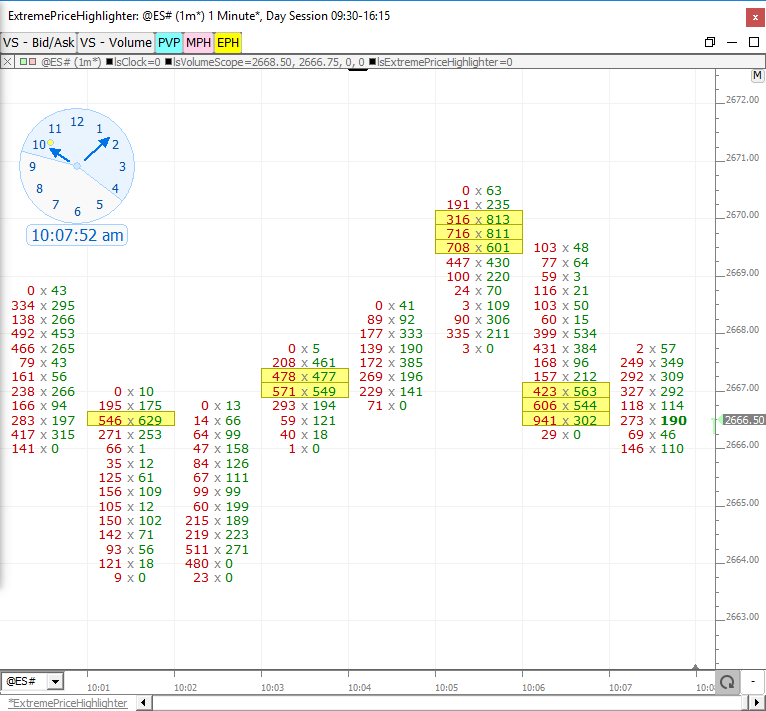
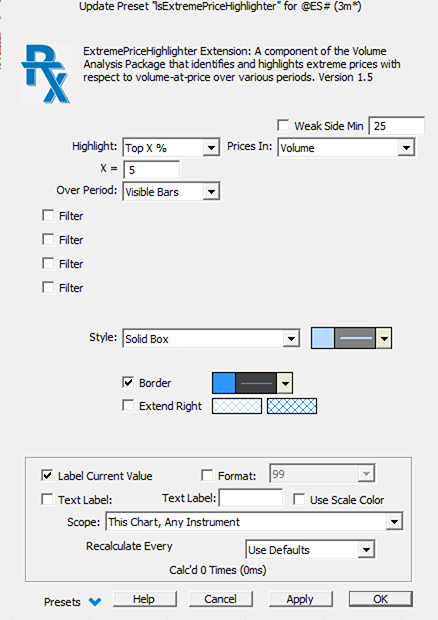
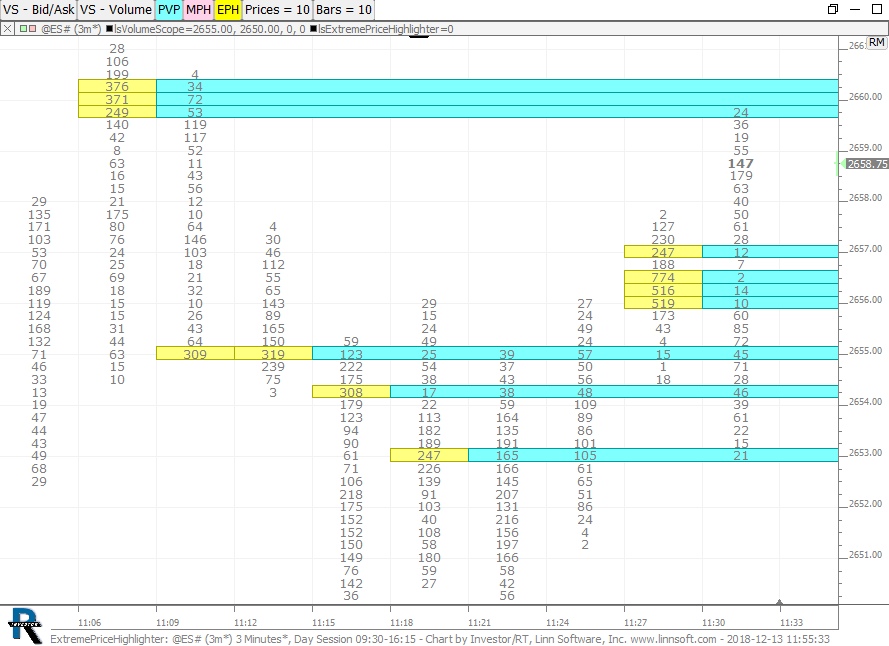
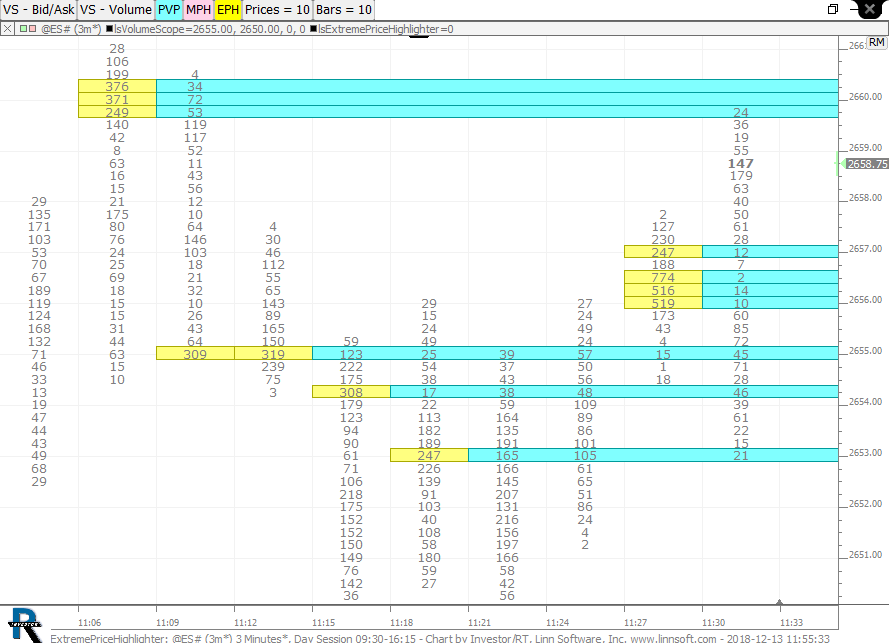
EPH operates on the volume-at-price data within each bar and finds the extreme prices over multi-bar periods with options including Last X Days, Last X Bars, and Visible Bars. When Visible Bars is selected, EPH identifies the extreme prices within the visible bars of the chart. The highlighting updates dynamically as you zoom or scroll the chart, or as new bars form in real-time. Highlighting options include Top X, Top X%, Bottom X, and Bottom X%. If EPH is set up to highlight the Top 5% of prices in the visible area, it will compute the number of prices touched in each bar, and sum those values. Specifically, if 20 bars were visible and each had a range of 10 prices (a 10 tick rangebar), then EPH would identify the 5% of the 200 prices with the highest volume; i.e., the ten highest volume prices in the chart would be highlighted.
In addition to volume, the following data options are available: Ask Vol, Bid Vol, Delta, |Delta|, Trades, Avg Size, Price, Buy Imbalance (Diff), Sell Imbalance (Diff), Buy Imbalance (%), and Sell Imbalance (%). When highlighting the Bottom X or Bottom X%, a setting is available to exclude the extreme X prices in each bar. For instance, if "exclude extreme 2 prices" is specified, the highest and lowest prices in each bar will be ignored (not considered for identification) since those are typically the lowest volume prices.

Presentation


Extreme Price Highlighter Prefs

  • Highlight - Options for highlighting include Top X, Top X %, Bottom X, and Bottom X % and serve to identify the top or bottom prices with respect to volume-at-price over the period specified.
  • Prices In (Data) - Volume-at-price data items available include: Volume, Ask Vol, Bid Vol, Delta, |Delta|, Trades, Avg Size, Price, Buy Imbalance (Diff), Sell Imbalance (Diff), Buy Imbalance (%), and Sell Imbalance (%).
  • Period - Periods include Visible Bars, Last Y Bars and Last Y Days.  When the period is Visible Bars, the prices are highlighted dynamically when visible bars change via scrolling, resizing, or zooming.
  • Style - Several options are available for visually identifying the the prices that meet the criteria. The style will be drawn on each price within the series of prices. Options include Solid Box, Hollow Box, Dot, or Line as well as Custom version of each. Custom versions cut the bars width up into a user-specified number of slices and draws the style at the user specified offset from left. For instance, a Solid Box (Custom) with Slices: 5 and Offset: 3, will draw a box 1/5th the width of the full Solid Box and draw it right in the middle of the bar (3 slices into the 5 slices from left horizontally).
  • Border - Optional border may be drawn around each highlighted price in the color and width specified by the border color control
  • Extend Right - When checked, extends all highlighted prices to the right of the chart with specified fill color (and border color if applicable).
ExtremePriceHighlighter (@ES#)
ExtremPriceHighlighter. This chart was uploaded by Investor/RT 13.5.12 showing symbol: @ES#.

Read more Download

Pop-up Video Description View
ExtremePriceHighlighter (RTX)

EPH operates on the volume-at-price data within each bar and finds the extreme prices over multi...

 Watch
Using Buttons to Control ExtremePriceHighlighter Variables

This video demonstrates how to use the Button Indicator to dynamically control key periods in...

 Watch