Relative Strength (RS)
The Relative Strength (RS) indicator measures how a symbol has performed compared with a base instrument over a chosen number of bars. It answers a simple question: over the last n bars, did the symbol in the chart go up more (or down less) than the base instrument, or the opposite ?
The indicator is usually used to compare a stock with its reference index (for example a Nasdaq stock against the Nasdaq Composite, or any stock against the S&P 500), or to compare two related instruments such as the E-mini Nasdaq-100 (NQ) and E-mini S&P 500 (ES) futures.
Formula
RS = ( (CLa / CLb) - (CLa[n] / CLb[n]) ) / (CLa[n] / CLb[n])
where CLa is the closing price of the instrument in the chart, CLb is the closing price of the base instrument, and [n] means the value n bars ago (n is the RS Period).
The formula works in three steps:
- It divides the price of the chart instrument by the price of the base instrument. This ratio (CLa / CLb) goes up when the chart instrument does better than the base instrument, and goes down when it does worse.
- It compares the current ratio with the ratio n bars ago.
- It expresses that change as a fraction of the old ratio. The result is the percent change of the ratio over the last n bars.
In practice, the RS value is very close to the difference between the percent change of the two instruments over the last n bars. The exact relation is:
RS = (1 + return of chart instrument) / (1 + return of base instrument) - 1
Worked example
Over the last 20 bars, NQ moves from 20000 to 20200 (+1.0%), and ES moves from 5000 to 5025 (+0.5%).
- Ratio now: 20200 / 5025 = 4.0199
- Ratio 20 bars ago: 20000 / 5000 = 4.0000
- RS = (4.0199 - 4.0000) / 4.0000 = 0.005, or about 0.5%
NQ gained about 0.5% more than ES over those 20 bars, so the RS value is positive.
How to read the RS line
- Above zero: the chart instrument did better than the base instrument over the last n bars. It either gained more, or lost less. On a down move, a positive RS means the chart instrument fell less than the base, not that it went up.
- Below zero: the base instrument did better than the chart instrument.
- Near zero: both instruments moved by about the same percent.
- Rising or falling line: a rising line means the outperformance of the chart instrument is growing; a falling line means it is fading or turning into underperformance. The direction of the line is often more useful than its level.
Because the value is based on a percent change of the ratio, it moves around the zero line most of the time and only moves far away from zero when the two instruments behave very differently.
Adding the indicator to a chart
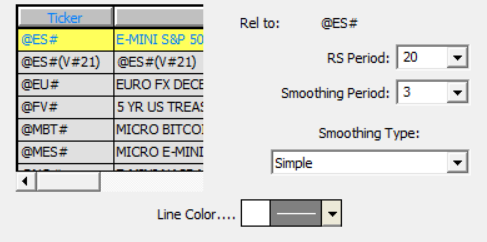
Open a chart of the instrument you want to study, click the "Add Technical Indicator" button in the charting toolbar, and choose "Relative Strength" from the indicator list. In the settings window, select the base instrument in the instrument list on the left, set the RS Period and, if needed, a smoothing period, and click "OK".
Example: NQ against ES
On a 3-minute chart of NQ, add the RS indicator with "Rel to" set to ES, an RS Period of 20 (which covers the last 60 minutes) and a smoothing period of 3. A positive and rising line shows that NQ is leading the move; a negative and falling line shows that ES is leading.
Keep in mind that NQ usually moves more than ES in percent terms, because it is more concentrated in large technology stocks. On a strong rally, RS on NQ will tend to rise even without real relative strength, and on a strong decline it will tend to fall. Comparing the RS reading with the Beta value from the Alpha/Beta indicator helps to separate real outperformance from this normal effect of higher volatility.
Please note that trading strategies will often combine RS with the Correlation Coefficient (COR). Unlike the Correlation Coefficient (COR), where the bar-to-bar change (CL-CL.1) is the preferred input, the Relative Strength indicator is always calculated on closing prices. This is because the RS formula already measures change: it compares the price ratio of the two instruments now with the ratio n bars ago, so the result is a difference in percent returns, not a comparison of price levels. Using bar-to-bar changes as input would not work, because the formula divides one instrument by the other, and the bar-to-bar change of the base instrument is often zero or negative. To see the relative performance of the two instruments on each single bar, set the RS Period to 1, and use the Smoothing Period to reduce the noise."
Presentation
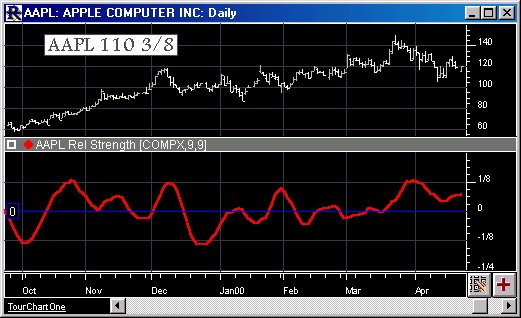
Above is a Daily Chart of the Apple Computers (AAPL). The bold red line in the lower window pane corresponds to the Relative Strength of AAPL relative to COMPX (Nasdaq). The settings correspond to those set in the preferences below.