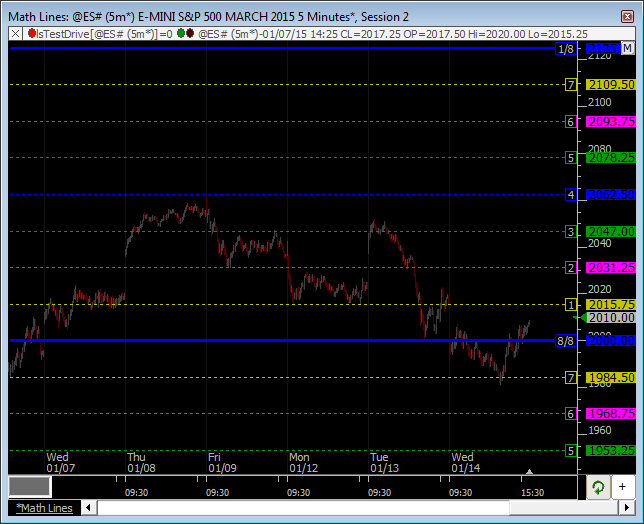
The Investor/RT Math Lines Indicator is the Linn Software implementation of the popular Murrey Math Lines. The Math Lines indicator produces a series of equidistant price-based support and resistance levels. Each level is labeled from 1/8 thru 8/8. The 8/8 (or 0/8) lines are considered the most difficult to break. 1/8 and 7/8 lines are considered weak support and resistance. 2/8 and 6/8 lines are considered strong reverse points. 3/8 and 5/8 are considered areas where it is very likely that the price will either pierce this range fast or will remain inside it for a long time. 4/8 is considered a major support and resistance line and it is recommended to trade in the direction it crosses.
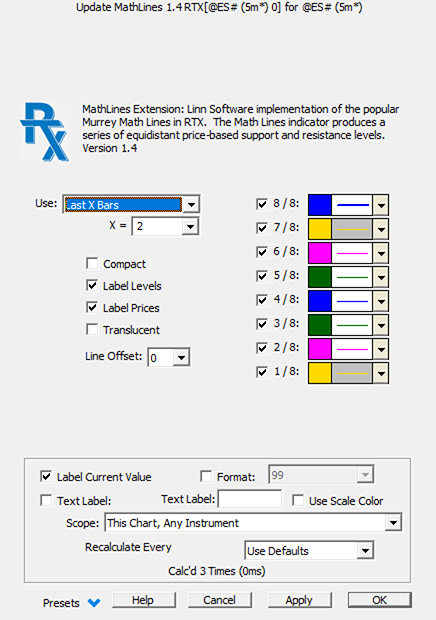
The lines themselves are computed based on recent price range. There are several options available to the user with respect to which range is used including: Last X Bars, Last X Days, All Data, and Visible Data. In addition, the user has an option to specify the distance between lines in multiples of tick increment with "X Tick Increment".
This indicator is now available as an RTX Extension. The RTX edition of the Math Lines provides user options for each of the Math Lines color, width, and style. To download and install, click the Installer tab above.
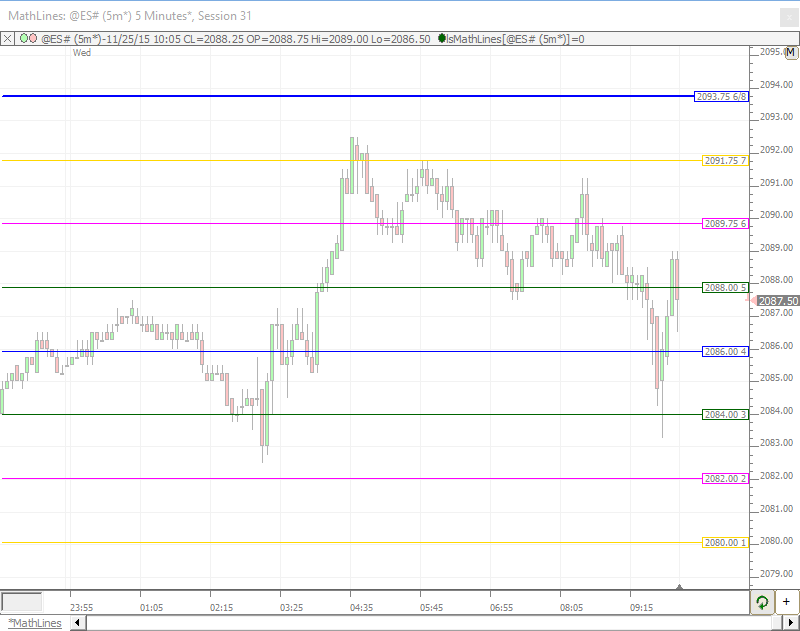
Presentation