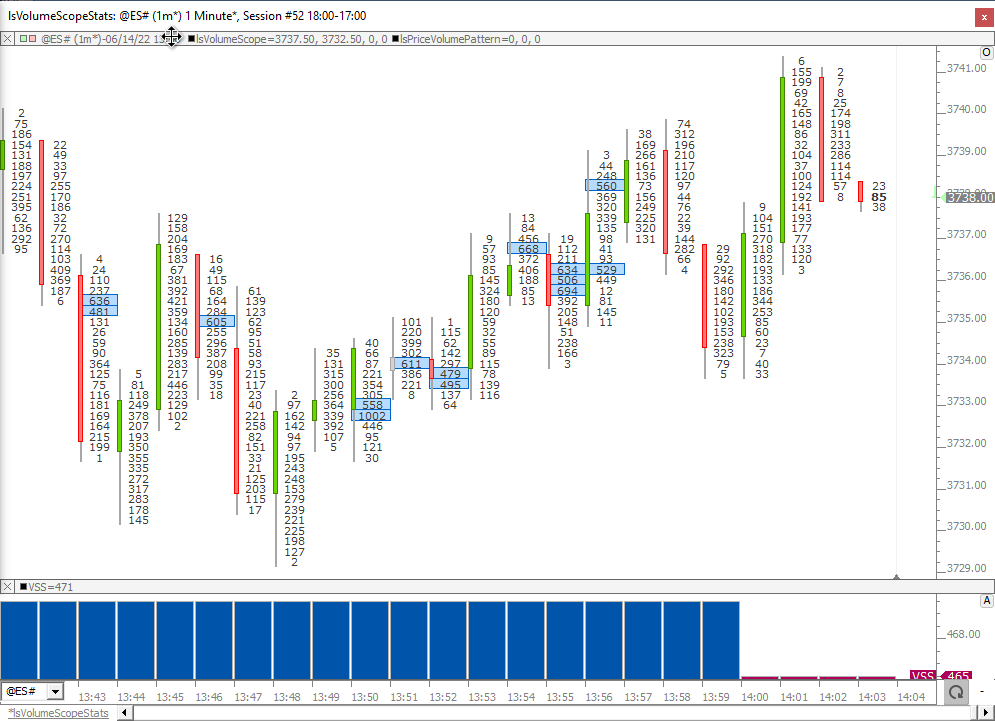
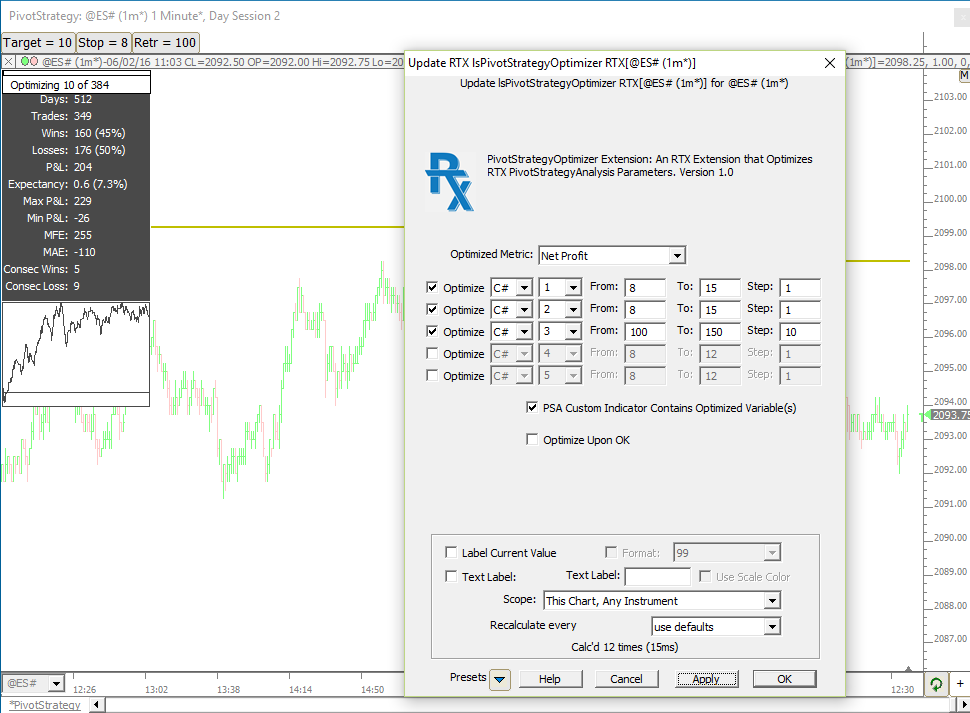
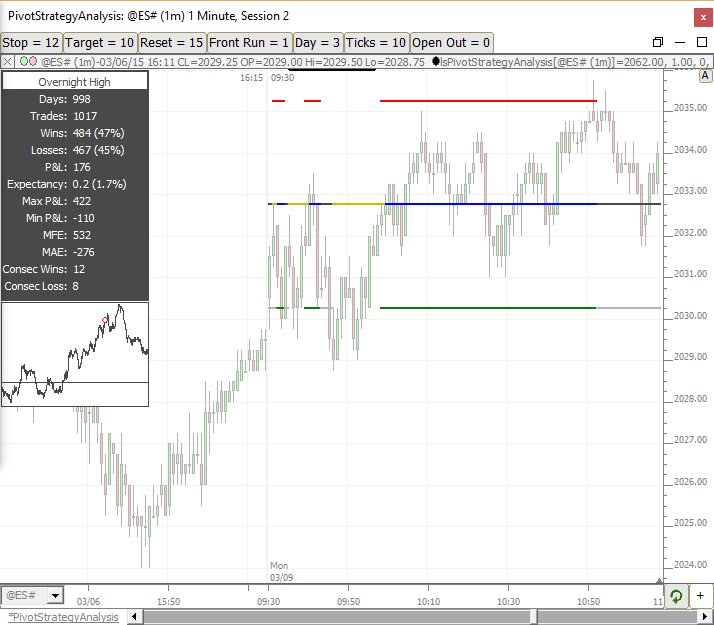
Core

Features and indicators that represent the Core Functionality of Investor/RT.

VolumeScopeStats (RTX)

This VolumeScopeStats (VSS) RTX Indicator is designed to compute volume-at-price statistics that are sensitive to both time of day and periodicity of the chart. This allows users to compute and identify values of significant volume or delta at price throughout the day with statistics based on the volume-at-price of the same time of day over previous session. 

TrendTool (RTX)

TrendTool is an RTX Extension for easily drawing and editing trendlines on instruments. TrendTool does not replace the long standing Trendline indicator in Investor/RT. Think of it as a companion tool that you may prefer to use sometimes. Some may use it most of the time. TrendTool was developed using the RTX development tools. As a result, TrendTool trend lines can be edited using convenient keyboard shortcuts and mouse actions.

SampleRTX (RTX)

A sample RTX extension that draws a trendline showing the maximum price excursion within the visible portion of the chart. Zoom the chart in/out using mouse wheel and the trendline will redraw for the visible bars. Changing periodicity also affects the visible bars; the SampleRTX will adjust to new visible bars of the new periodicity. For those interested in RTX development, source code is provided for this RTX in the InvestorRT\rtx\lsSampleRTX directory.

SlopeLines (RTX)

Trendlines are one of the basic trading tools used to follow trends in market data. They are easy to draw in Investor/RT using the trendline drawing tool: click on a starting point; drag and drop on the ending point. Investor/RT has some trendline automation features as well that attempt to determine the current trend and auto draw lines to depict the trend. Introducing SlopeLines - a new tool that takes trendline automation to the limit.

True Strength Squeeze (RTX)

The TrueStrengthSqueeze (RTX) Indicator combines the True Strength Index with the Squeeze Indicator.  The True Strength Index attemps to show both trend direction and overbought or oversold conditions using double-smoothing of momentum relative to double-smoothing of the absolute value of momentum.  The Squeeze Indicator identies when the Bollinger Bands are within the Keltner Channel.  Both Bollinger Bands and Keltner Channels center about a moving average of the close with the Bollinger Bands using a multiple of standard deviations and the Keltner Channels using a multiple of Average True

Pivot Strategy Optimizer (RTX)

The PivotStrategyOptimizer (PSO) builds upon the PivotStrategyAnalysis (PSA) indicator to create an extremely powerful combination. PSO enables the optimization of any combination of a number of variables within PSA, allowing the user to quickly determine the optimal combination of values which would have resulted in maximized profits. PSO can optimize the target, stop, reset distance, frontrun wiggle, allowable trading hours, number of allowable trades/day, or an infinite array of other variables within the custom indicator upon which the PSA is based.

Paint Candles (RTX)

The PaintCandles RTX Extension decorates candlesticks in a variety of ways. The user may choose to decorate all candles or just those candles that meet a specific condition determined by an RTL Signal . Decoration options include the width in pixels, the Position relative to the candle (in pixels offset from candle) and whether to draw inside or outside of the candle.  Up to 4 painting options are available in each instance of PaintCandles, one to decorate all candles and three options to decorate candles based on an RTL Signal being true for that candle (bar).

Pivot Strategy Analysis (RTX)

The PivotStrategyAnalysis (PSA) RTX Extension allows the user to specify any key daily or weekly price level such as previous high, previous close, or overnight VPOC, and analyze the effectiveness of that level as a pivot point during the following session or week.  The indicator provides for a variety of convenient options including stop, target, frontrun wiggle, reset distance, nature of system, trade limits, and time filters.  The frontrun wiggle determines how far ahead of the level, if any, to enter the trade (defaults to 0).

FlexLevels® (RTX)

The FlexLevels® Indicator facilitates the sharing of key price levels for one or more instruments among a group of Investor/RT users. An educator or trading room mentor or an individual trader first creates a chart with the instrument(s) and the desired reference lines he wishes to share.  Using File > Functions > Export FlexLevels, the price levels are exported to a compact text file (a .csv file).  The exported file contains all of the information about each line/level including: price, label, color, width, position details, and band details, if applicable. 

Pages