Core

Features and indicators that represent the Core Functionality of Investor/RT.

Sine Wave (RTX)

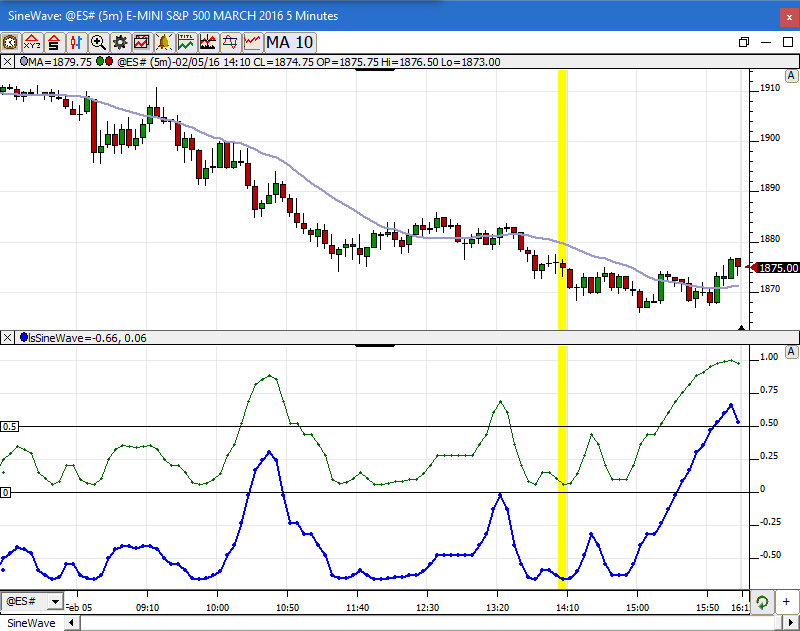
The SineWave RTX extension is the RTX implementation of the Ehlers Sine Wave indicator. See Cybernetic Analysis for Stocks and Futures by John Ehlers. Two forms of the indicator are supported, known as the CyberneticsAnalysis and RocketScience method, selectable as a user preference.

ScatterPlot (RTX)

ScatterPlot takes two custom indicators and plots one on the horizontal (X Axis) and one on the vertical (Y Axis) and then computes a best fit polynomial regression line through the data of user-specified degree. Any two custom indicators may be used for the data set of this analysis. Each data point represents the values of the two custom indicators on any given bar. Each bar is drawn as a point/dot in the scatter plot. For example, the indicator can plot the daily volume versus the daily range in price.

HolidayTree (RTX)

Got your tree up yet?

You stare at your charts all day. Why not spruce them up with a little holiday cheer? Introducing Holiday Tree (RTX), a whimsical indicator written with RTX that adorns any chart with a holiday tree, complete with twinkling lights, ornaments, garland, holiday countdown, customizable sizes and colors.

Double Top (RTX)

The Double Top RTX extension identifies double tops and bottoms and extends the lines until they are taken out by a future bar. User parameters control the look back period (in bars) and the minimum pullback (in ticks) and the minimum spread (in bars) necessary to detect adjacent tops (and bottoms).

Price Time Highlighter (RTX)

The Price Time Highlighter provides highly customizable highlighting of price (range) and bar(s) inside any chart pane with user specified color settings.

Session Prices (RTX)

The Session Prices RTX extension calculates common price levels of interest on up to three different sessions independent of the session used by the chart. These types of calculations have been available in Investor/RT for some time but each line required its own instance of the Session Statistic indicator and perhaps the MPD indicator, making management of many lines difficult.

Clear (RTX)

The Clear RTX Extension is an implementation of the Clear Method, a method for determining short term swing direction, described by Ron Black in his 2010 article in Stocks and Commodities Magazine titled Getting Clear With Short-Term Swings. The indicator can be plotted on any timeframe. RTX Clear produces a color coded output line showing the current swing direction and produces a signal on any bar when the direction reverses. During an up swing, if price penetrates (clears) the highest low of the move, the swing remains intact, otherwise a down swing begins.

Chartmill Value Indicator (RTX)

The Chartmill Value Indicator(CVI) appeared in the January 2013 issue of Technical Analysis of Stocks and Commodities. The article was written by Dirk Vandycke. The CVI represents a standard deviation from a moving average, which can be applied to any price series over any period. The concept is simple. As prices rise, they will eventually rise above a moving average. Eventually, the moving average will begin to rise as well. At this point, prices need to continue to rise to increase the spread between the current price and the underlying moving average.

Moving Average Ribbons (RTX)

The Moving Average Ribbons Indicator allows users to set an initial Moving Average Period (Period Start) along with the desired number of Moving Average Lines (Lines) and the amount that each subsequent Moving Average should be incremented as it is added to the chart (Period Inc.). The general interpretation of this Indicator is that when all the averages are moving in the same direction, the trend is said to be strong. Reversals are confirmed when the averages crossover and head in the opposite direction.

Trading Rule Indicator

The Trading Rule Indicator operating inside a chart tests a user-specified trading signal. When the trading signal fires true, the trading rule indicator executes a user-specified trading order.

Pages