Core

Features and indicators that represent the Core Functionality of Investor/RT.

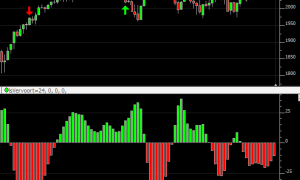
Vervoort Oscillator (RTX)

In his article "The Quest For Reliable Crossovers" (Stocks and Commodities Magazine, May 2008) author Sylvain Vervoort explains a trading method using the crosses of two moving averages: a zero-lag triple exponential moving average of the typical price HLC/3 and the Heiken-Ashi Close. The Vervoort Oscillator plots the difference between these averages. Vervoort recommended a 55 period average (1 period look back) on daily charts.

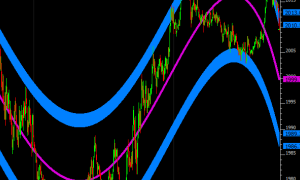
Polynomial Regression Channel (RTX)

Polynomial Regression Channel (PRC) is an RTX Extension indicator that draws a best fit n-degree polynomial regression line through a recent period of data. Setup parameters for the indicator include the degree of the polynomial (1 - 6) and number of bars to analyze. Bands are drawn above and below the regression line between two user-specified multiples of standard deviation. The bands self adjust for volatility.

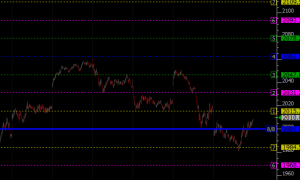
Math Lines (RTX)

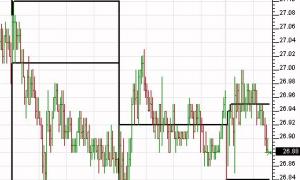
The Investor/RT Math Lines Indicator is the Linn Software implementation of the popular Murrey Math Lines. The Math Lines indicator produces a series of equidistant price-based support and resistance levels. Each level is labeled from 1/8 thru 8/8. The 8/8 (or 0/8) lines are considered the most difficult to break. 1/8 and 7/8 lines are considered weak support and resistance. 2/8 and 6/8 lines are considered strong reverse points. 3/8 and 5/8 are considered areas where it is very likely that the price will either pierce this range fast or will remain inside it for a long time.

RTL - Investor/RT Language

RTL is the Investor/RT Language, a formula language for composing trading signals, custom indicators, and scans. RTL is an end user language, designed to be used by those with little or no programming skills. RTL is used to write a formula. A formula may be a true/false condition, e.g. CLOSE < MA, that determines whether some condition is true or not for each bar (a signal) or the last bar (a scan). A formula may compute an arithmetic result, called a custom indicator. For example: MA ( HIGH - CLOSE ) computes a moving average of how far an instrument closes from its high. As you can see, RTL is more expressive, simpler, and easier to use than other market data languagues.

Zig Zag Indicator (ZIG)

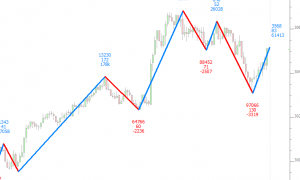
The Zig Zag Indicator is a series of trendlines that connect significant tops and bottoms on a price chart. The Minimum Price Change parameter specifies the percentage that the price must move in order to form a new zig or zag leg. It can be used to identify potential chart patterns and Elliot Wave formations.

The Minimum Price Change setting of the Zig Zag and Zig Zag Oscillator indicators can be expressed in absolute dollars ($) in addition to percent (%)

Session Statistics (SESST)

The Session Statistics Indicator computes historical statistics for an instrument or an indicator. The The Session Statistics preferences use the general format: [Statistic] of [Price] of the [First/Last] X [Minutes/Bars] of the Session The Statistic options include:

Pages