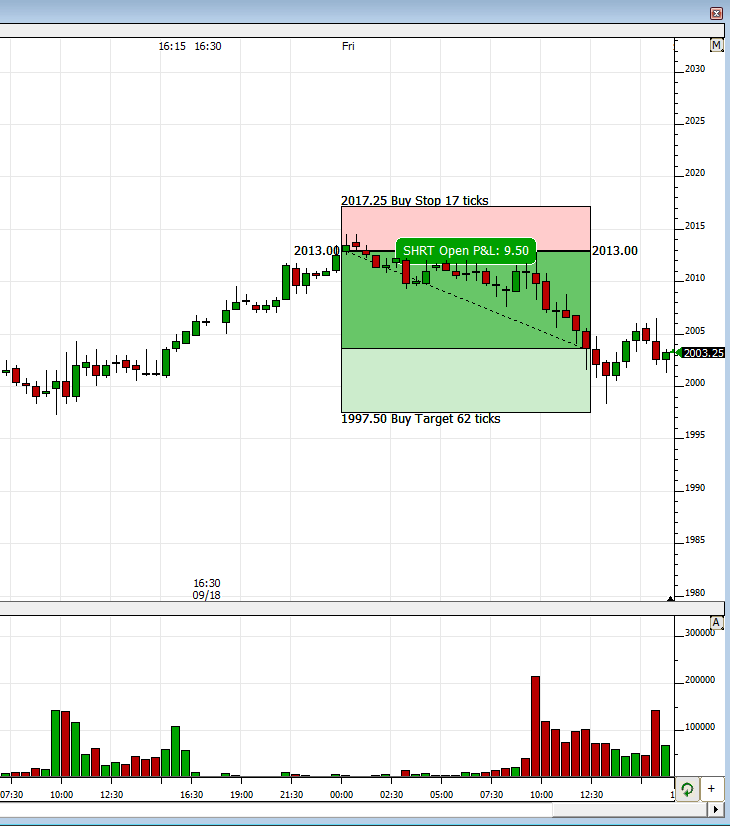
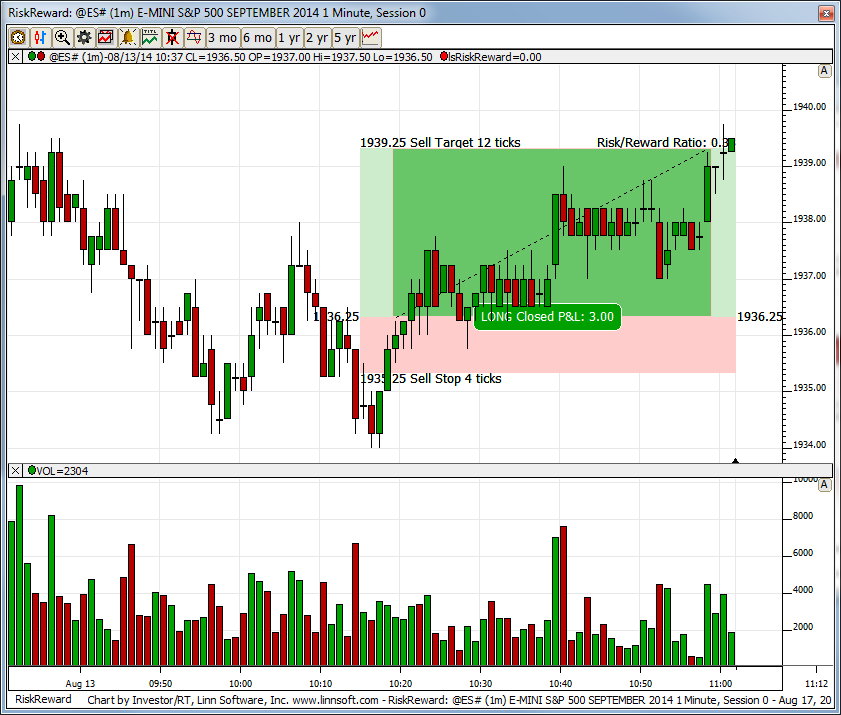
The Risk Reward Tool makes it possible to drag and drop a potential long or short trade to analyze the following:
- The entry and exit price.
- Risk associated with the trade.
- Reward associated with the trade.
- Whether the trade is or would be still open based on the target and stop loss prices used.
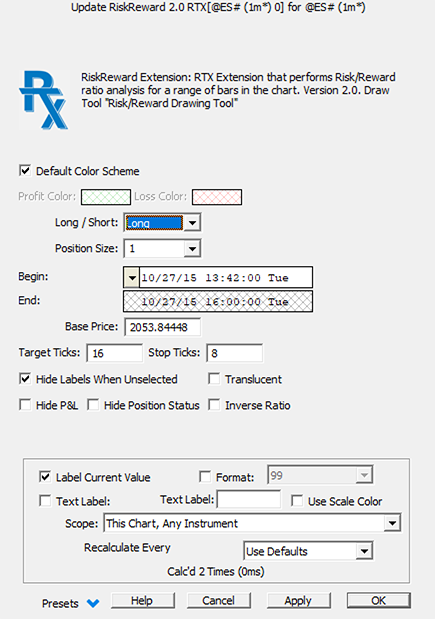
All sides of the Indicator, including the corners are hotspots that allow the user to hover, drag and adjust. Alternatively, they are also adjustable by Keyboard adjustement (see Keyboard Shortcuts below). To add the indicator to a chart using the mouse, right-click in the chart and choose Draw > RIsk Reward. Then mouse down at the entry price and trace out a rectangle for the range of bars to study.
After adding a Risk Reward indicator to your chart and adjusting the preferences, right-click on the Risk Reward box and choose "Add Button". That will then add a button to your chart which will invoke a rectangle drawing tool allowing you to quickly drop a Risk Reward box around any group of bars and prices. Once dropping the Risk Reward, select it and use the keyboard shortcuts documented below for fine tuning.
Keyboard Adjustments when the Risk Reward rectangle is selected in the chart:
Right or Left Arrow
- Alone - Move Entire Risk/Reward Rectangle Right or Left
- with Control Key Down - Expands/Contracts right side (ending bar) of the Indicator
- with Shift Key Down - Expands/Contracts left side (beginning bar) of the Indicator
Up or Down Arrow (Mouse Wheel)
- Alone - Move Entire Risk/Reward Rectangle Up or Down
- with Control Key Down - Expands/Contracts top side of the Indicator
- with Shift Key Down - Expands/Contracts bottom side of the Indicator
- with Shift and Control Key Down - Moves entry price (center line) up or down.
In the Risk/Reward preferences there is a check box titled Hide Labels when Unselected. When checked, the price and other feedback labels will be visible only when you hover the mouse over the risk reward rectangle or have the indicator selected in the charts.
Presentation