TINT

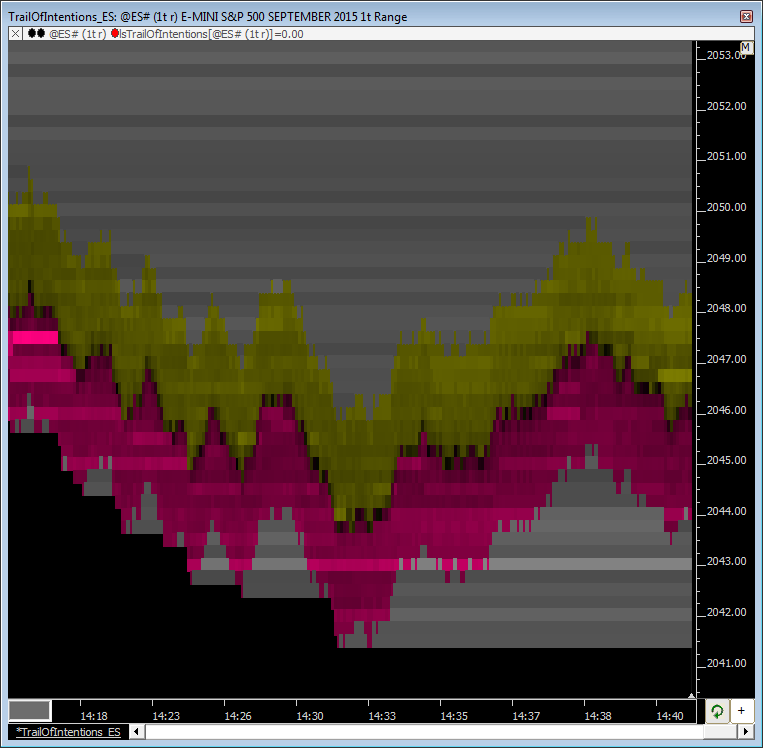
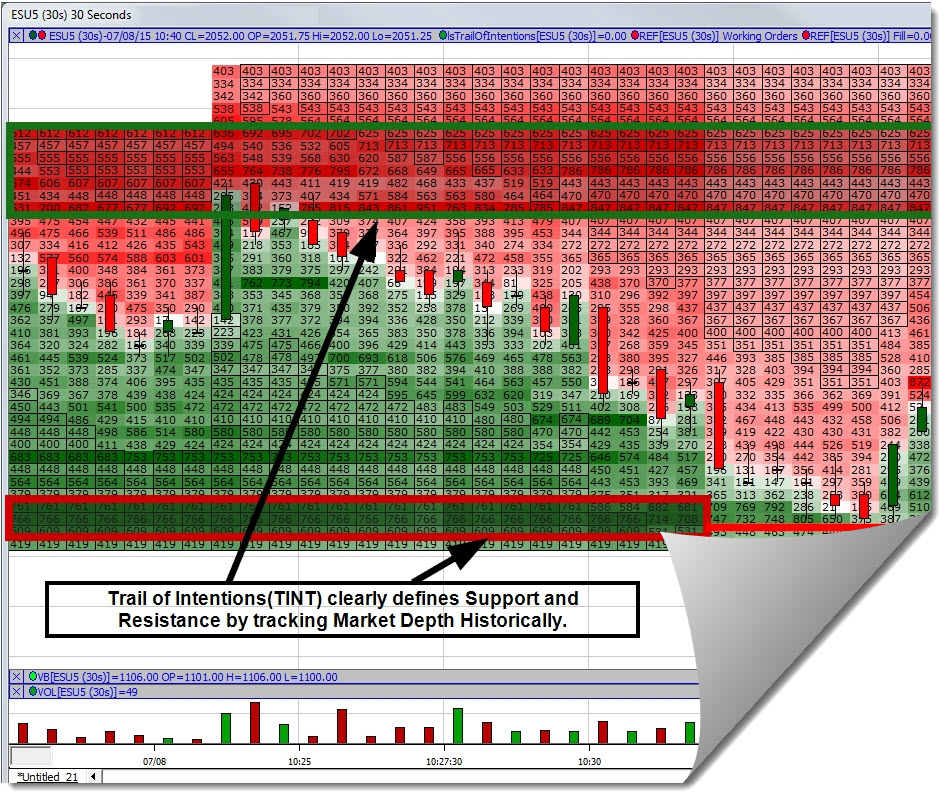
Resting Order Candles

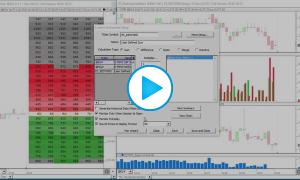
This video demonstrates how to plot the resting orders (full size on the book/depth) historically as candles or bars. This same concept can be used to create bars which plot the sum of resting orders on the bid or the ask, or even the total on the 3 inside bid prices, the 5 inside ask prices. A great deal of flexibility in this area is provided by the Trail of Intentions indicator.

Trail of Intentions Chart (RTX)

Trail of Intentions (TINT) is an RTX Extension designed to display historical snapshots of the depth of market. The market depth provides numeric insight into the intention of traders to buy and sell at various prices. TINT provides a wealth of options to visually identify relative size and changes in sizes among prices within same snapshot or from snapshot to snapshot over time.

Trail Of Intentions (TINT): Introduction

Trail Of Intentions (TINT): Introduction

Trail of Intentions (TINT) is an RTX Extension indicator designed to display historical snapshots of the depth of market. TINT provides a wealth of options to visually identify relative size and changes in sizes among prices within same snapshot or from snapshot to snapshot over time. Users may customize the shading of the background of each price to reflect size or change in size of each price. Optional text may be displayed at each price showing size, change in size, size inside, or size outside (sum of size at or outside any given price).

Trail of Intentions (RTX)

Trail of Intentions (TINT) is an RTX Extension designed to display historical snapshots of the depth of market (order book). The market depth provides numeric insight into the intention of traders to buy and sell at various prices. TINT provides a wealth of options to visually identify relative size and changes in sizes among prices within same snapshot or from snapshot to snapshot over time.