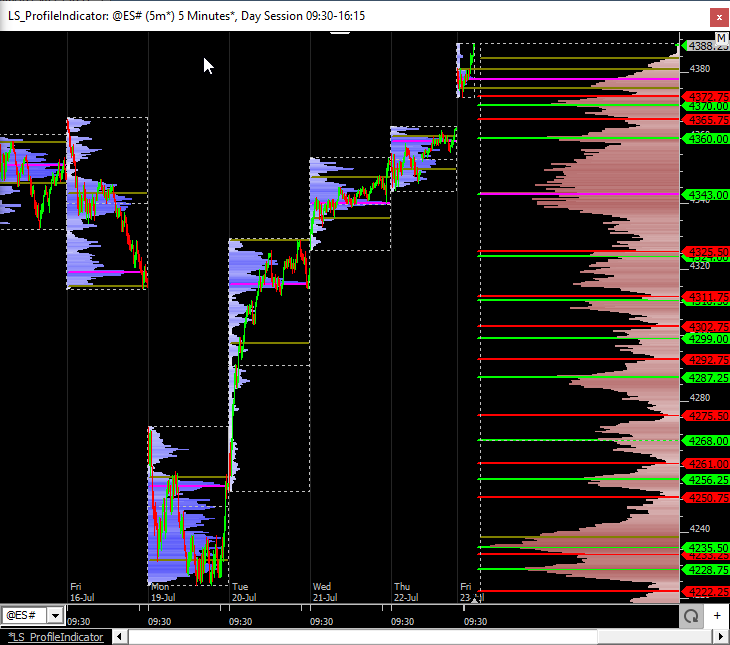
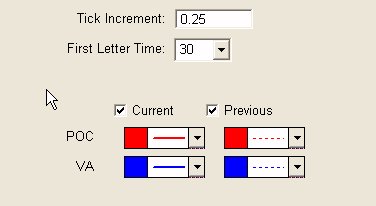
Volume Based

Profile Indicator (PROF)

The Profile indicator enables the user to overlay a price-based profile over a multi-pane intraday chart. The Profile provides a "Price/Row" preference which dictates the height of each row. The width of each resulting row will represent how many bars during the session in which that row's price range was touched. If the periodicity of the chart is 5-minute, and the width of a row is 3 bars wide, then the range of three of the 5-minute bars for that session actually overlapped the price range of that row. The widest row is called the Point of Control (POC). The Value Area (VA) is commonly considered the area in which 70% of the price action transpired. This percent level is adjustable, as some prefer to use alternate VA % levels such as 80%. Options for drawing the current and previous POC and VA lines are provided in the Profile preferences. Another option dictates how many sessions for which the Profile will be computed and displayed. The Profile may be drawn as Solid or Hollow Blocks, Solid or Hollow Ovals, Dots, or Lines. A "Hide Profile" checkbox gives the user the ability to hide the actual profile and draw only current and/or previous POD and VA lines. The "Current" and "Previous" POC and VA lines are also optional, as well as VA and POC labeling.

Percent Change Volume or Price

The Percent Change Indicator calculates and draws a line showing the n-period percent change in either volume or price for an instrument. The indicator oscillates around zero with positive values indicating increasing prices (or volume) and negative values indicating declining prices (or volume). If you wish to see both percent change to volume and percent change in price in the same chart, apply the indicator multiple times , once with "Price" check marked, and again with "Volume" check marked. You can add both to the same chart window pane if you like.

On Balance Volume

The On Balance Volume (OBV) for an n-day period is defined as the sum of all volumes for up days minus all volumes for down days. An up day is one where the price closed higher or the same as the previous day. The On Balance Volume study calculates the n-day OBV for each day and charts it as a line or histogram which can oscillate around the zero line.

Open Interest Analysis

Add this indicator with a period of 1 to see the open interest for futures and options contracts. The open interest may be displayed as a line or a histogram. Specify a period greater than one to see a smoothed open interest line or histogram.

Money Flow Index (MFI)

The Money Flow Index creates a ratio of Positive Money Flow and Negative Money Flow over time and scales it to a number between 0 and 100. The MFI value can be used to evaluate overbought and oversold conditions in a security the index moves above or below a certain reference level (Investor/RT defaults to 80 for overbought and 20 for oversold). Divergence between MFI and the price direction can also be indicative of a reversal. If price is trending higher and MFI is decreasing over that period, a market top may occur.

Money Flow Indicator (MF)

The Money Flow Indicator keeps a running total of the money flowing into and out of a security. Money flow (MF) is calculated by multiplying the number of shares traded by the change in closing price. If prices close higher, money flow increases (by an amount equal to average price * volume / volume divisor). If prices close lower, money flow decreases (by an amount equal to average price * volume / volume divisor). Average price is equal to the average of the high, low, and closing prices. A running total is kept by adding or subtracting the current result from the previous total.

Money Flow (MFLO)

A technical indicator that keeps a running total of the money flowing into and out of a security. Money flow (MF) is calculated by multiplying the number of shares traded by the change in closing price. If prices close higher, money flow increases (by an amount equal to average price * volume / volume divisor). If prices close lower, money flow decreases (by an amount equal to average price * volume / volume divisor). Average price is equal to the average of the high, low, and closing prices. A running total is kept by adding or subtracting the current result from the previous total.

Finite Volume Elements

The Finite Volume Element Indicator (FVE) was developed by Markos Katsanos and introduced in the April 2003 issue of Technical Analysis of Stocks & Commodities magazine. It was modified for volatility in the September 2003 issue of TASC.

FVE is a money flow indicator but with two important differences from existing money flow indicators:

Elastic Volume Weighted Moving Average (eVWMA)

eVWMA is a statistical measure using the volume to define the period of the moving average. It incorporates volume information in a natural and logical way. The eVWMA can be looked at as an approximation to the average price paid per share. The ability to "Use Average Volume" as your volume period, makes this indicator both symbol-independent and timeframe independent. This allows the use to switch both timeframe and symbol without having to change the volume period.

Elder's Force Index (EFI)

The Elder's Force Index uses volume and price change from previous close to determine the momentum behind a price move in a given direction. An increasing Force Index is indicative of strong interest in the direction of the price move while a decreasing Force Index suggests that price is moving counter to the major trend. It is calculated by exponentially smoothing the product of volume and the difference in price from previous close to current close. The default period in Investor/RT is 2 as suggested by the indicator's author, Alexander Elder.

Pages