Volume Candles (RTX)
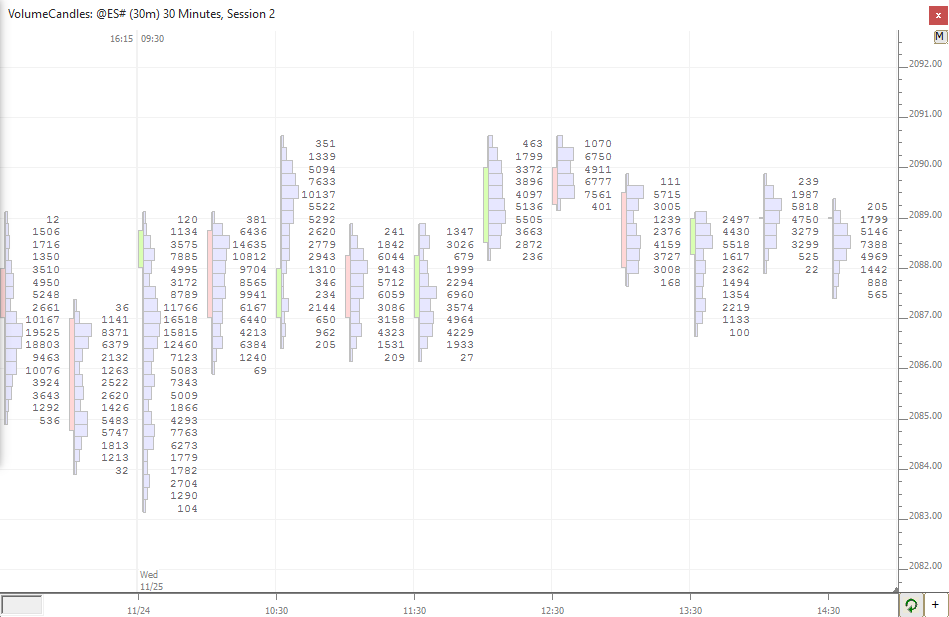
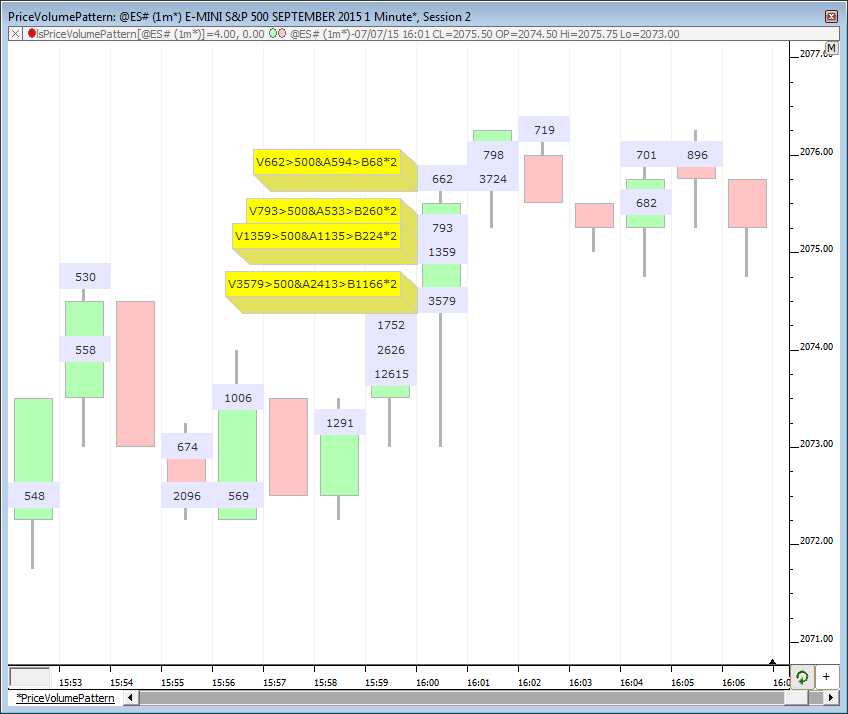
Volume Candles draws a candle, volume profile, and volume as text, for each bar, making efficient use of the horizontal space available for each bar. It is recommended to set the drawing style of the instrument to "Invisible" and then add the VolumeCandles to the instrument pane to replace the bars. Each of the 3 elements is optional, giving users the ability to plot candles with volume profiles, volumes with volume as text, etc. User must ensure there is enough room vertically and horizontally to properly display elements. To create more horizontal space, use the mouse scrollbar (or up/down arrow keys on keyboard). To create more vertical space, use the mouse scrollbar while holding down the shift key.