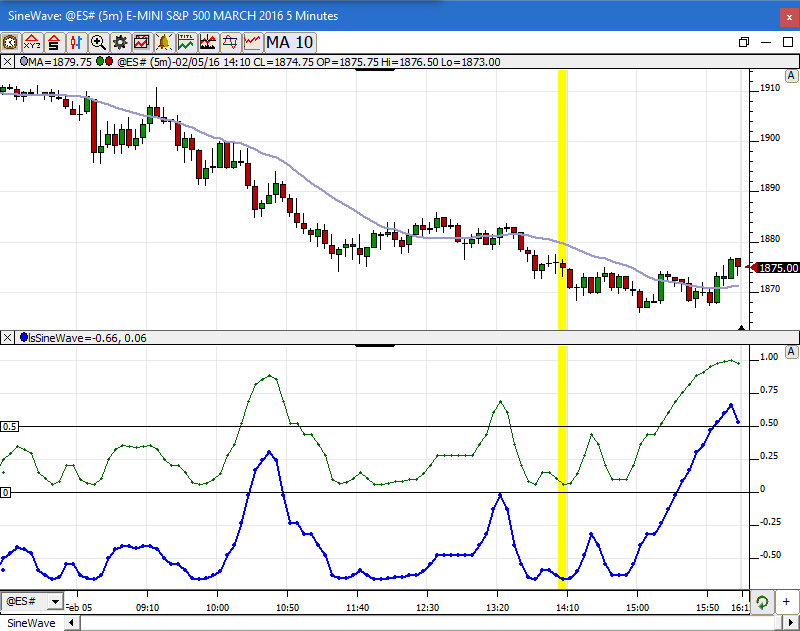
The SineWave RTX extension is the RTX implementation of the Ehlers Sine Wave indicator. See Cybernetic Analysis for Stocks and Futures by John Ehlers. Two...
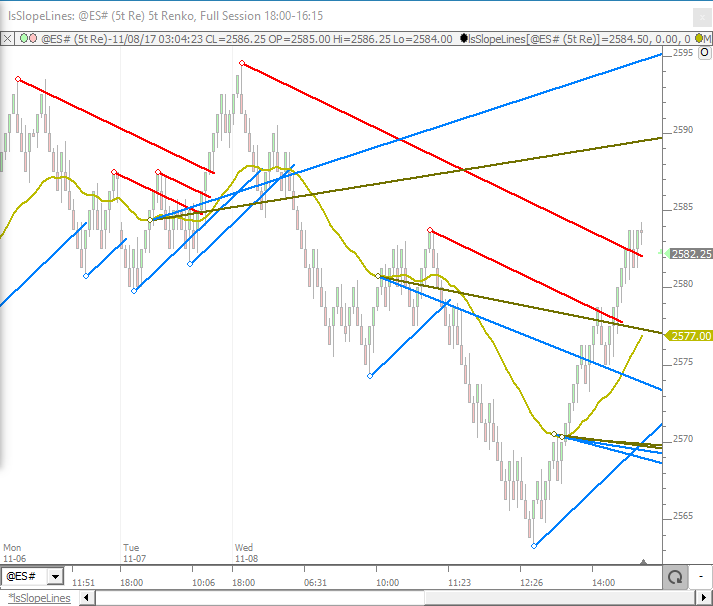
Trendlines are one of the basic trading tools used to follow trends in market data. They are easy to draw in Investor/RT using the trendline drawing tool:...
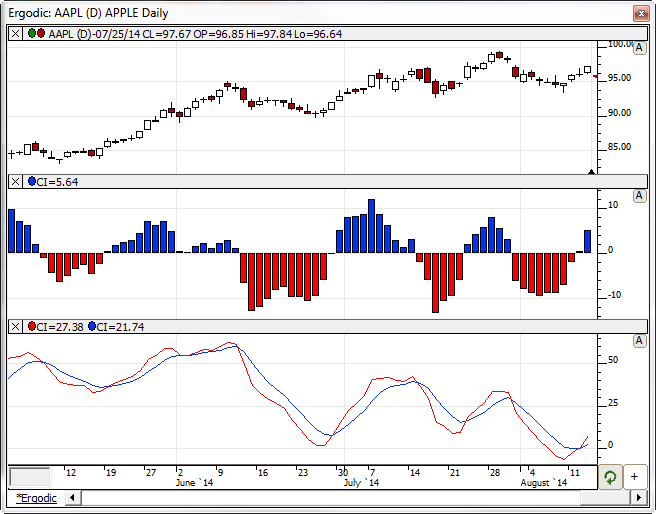
Trading Ergodics with the Trend - Rules Enter or hold position only when slope of Ergodic Signal line has the same direction as the trend Stand aside...
The Spiral indicator (also know as the "Logarithmic Spiral") provides a link between price and time analysis, and can help in forecasting both price and time....
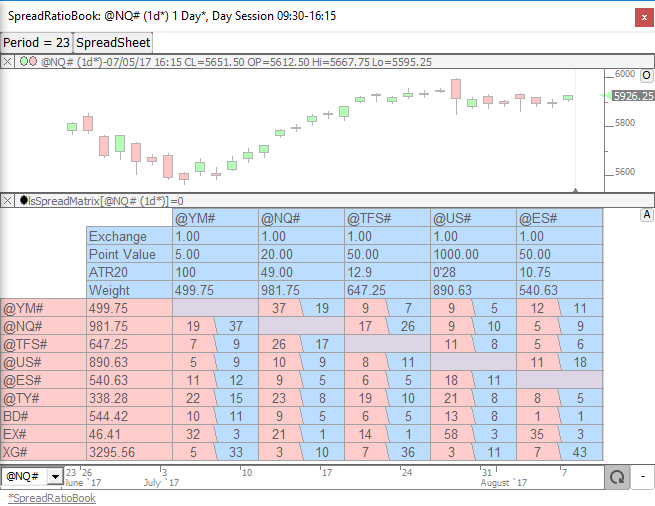
The Spread Matrix RTX extension is designed to automatically compute the optimal number of contracts or shares for each component of a spread or pair. For...
The Statistics Indicator computes statistical measures (such as MIN, MAX, AVG, STD DEV) on a price types for a specified period, e.g. 100 period standard...
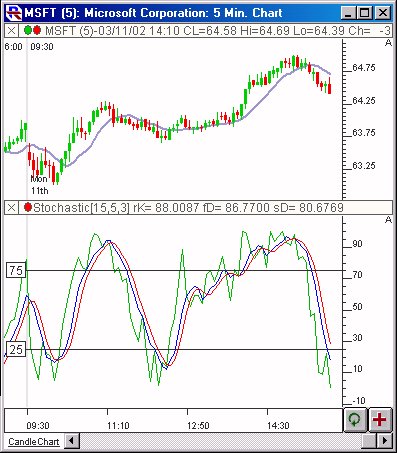
Stochastic is a momentum or price velocity indicator developed by George C. Lane. Stochastic measures the position of a stock compared with its most recent...
The Split Finder may be added to a chart window or used in a scan to locate stocks with abrupt price changes indicative of stock splits. You may specify a...
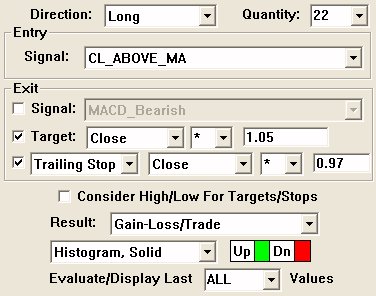
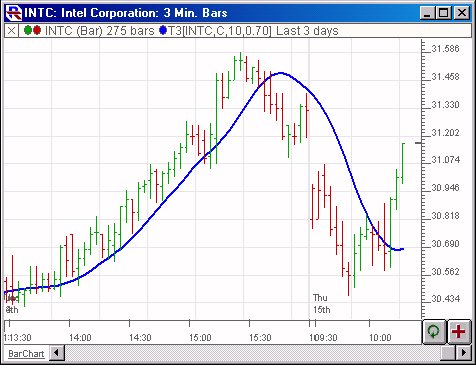
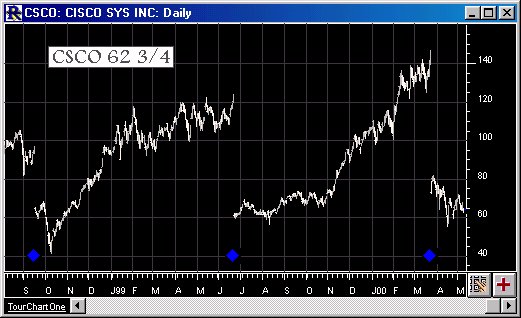
An indicator named "System Simulator" (SSIM) has been added to Investor/RT. SSIM gives the user the ability to quickly chart a simple trading system. SSIM has...
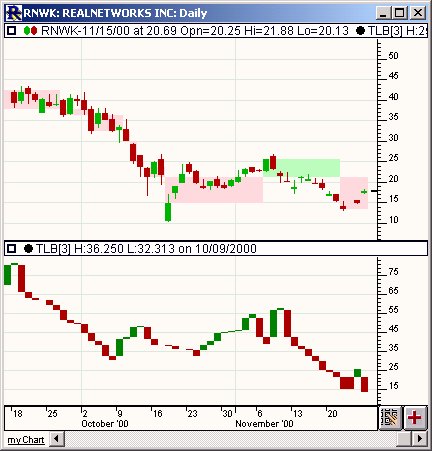
The Three Line Break Indicator calculates columns just like the Three Line Break Charts. There are however a couple of advantages to being able to add TLB as...
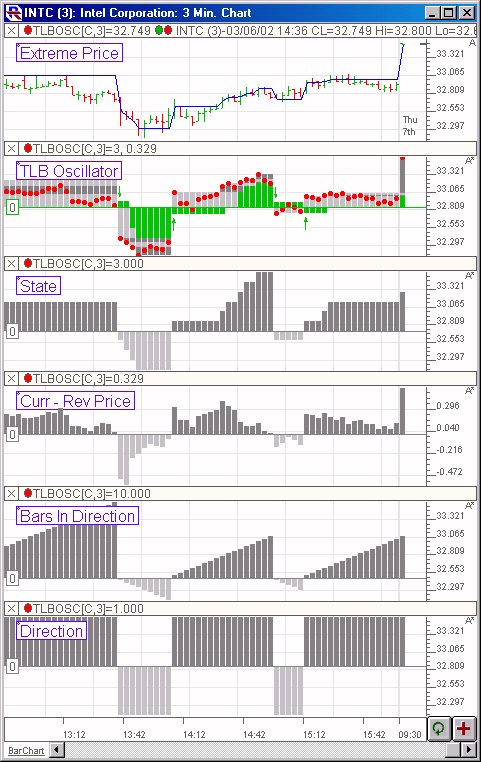
The Three Line Break Oscillator (TLBOSC) was designed to give Three Line Break users an indicator on traditional charts that clearly shows all relevant TLB...