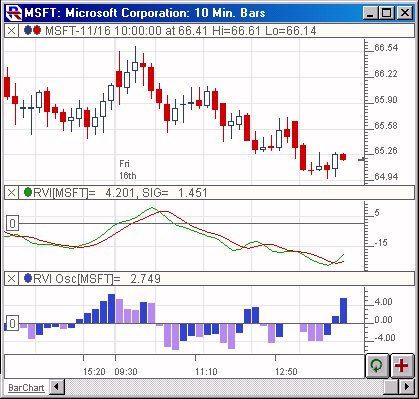
This indicator was developed based the January 2002 Stocks and Commodities article entitled Relative Vigor Index. This indicator is an oscillator built on the...
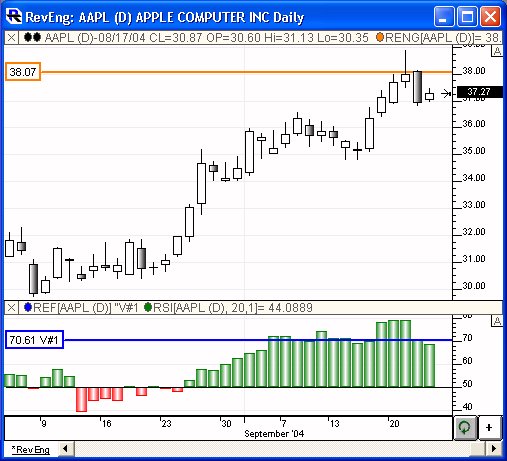
The Reverse Engineer indicator answers the following question: "What current price would be required to attain an indicator value of X". For instance, you may...
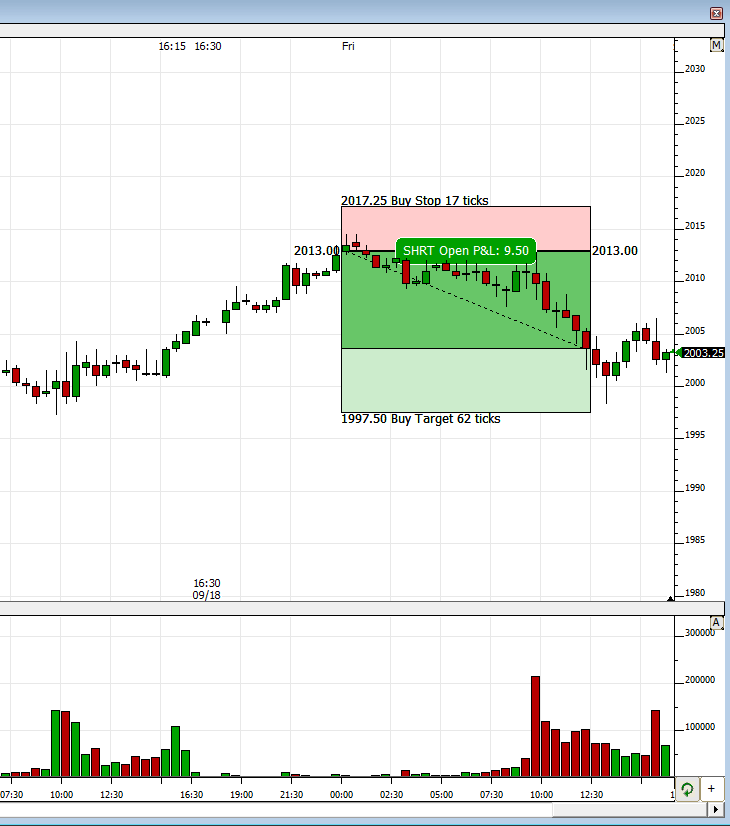
The Risk Reward Tool makes it possible to drag and drop a potential long or short trade to analyze the following: The entry and exit price. Risk...
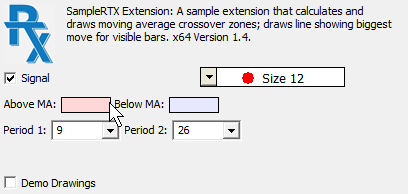
A sample RTX extension that draws a trendline showing the maximum price excursion within the visible portion of the chart. Zoom the chart in/out using mouse...
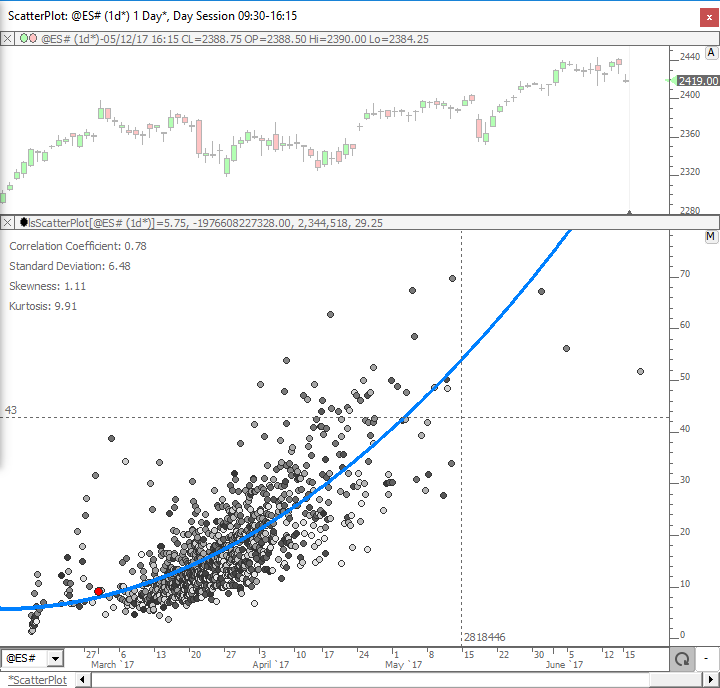
ScatterPlot takes two custom indicators and plots one on the horizontal (X Axis) and one on the vertical (Y Axis) and then computes a best fit polynomial...
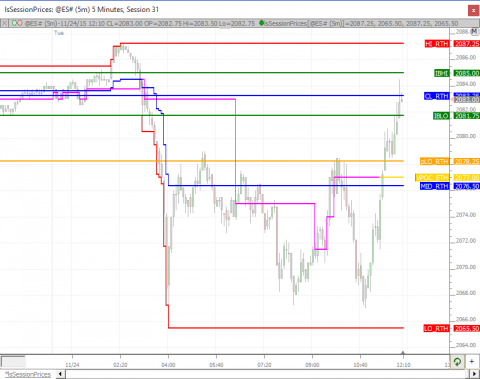
The Session Prices RTX extension calculates common price levels of interest on up to three different sessions independent of the session used by the chart....
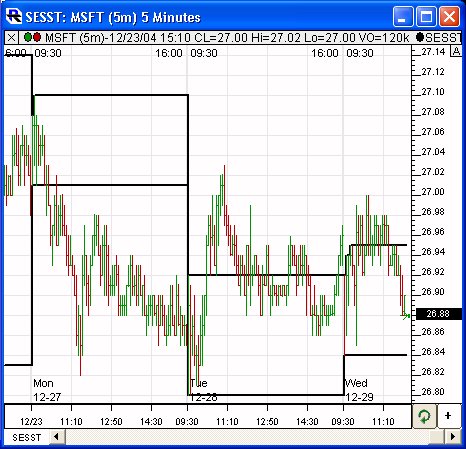
The Session Statistics Indicator computes historical statistics for an instrument or an indicator. The The Session Statistics preferences use the general...
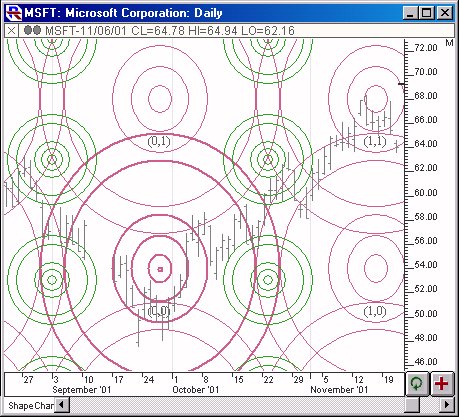
The Shape indicator is a drawing tool indicator with a button on the chart toolbar to faciliate drawing shapes at the desired location in the chart. The button...
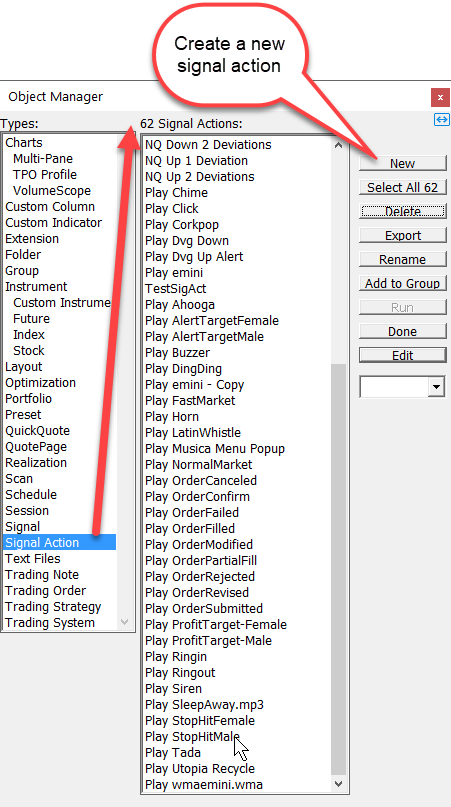
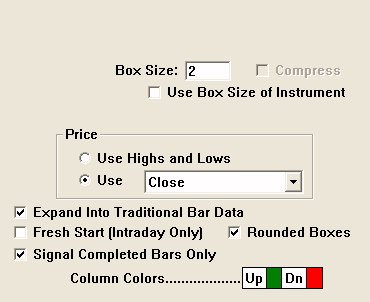
While "Signal Action Setup" is listed, for convenience purposes, on the Technical Indicators library webpage, it is not a technical indicator, but a fully...
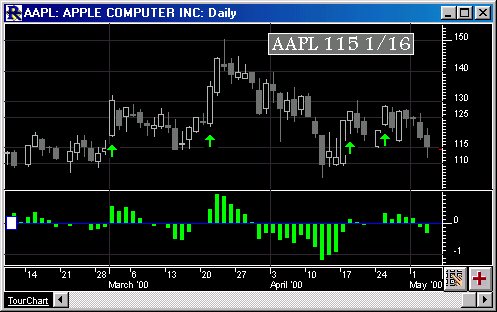
Together with the Custom Indicator, an RTL Signal Formula is one of the key building blocks of Investor/RT A Signal is an RTL formula (such as CLOSE > MA...
The Signal Statistics indicator (SSTAT) enables statistical calculations on any signal, including summation of consecutive signals, frequency, returning...