bands

Bollinger Bands

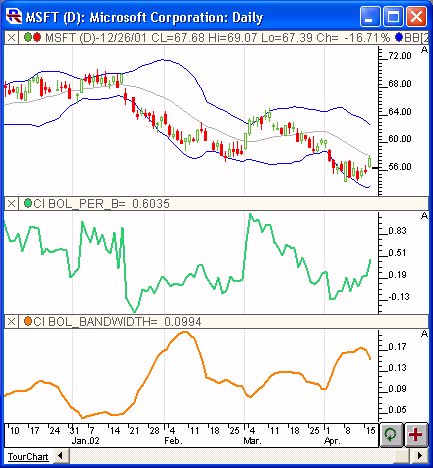
Bollinger Bands are volatility based bands used to help identify situations where prices are too high, or too low, on a relative bases. When prices reach or rise above the upper band, they are too high. When prices reach or drop below the lower band, they are too low. Bollinger bands are calculated by first smoothing the typical price using the MA type and period specified. The typical price for each bar is defined as (high + low + close)/3. The standard deviation is then calculated for the series of typical prices.

Bands

The Bands Indicator draws a band of color between two fixed price points or two historical prices computed by an RTL customer indicator. The Professional Edition Investor/RT is required for this indicator.

Price Bands Indicator

Price Bands Indicator

This video demonstrates a variety of ways to use the Price Bands indicator for drawing historical bands between two prices or custom indicators

Reference Line Bands

Reference Line Bands

This video demonstrates how to use the horizontal reference line bands feature, combined with the button indicator, to quickly drop down horizontal strips of specific heights in multi-pane charts.

Current Price Brackets

Current Price Brackets

This video demonstrates how to put a reference line in the chart that follows the current price and draws multiple bands at certain price increments above and below current price.

Pages