IB Study
Companion chart to Extracting Market Behavior Lesson 1: Initial Balance Multiple Study
Companion chart to Extracting Market Behavior Lesson 1: Initial Balance Multiple Study
Companion chart to Extracting Market Data Lesson 2: Initial Balance Multiple Study Expanded
Companion chart to Extracting Market Behavior Lesson 4: Profile on Indicator: Filtering Results
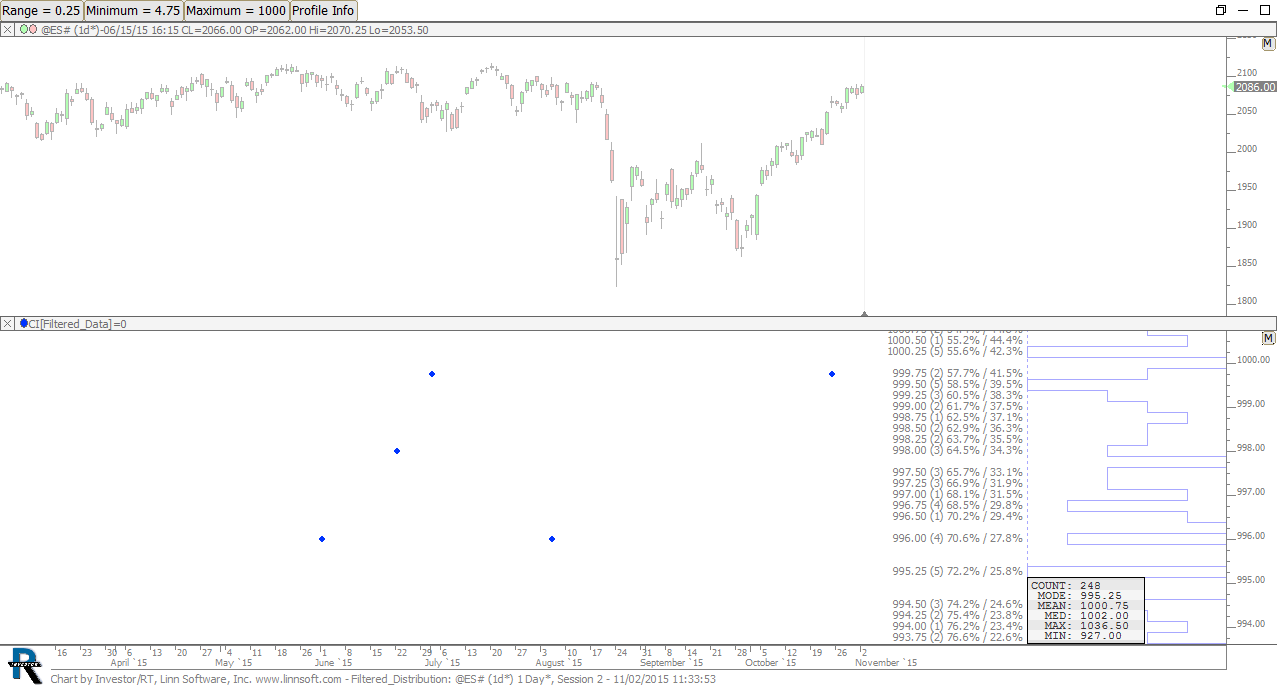
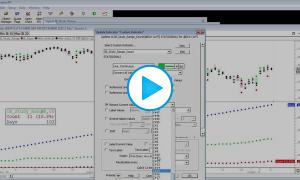
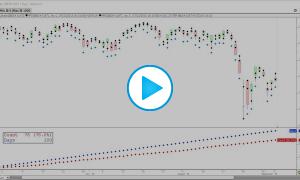
Companion chart to Homework #22 and Lesson #6 in "Extracting Market Behavior" series
In this video, Homework #22 and Lesson #6 in "Extracting Market Behavior" series, we explore how to filter distributions to help identify sequential relationships in data. Specifically, we look at the day session change, and evaluate the effect of the overnight change on the day session change. For instance, if we had a very positive overnight session, what did the distribution of the day session change look like? What was the median, the mean, the mode, etc. If we had a very negative overnight session, how did that effect the day session change?
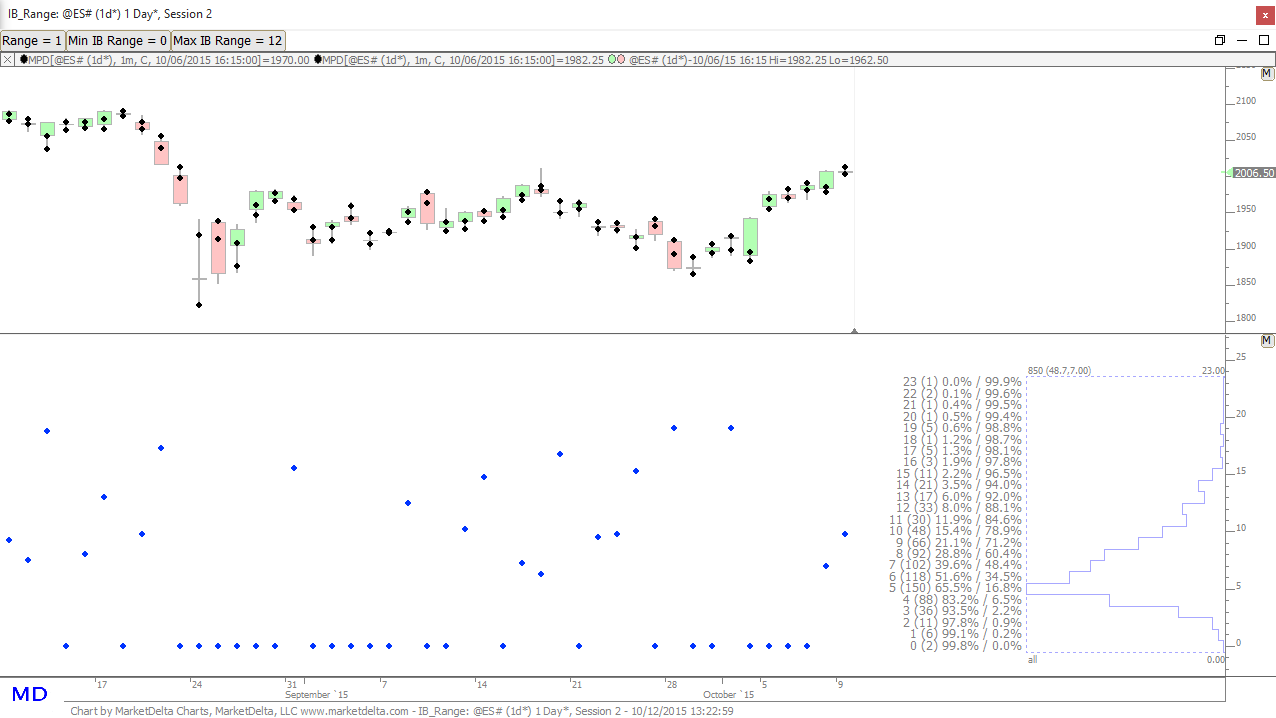
This video, lesson 4 in the series on extracting market data, focuses on filtering the data that is profiled using in the Profile on Indicator concept. Expanding on the Initial Balance them, we filter the initial balances profiled to only that's that followed an previous initial balance that fits within our specified range. For example, what was the initial balance profile on days that followed small initial balance days (< 5) or what was the initial balance profile on days following large initial balance days (> 12).
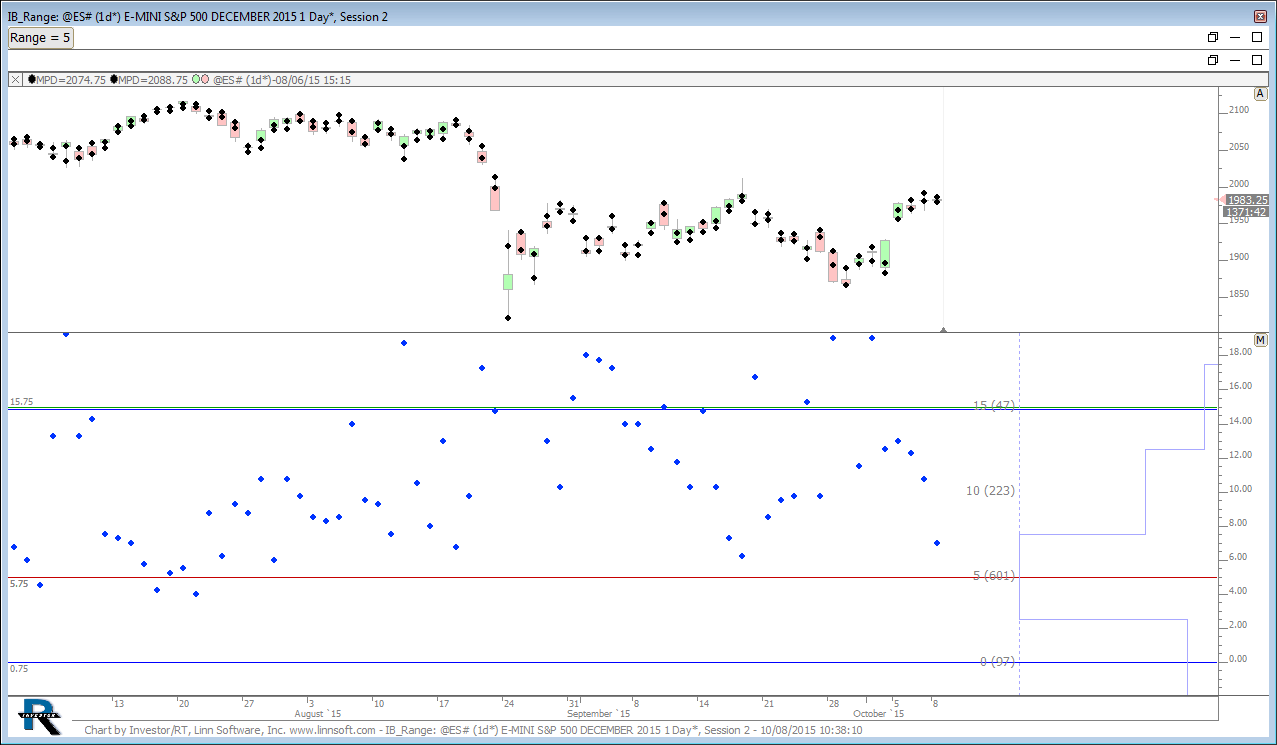
In this video, lesson 3 on extracting market data, we explore the powerful concept of profiles on indicators. Specifically, we extracted the initial balance range from each day and profiled that initial balance. With this profile, we were able to identify how many days the initial balance range fell into various levels (of the past 1000 days, 601 days the range fell between 5 and 10 points, 223 days it fell between 10 and 15 points, etc).
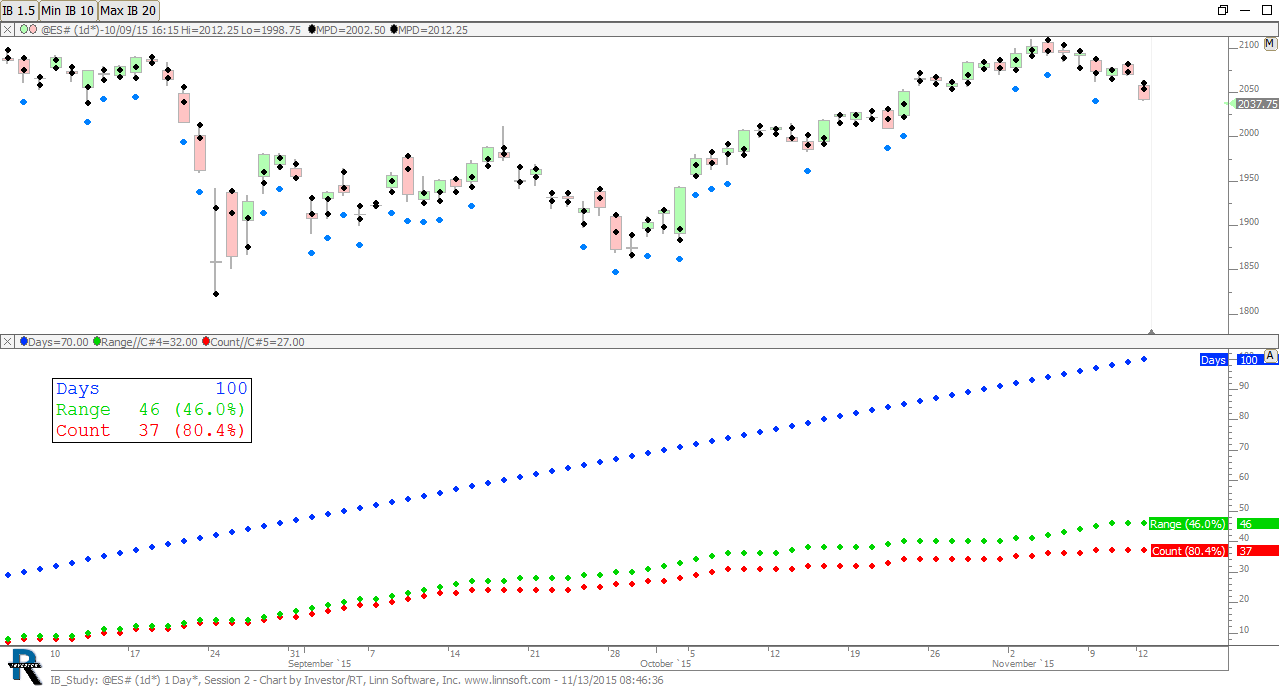
In this video, lesson 2 on extracting market behavior, we expand on lesson one in which we learned how to extract and accumulate initial balance data from daily bars. In this video we take a closer look at the process of creating the signals and custom indicators from scratch while computing the number of days in which the IB range requirements were met. Lessons 1 and 2 have been especially helpful at learning how to extract intraday-based data from daily bars and accumulating that data into meaningful statistics.
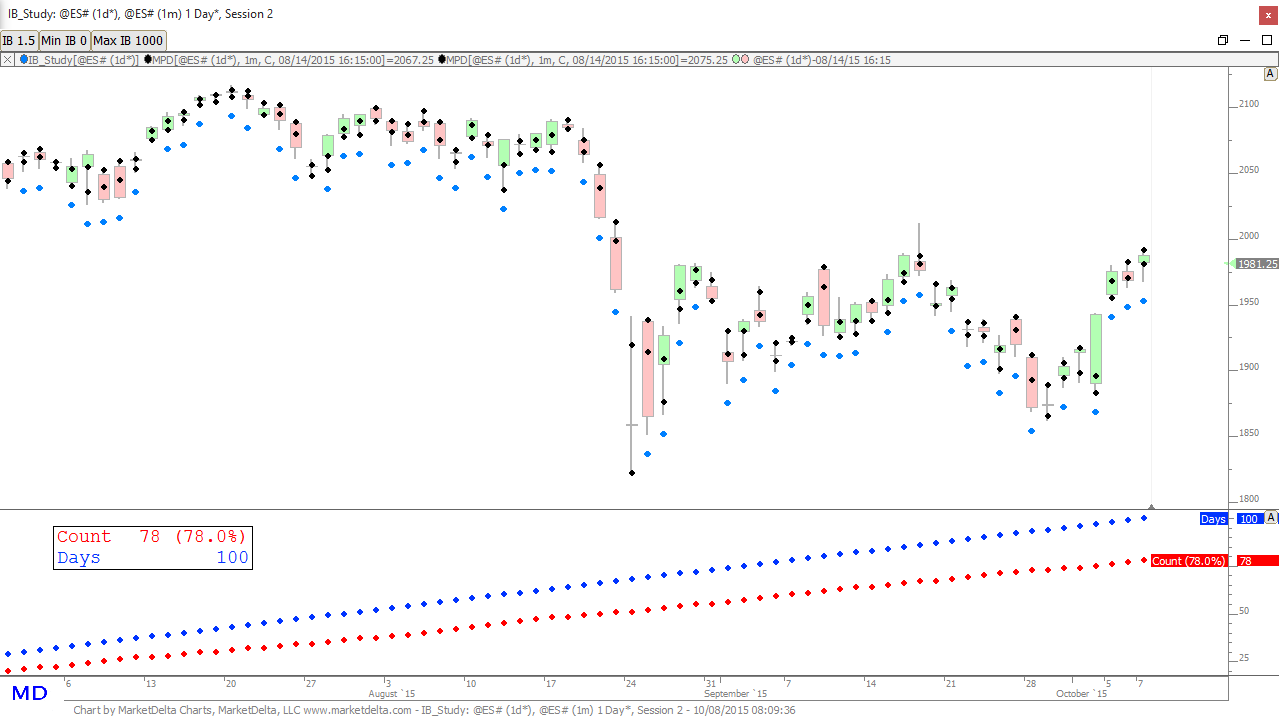
This video explains how to use the Mixed Periodicity Data (MPD) Indicator to extract intraday conditions from daily bars, and how to then use signals and custom indicators to accumulate that information and present it as a percentage of all days. In this case, we look specifically at how many days price reached the 1.5 IBH or 1.5 IBL and present that accumulated number as a percentage of all days studied.