Duration:15:45
Variable speed version:
Watch
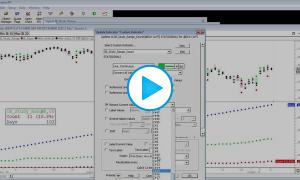
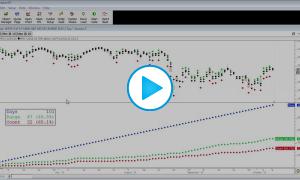
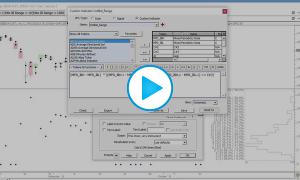
This video explains how to use the Mixed Periodicity Data (MPD) Indicator to extract intraday conditions from daily bars, and how to then use signals and custom indicators to accumulate that information and present it as a percentage of all days. In this case, we look specifically at how many days price reached the 1.5 IBH or 1.5 IBL and present that accumulated number as a percentage of all days studied.
Chart Reference
IB Study