Duration:09:11
Variable speed version:
Watch
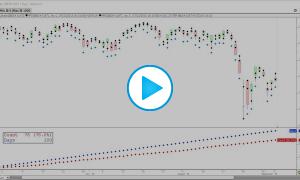
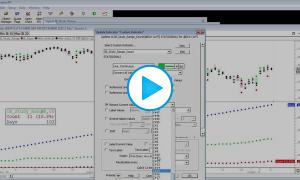
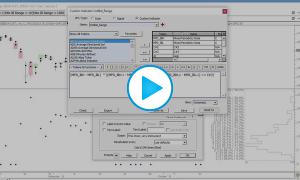
In this video, lesson 3 on extracting market data, we explore the powerful concept of profiles on indicators. Specifically, we extracted the initial balance range from each day and profiled that initial balance. With this profile, we were able to identify how many days the initial balance range fell into various levels (of the past 1000 days, 601 days the range fell between 5 and 10 points, 223 days it fell between 10 and 15 points, etc).
Chart Reference
IB Range Profiling