Regression Review
Submitted by linnsoft on Tue, 04/23/2013 - 20:50
The following is a brief review of the Regression studies looked at during an intensive session over the course of 4 days.
The following is a brief review of the Regression studies looked at during an intensive session over the course of 4 days.
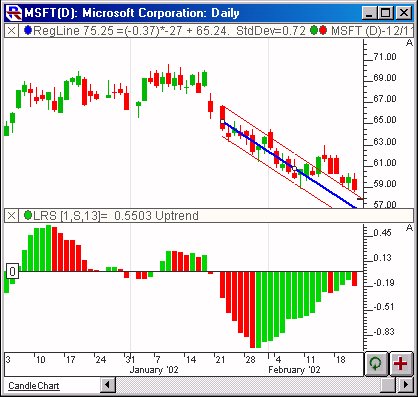
The Linear Regression Slope indicator provides the slope at each bar of theoretical regression lines which involve that bar and the previous N-1 bars (N being the regression period). First, the data, based on the price selected, is smoothed using the moving average period and type (specify a period of 1 if no pre-smoothing is desired). The resulting data is then used to form regression lines ending at each bar, using the regression period specified. The slope of each bars regression line is the recorded as the linear regression slope value for that bar.
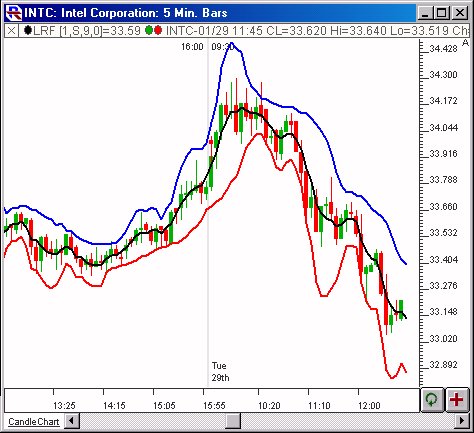
The Linear Regression Forecast indicators performs regression analysis on optionally smoothed price data, forecasts the regression lines if desired, and creates standard deviation bands above and below the regression line. First, the data, based on the price selected, is smoothed using the moving average period and type. If you prefer no smoothing, choose a period of 1. The resulting data is used to form regression lines ending at each bar, using the regression period specified.
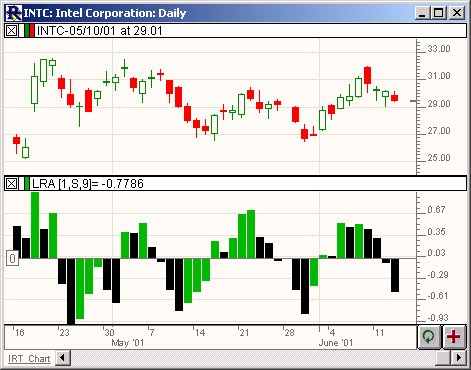
First, the data, based on the price selected, is smoothed using the moving average period and type. If you prefer no smoothing, choose a period of 1 here. The resulting data is then used to form regression lines ending at each bar, using the regression period specified. The linear regression acceleration of each bars regression line is then recorded as the change in slope of the regression line from the slope of the regression line of the previous bar. For instance, using the preferences specified above, the raw closing price would be used (smoothing period of 1).
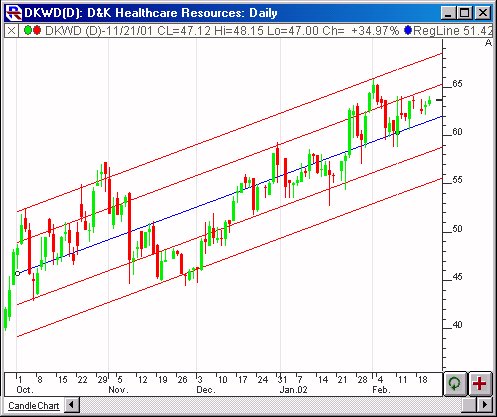
Linear regression is a statistical tool used to predict the future from past data, and commonly used to determine when prices are overextended. The Investor/RT Linear Regression tool uses a least square method to plot a "best-fit" straight line through a series of data points. The data points used as input can be any of the following: Open, Close, High, Low, Hi+Lo/2, Hi+Lo+Cl/3, OHLC/4, %Change, or Op+Cl/2. These data points can be optionally pre-smoothed prior to construction of the best-fit line. If no smoothing is desired, simply chose a smoothing period of 1.