
This post explains how to plot the naked day session VPOC, VAH, and VAL on a full session chart.
This can be accomplished using the Profile Indicator.
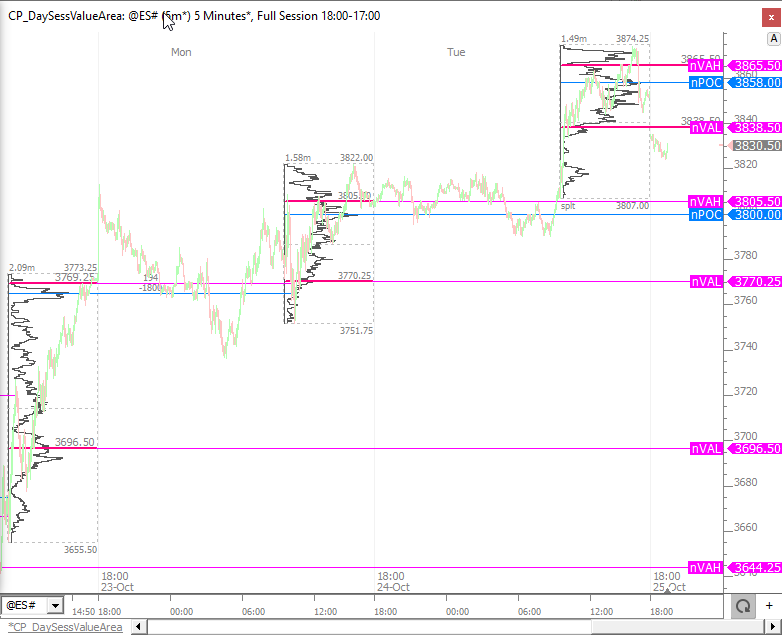
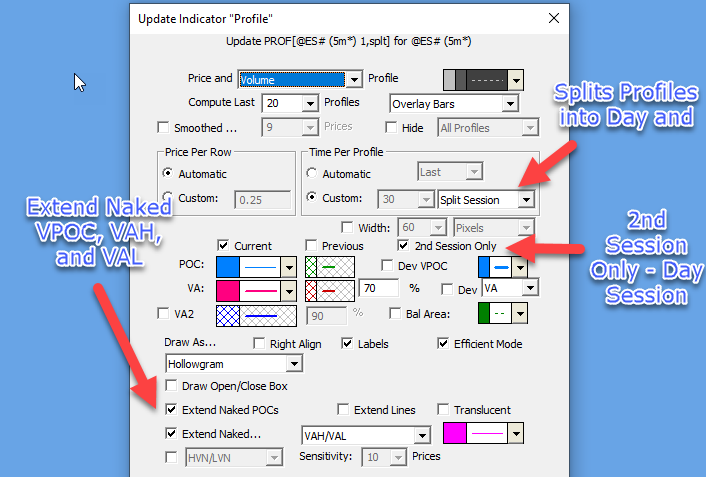
Several key settings of the Profile Indicator are highlighted below.
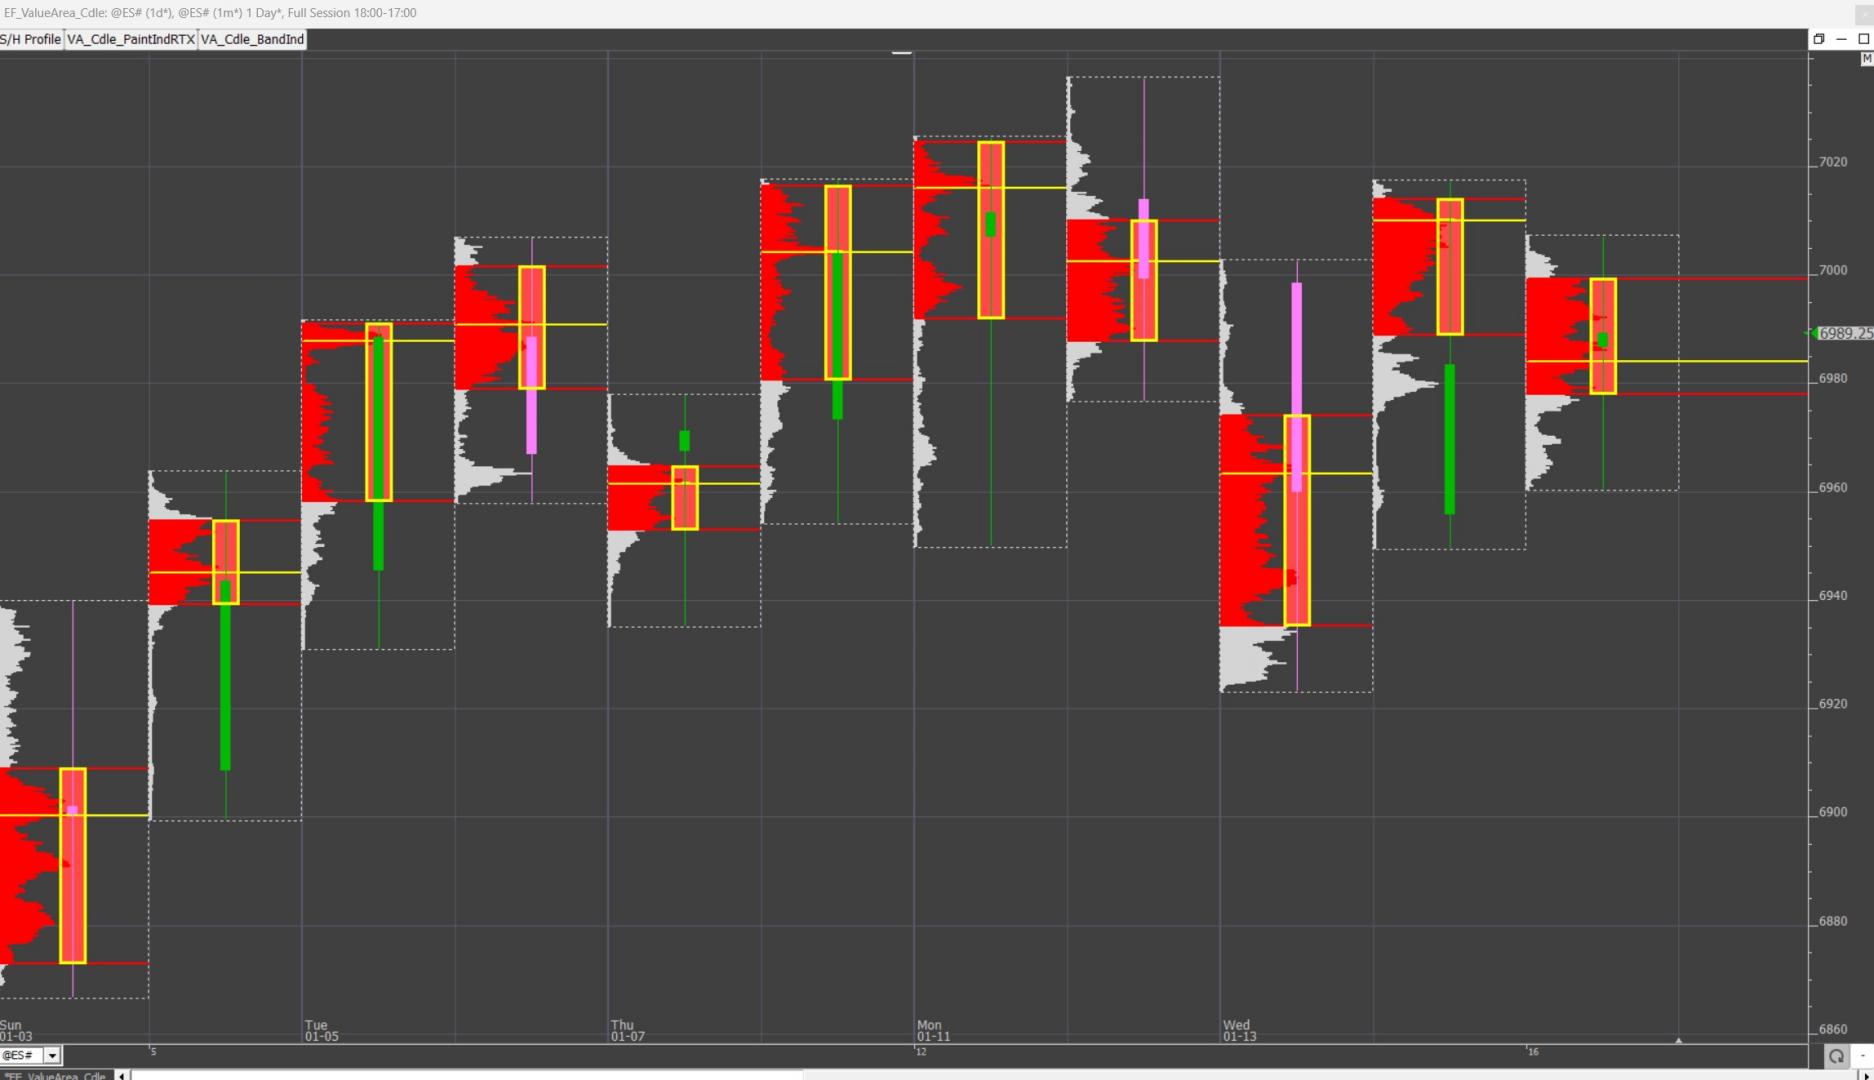
This tip explains how to Create a "Value Area" Hollow candle with the paint Indicator

This video highlights the ability to automate the application of the Profile Indicator to the Zones RTX Extension. This facilitates the ability to profile consolidation zones and opens up all the functionality of the Profile Indicator to the Zones indicator including VAH/VAL/POC Lines, Naked VAH/VAL/POCs, Info Box, Textual Volume at Price, and much more in addition to the ability to display volume or time profiles of zones in a variety of formats and colors.
This video takes a fresh look at split session profiling in Investor/RT by demonstrating how to use the Profile Indicator to plot both the day session and overnight session profiles in a single chart using a single instance of the Profile Indicator.
As explained in the video, Time Per Profile should be set to "3 Sessions" with Period 1 set to the number of the minutes in the overnight session (typically 1020 or 930) and Period 2 set to the number of minutes in the day session (typically 390 or 405).

This tip explains how to emulate the functionality of Market Profile charts in multi-pane (bar/candle) charts using the Profile Indicator.