Developing Volume Nodes
This video demonstrates how to plot the nearest 3 high and low volume nodes historically using the Profile Indicator to review how price reacted to these key levels over time.


This video demonstrates how to plot the nearest 3 high and low volume nodes historically using the Profile Indicator to review how price reacted to these key levels over time.
This video demonstrates how to form dynamic volume profiles of market moves identified by the Zig Zag Indicator. In this case, we take moves of $5 or greater on the ES and construct volume at price profiles. Zig Zag based Signals are used to dictate the start and end of each profile, but this dynamic profile concept can be expanded beyond the use of Zig Zags. Any condition that can be represented with a Signal can be used to identify the start and end of Profiles.
A playback demonstration of time shade profiles.
This video demonstrates the Volume Profile charting style along with the ability for bars to load Volume at Price data, and how this positively impacts the VWAP, Profile, and Volume Breakdown Indicators.
This video demonstrates how to draw volume or time-based profiles across any group of consecutive bars of any periodicity. It also discusses how to edit and manipulate these profiles, as well as how to add buttons that activate different profile settings.
This video demonstrates enhancements made to the Profile drawing tool in version 9.2.8 including an option to shade each price based on volume, easier dragging and manipulation, an open/close candle body, and more.
This video focuses on the longer term Volume Profiling aspects of the Profile Indicator and discusses how Investor/RT divides up volume among price when tick data and 1-minute data is available.
This video is another follow-up to the webinar, which focuses primarily on the Composite Profile of FT71 and covers various issues which can result in discrepancies between users. Included in the discussion is how to setup symbols properly for continuous contracts, and how to adjust the data to account for the calendar-spread gap created at rollover.
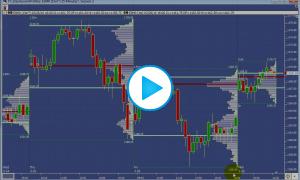
This video shows how to separate the current days volume profile and draw it to the right of the right-most bar.
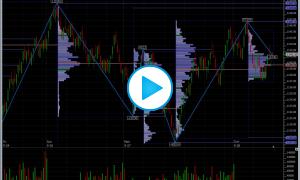
This video demonstrates how to use the Zig Zag Indicator to identify ten point moves and label them with the delta of each move. It also shows how to use the Profile Indicator to plot volume profiles of each of these moves and extend the naked VPOC, High, and Low of those profiles.