
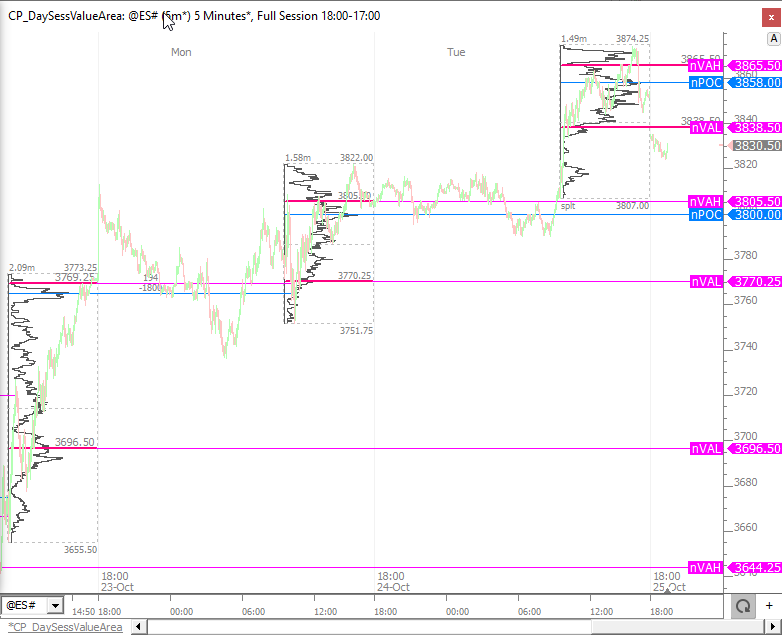
This post explains how to plot the naked day session VPOC, VAH, and VAL on a full session chart.
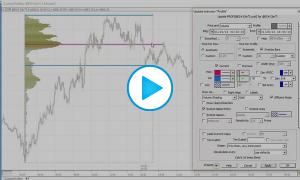
This can be accomplished using the Profile Indicator.
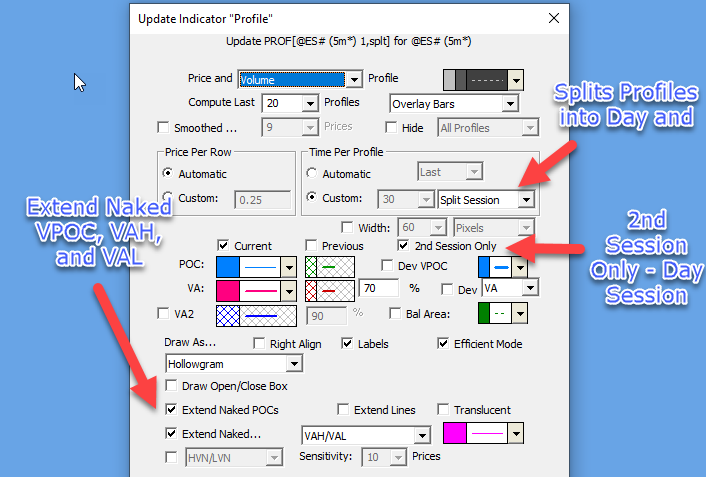
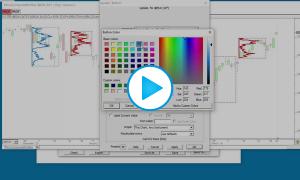
Several key settings of the Profile Indicator are highlighted below.
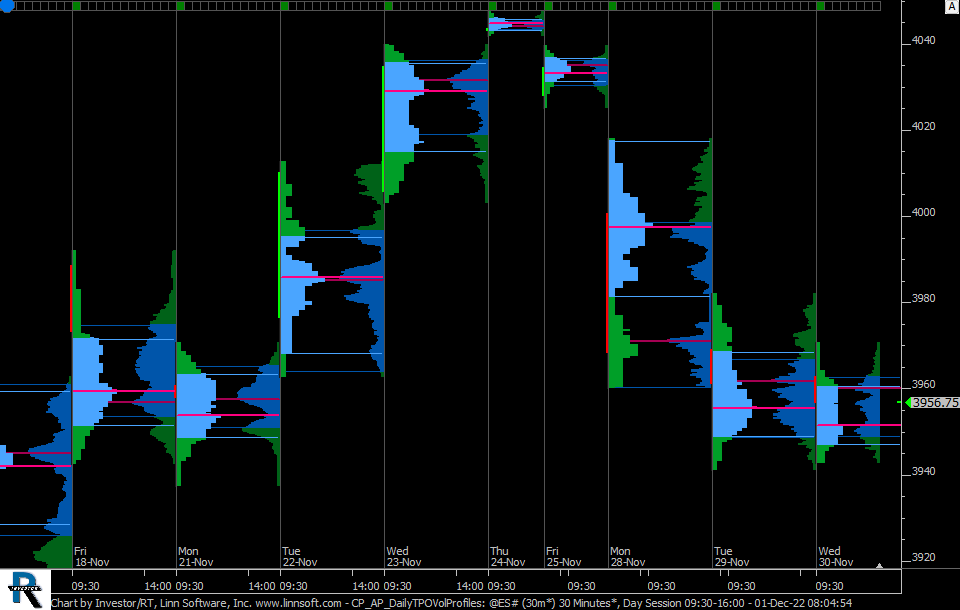
Charts showing both TPO Profile (on the left) & Volume Profile (on the right), together with the merging/hiding profile features offered by the Boundaries indicator.
This chart was uploaded by Investor/RT 15.1.12 showing symbol: @ES#.
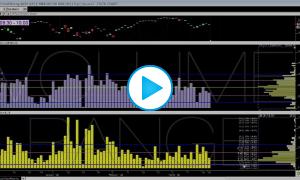
This video highlights several new features in Investor/RT 12.7 which enabled overlapping profiles representing a variety of periods (30 min, 90 min, 1 day, 10 day, etc) to be scaled to a common scale horizontally and therefore comparable with the area of the profile representative of the volume in the profile.
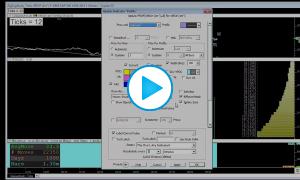
This video demonstrates how to quickly and easily draw volume profiles on daily charts. It explains the importance of setting the periodicity of the chart to "Time Per Bar: 1 Day" in order for the Volume Profile to access the required intraday data.
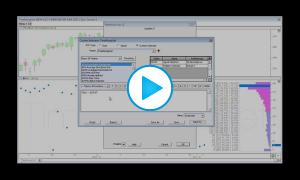
This video takes a fresh look at the use of the Profile Indicator drawing tool to lay down and adjust Custom or MicroComposite profiles around any group of bars or data. Many new features of the Profile Indicator are explored as they relate to such profile.
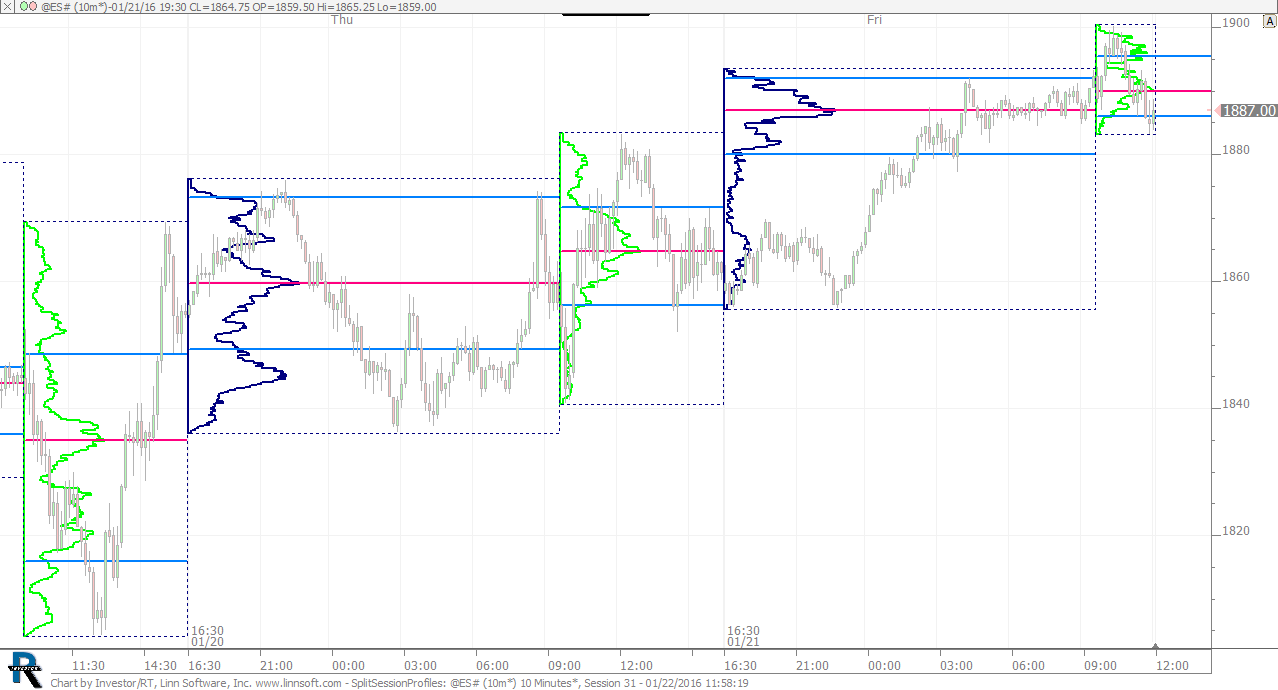
This chart was created to accompany the video Split Session Profiling Using Profile Indicator
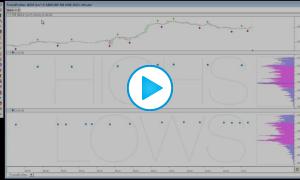
This video discusses the technical details behind the creation of the FractalProfiles chart. This chart extracts significant highs and lows and profiles those highs and lows. The significant highs are extracted using the Fractal indicator. These highs are then accumulated with the Profile indicator to identify key prices where price action tends to stop and reverse downward. The lows are also accumulated with the Profile indicator to identify key prices where price action tends to stop and reverse upward.
This video demonstrates an exciting new feature in version 12.2: the ability to apply the profile indicator to any other indicator. This functionality opens up a new world of possibilities. In this video, we demonstrate how to profile range and volume (as well as time-filtered range and volume), moves, significant highs and lows, as well as the time into the session when the high, low, and range were set. For the chart definitions involved in this video, see Profiles on Indicators
This video discusses the technical details behind the ZigZagStudy_Ticks chart. This chart profiles the significant moves identified by the Zig Zag indicator and produces data such as the number of moves and average move. A button is available to allow easy adjustment to the minimum price change (in ticks). For more information on Profiling Indicators as well as the chart definition for ZigZagStudy_Ticks, see Profiles on Indicators
This video discusses the charts "TimeHighLowSet" and "TimeRangeSet" and the technical details behind them. These charts extract the time into the session that the high, low, or range was completed. The profile indicator then accumulates this information and presents the number of times the high/low/range was completed in any given time period (1st 30 minutes, 2nd 30 minutes, etc). For more information on Profiles On indicators and the chart definitions for charts involved in this video, see Profile on Indicators