Duration:08:16
Variable speed version:
Watch
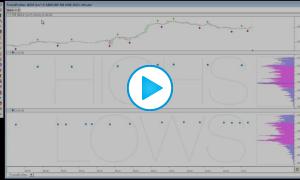
This video discusses the technical details behind the ZigZagStudy_Ticks chart. This chart profiles the significant moves identified by the Zig Zag indicator and produces data such as the number of moves and average move. A button is available to allow easy adjustment to the minimum price change (in ticks). For more information on Profiling Indicators as well as the chart definition for ZigZagStudy_Ticks, see Profiles on Indicators