Duration:08:48
Variable speed version:
Watch
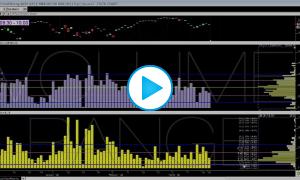
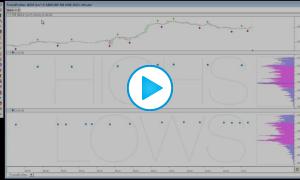
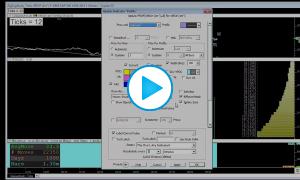
This video discusses the charts "TimeHighLowSet" and "TimeRangeSet" and the technical details behind them. These charts extract the time into the session that the high, low, or range was completed. The profile indicator then accumulates this information and presents the number of times the high/low/range was completed in any given time period (1st 30 minutes, 2nd 30 minutes, etc). For more information on Profiles On indicators and the chart definitions for charts involved in this video, see Profile on Indicators