IB Range Filtering
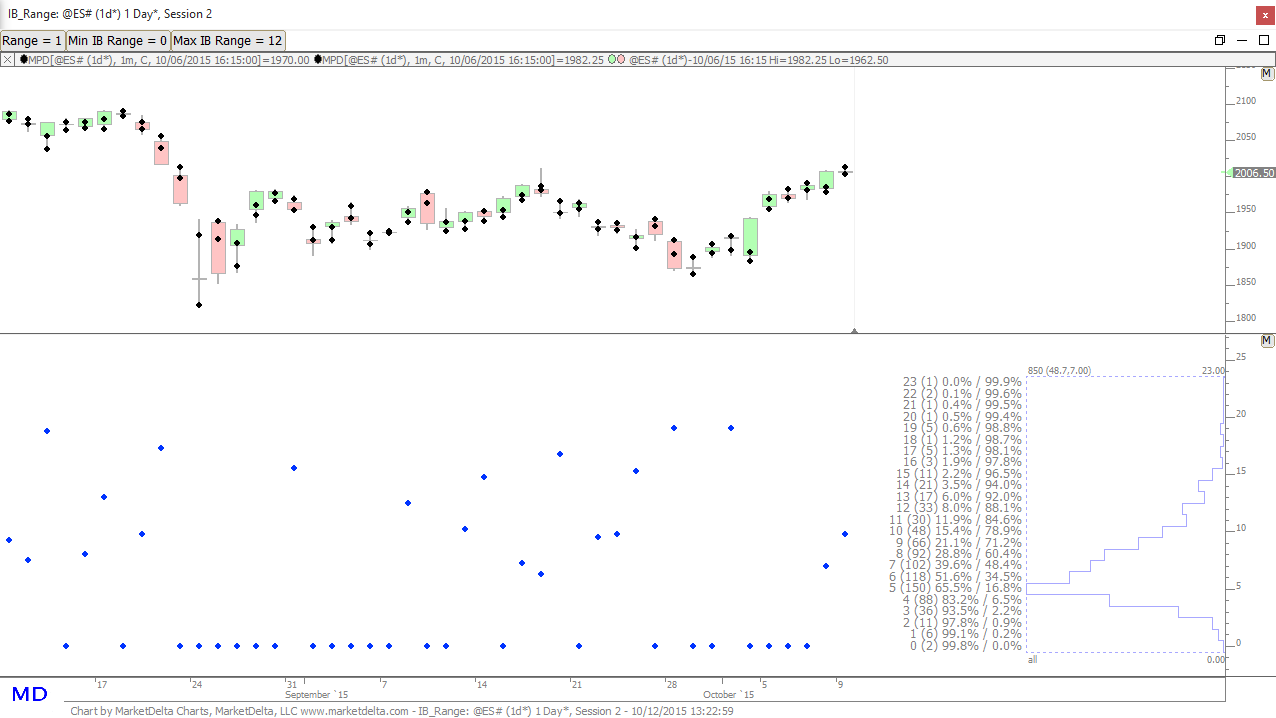
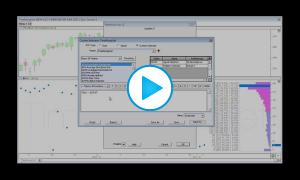
Companion chart to Extracting Market Behavior Lesson 4: Profile on Indicator: Filtering Results
Companion chart to Extracting Market Behavior Lesson 4: Profile on Indicator: Filtering Results
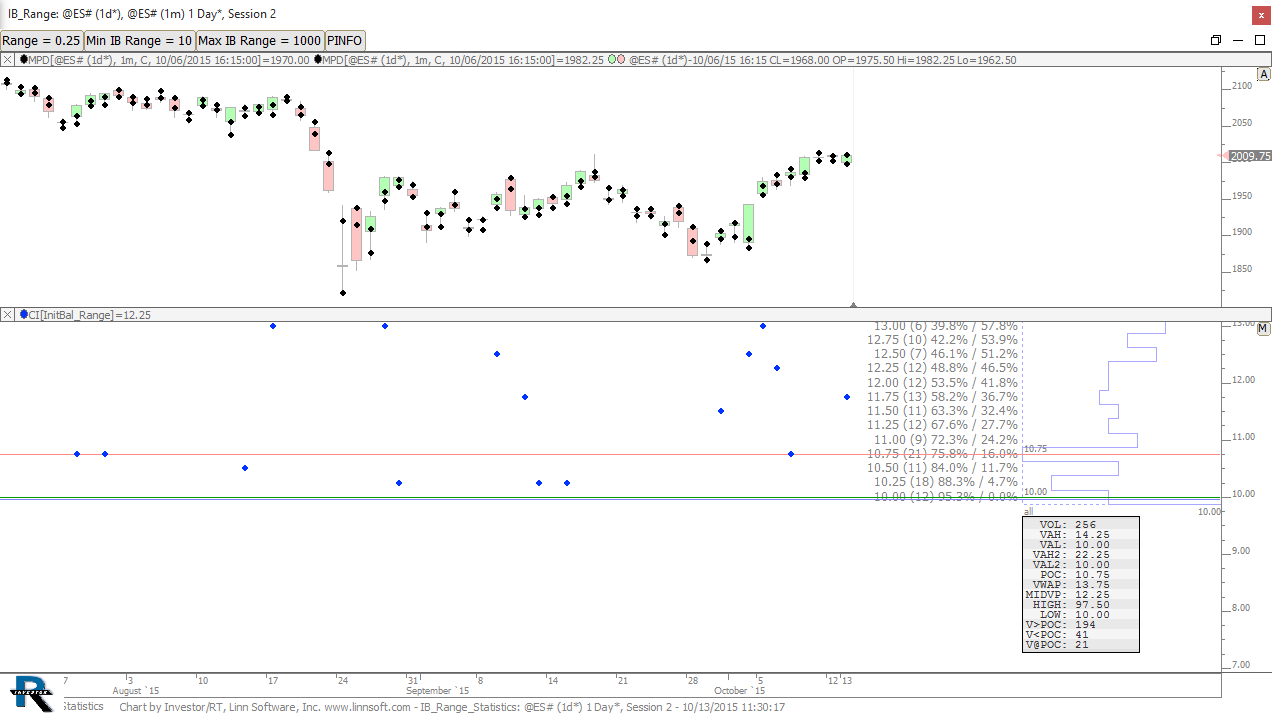
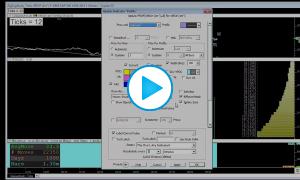
This video, lesson 5 in the series on extracting market data, focuses on the statistics available in the Info Box of the Profile Indicator and explains their relevance when applying profiles to indicators.
This video, lesson 4 in the series on extracting market data, focuses on filtering the data that is profiled using in the Profile on Indicator concept. Expanding on the Initial Balance them, we filter the initial balances profiled to only that's that followed an previous initial balance that fits within our specified range. For example, what was the initial balance profile on days that followed small initial balance days (< 5) or what was the initial balance profile on days following large initial balance days (> 12).
This video discusses the technical details behind the creation of the FractalProfiles chart. This chart extracts significant highs and lows and profiles those highs and lows. The significant highs are extracted using the Fractal indicator. These highs are then accumulated with the Profile indicator to identify key prices where price action tends to stop and reverse downward. The lows are also accumulated with the Profile indicator to identify key prices where price action tends to stop and reverse upward.
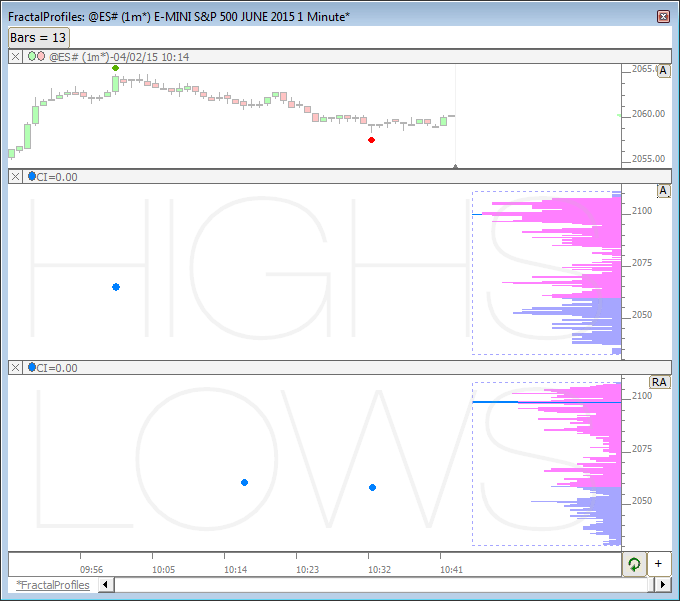
This chart is documented in the Profiles On Indicators article. The FractalProfiles chart extracts significant highs and lows and profiles those highs and lows. The significant highs are extracted using the Fractal indicator. These highs are then accumulated with the Profile indicator to identify key prices where price action tends to stop and reverse downward. The lows are also accumulated with the Profile indicator to identify key prices where price action tends to stop and reverse upward.
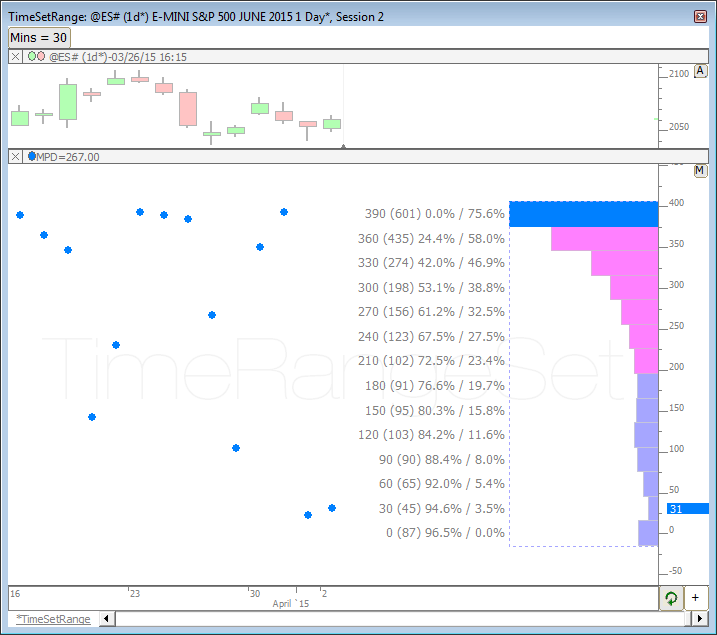
This chart is documented in the Profiles On Indicators article. The TimeSetRange chart extracts the time into the session that the range was completed. The profile indicator then accumulates this information and presents the number of times the range was completed in any given time period (1st 30 minutes, 2nd 30 minutes, etc).
This video demonstrates an exciting new feature in version 12.2: the ability to apply the profile indicator to any other indicator. This functionality opens up a new world of possibilities. In this video, we demonstrate how to profile range and volume (as well as time-filtered range and volume), moves, significant highs and lows, as well as the time into the session when the high, low, and range were set. For the chart definitions involved in this video, see Profiles on Indicators
This video discusses the technical details behind the ZigZagStudy_Ticks chart. This chart profiles the significant moves identified by the Zig Zag indicator and produces data such as the number of moves and average move. A button is available to allow easy adjustment to the minimum price change (in ticks). For more information on Profiling Indicators as well as the chart definition for ZigZagStudy_Ticks, see Profiles on Indicators
This video discusses the charts "TimeHighLowSet" and "TimeRangeSet" and the technical details behind them. These charts extract the time into the session that the high, low, or range was completed. The profile indicator then accumulates this information and presents the number of times the high/low/range was completed in any given time period (1st 30 minutes, 2nd 30 minutes, etc). For more information on Profiles On indicators and the chart definitions for charts involved in this video, see Profile on Indicators