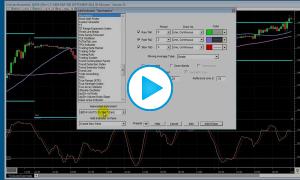
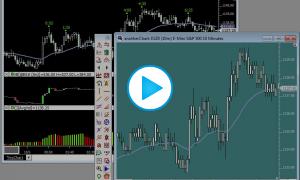
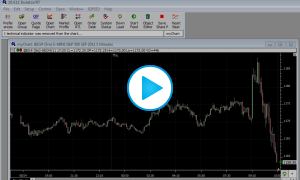
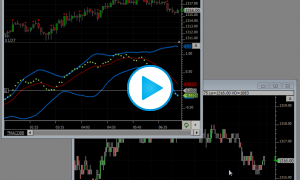
Profiles On Indicators: Profiling Significant Highs and Lows
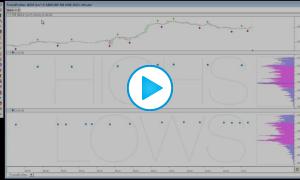
This video discusses the technical details behind the creation of the FractalProfiles chart. This chart extracts significant highs and lows and profiles those highs and lows. The significant highs are extracted using the Fractal indicator. These highs are then accumulated with the Profile indicator to identify key prices where price action tends to stop and reverse downward. The lows are also accumulated with the Profile indicator to identify key prices where price action tends to stop and reverse upward.