ES 675 KV TD BAV BAT A (@ES#)
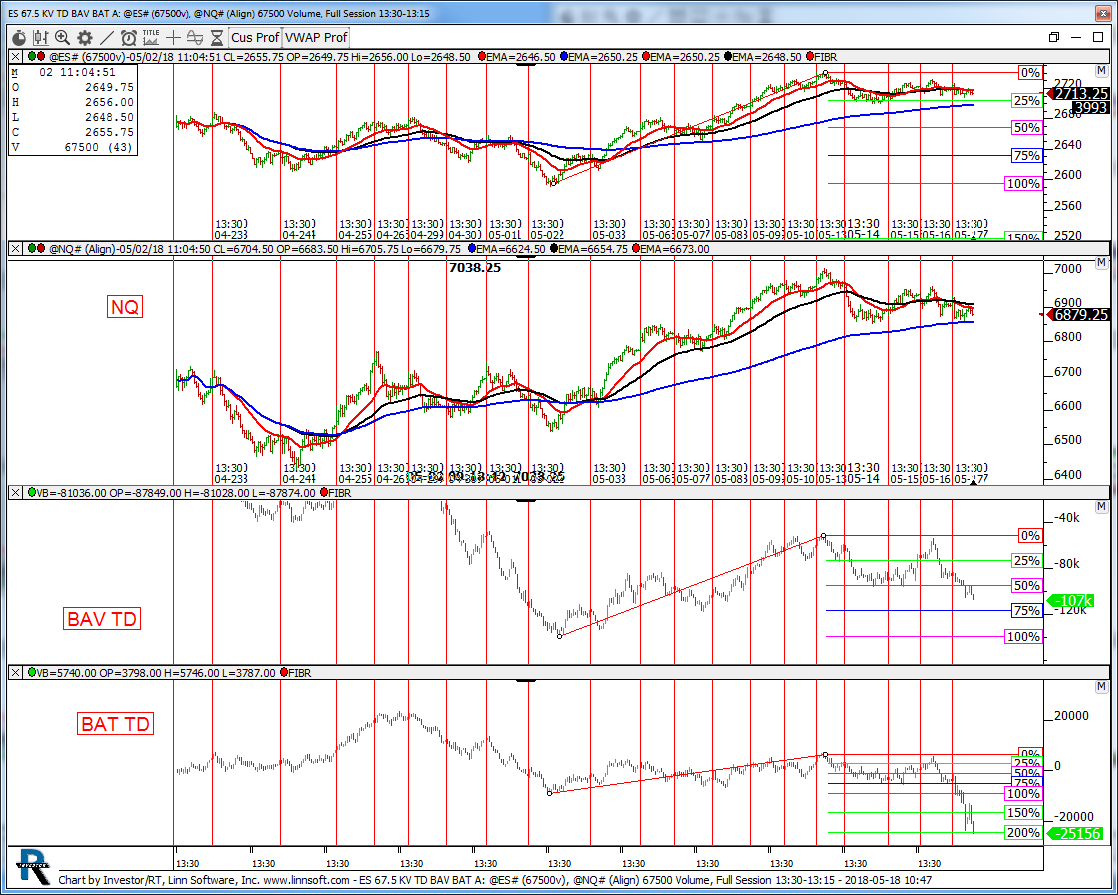
67.5 kv. This chart was uploaded by Investor/RT 13.3.3 showing symbol: @ES#.
67.5 kv. This chart was uploaded by Investor/RT 13.3.3 showing symbol: @ES#.
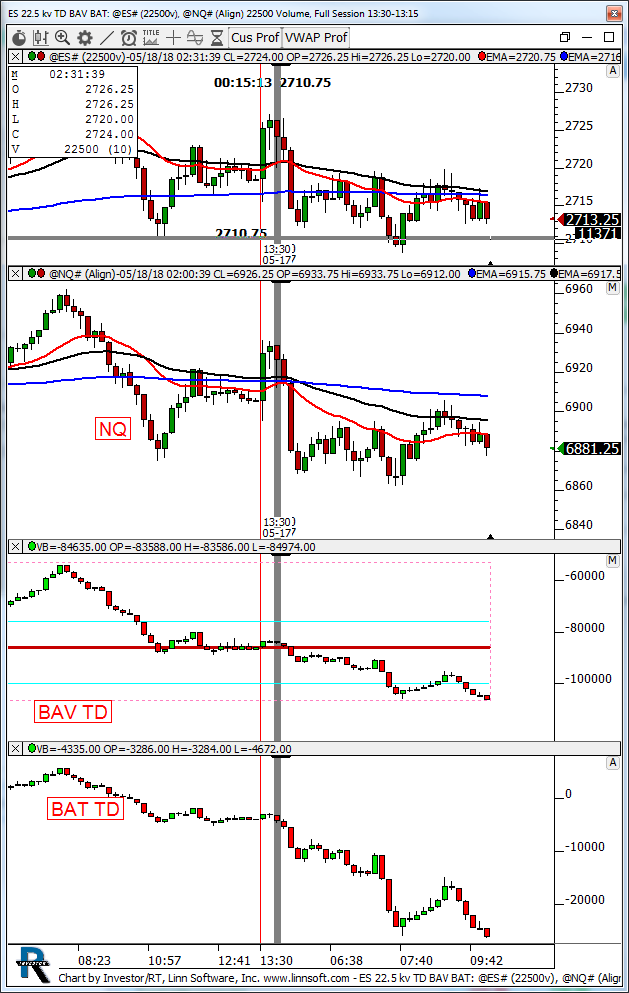
22.5 kv. This chart was uploaded by Investor/RT 13.3.3 showing symbol: @ES#.
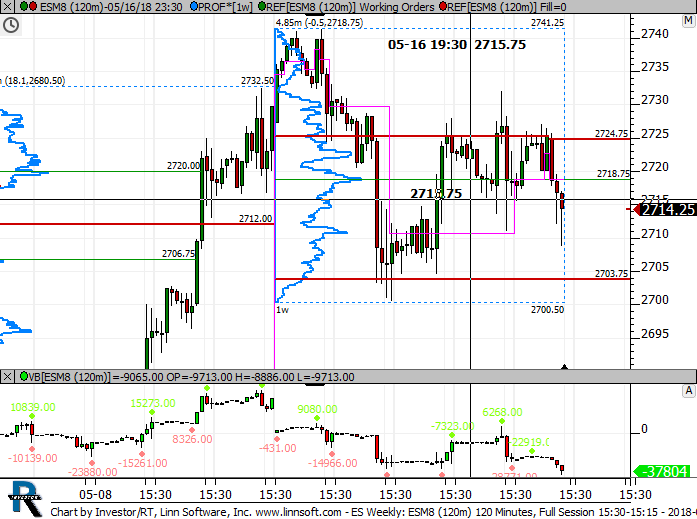
This chart was uploaded by Investor/RT 13.3.1 showing symbol: ESM8.
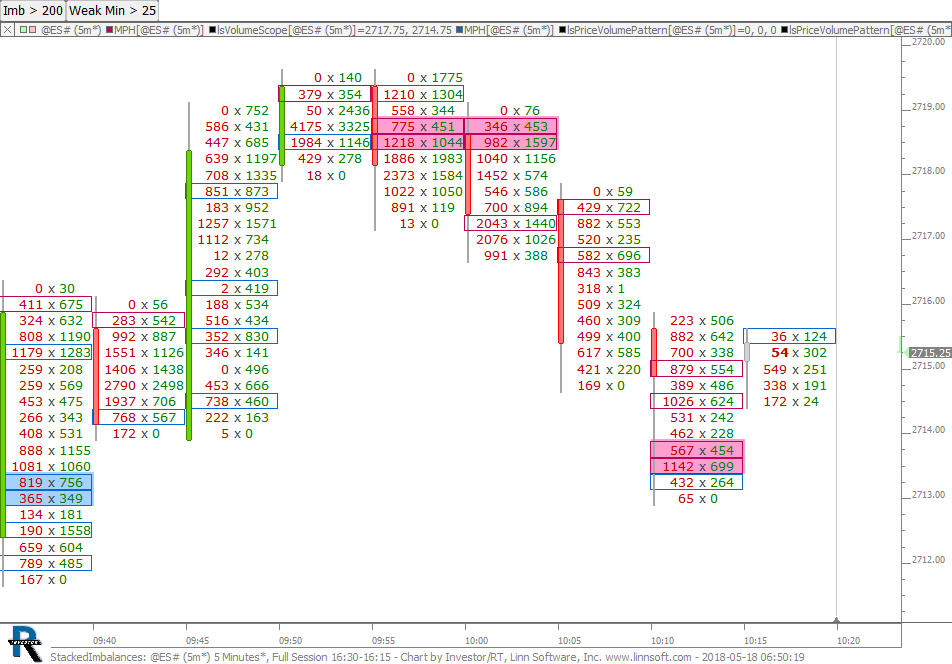
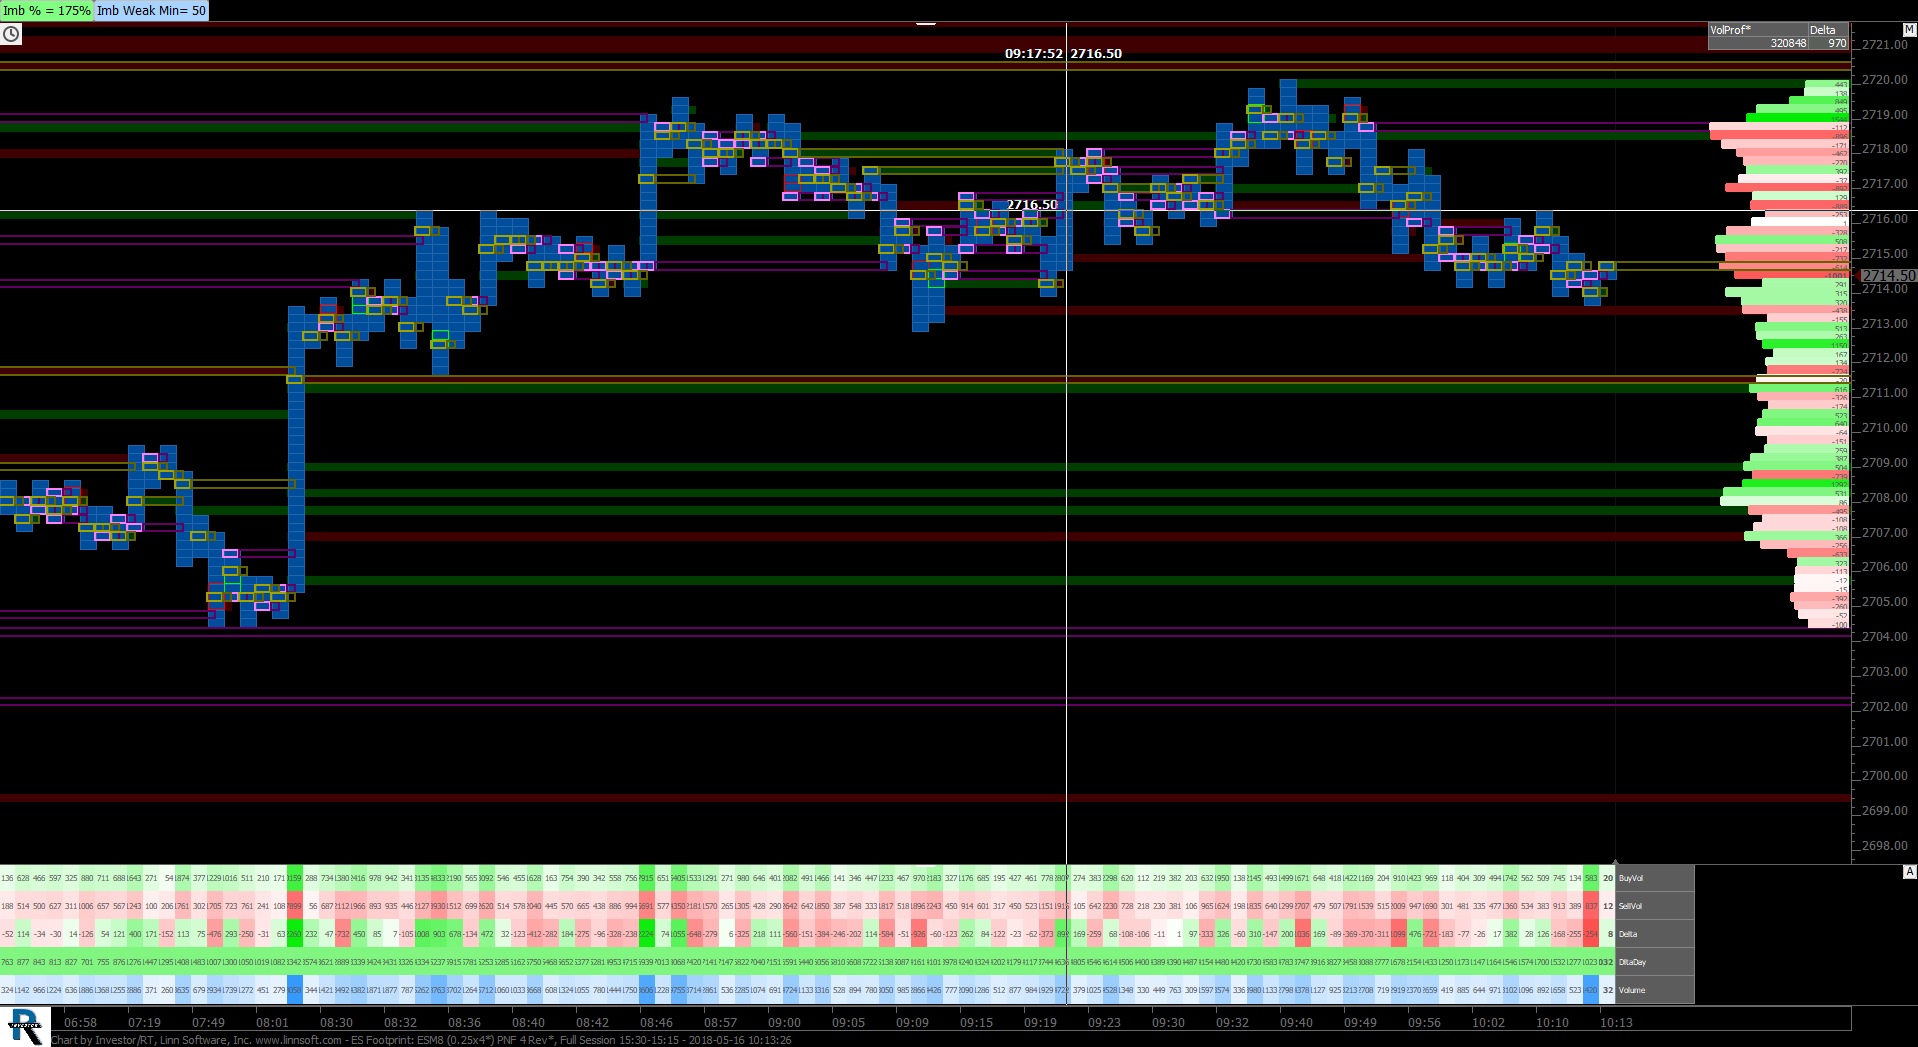
Stacked Imbalances. This chart was uploaded by Investor/RT 13.3.3 showing symbol: @ES#.
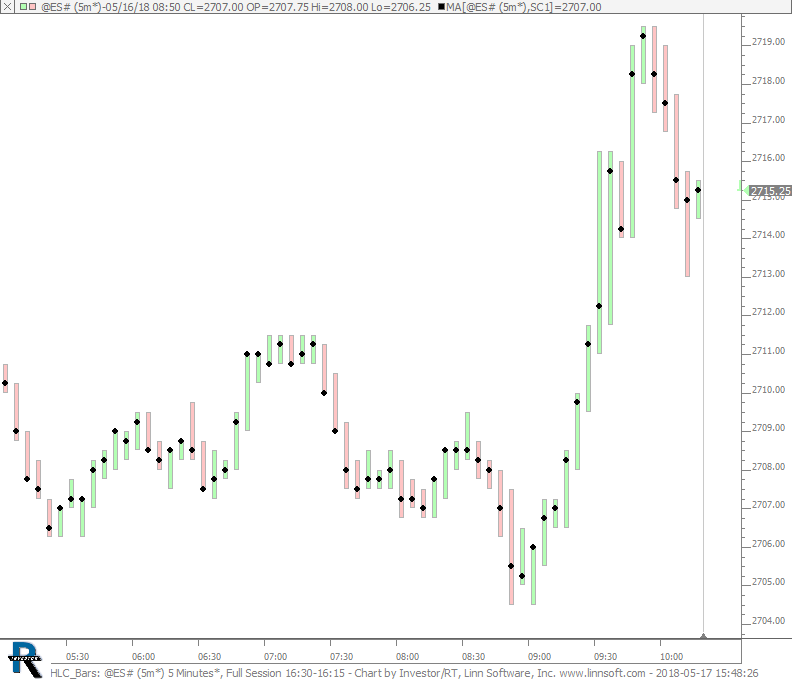
HLC Bars. This chart was uploaded by Investor/RT 13.3.3 showing symbol: @ES#.
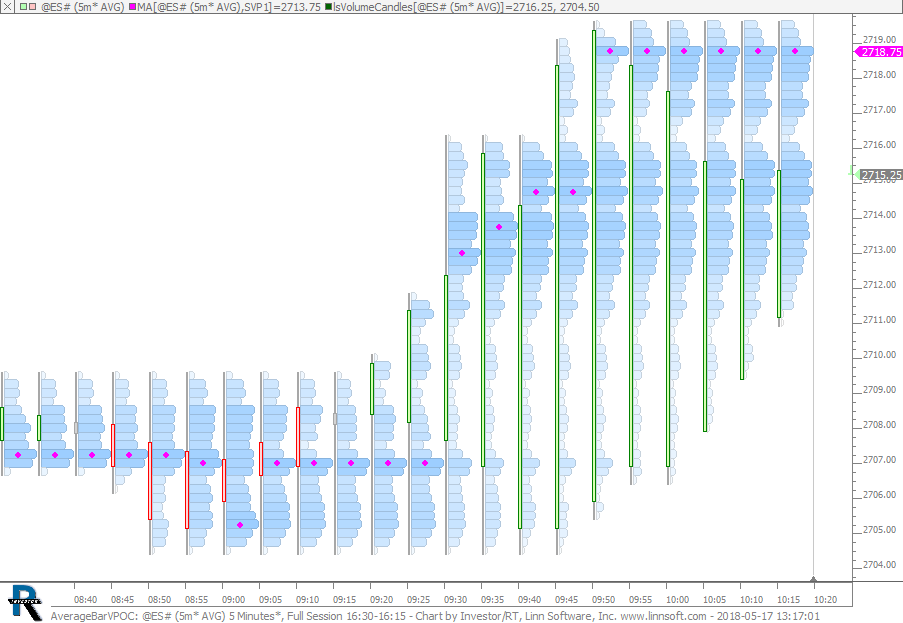
Average Bars - VPOC. This chart was uploaded by Investor/RT 13.3.3 showing symbol: @ES#.
This chart was uploaded by Investor/RT 13.3.3 showing symbol: @ES#.
This chart was uploaded by Investor/RT 13.3.3 showing symbol: @ES#.
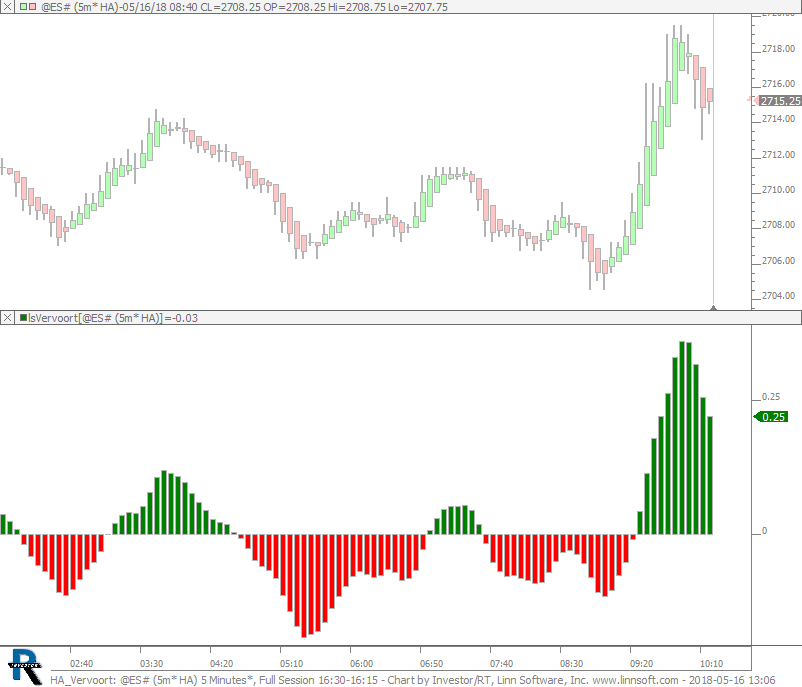
HA Vervoort. This chart was uploaded by Investor/RT 13.3.3 showing symbol: @ES#.
This chart was uploaded by Investor/RT 13.3.3 showing symbol: ESM8.