ES MWD0001 (@ES#)
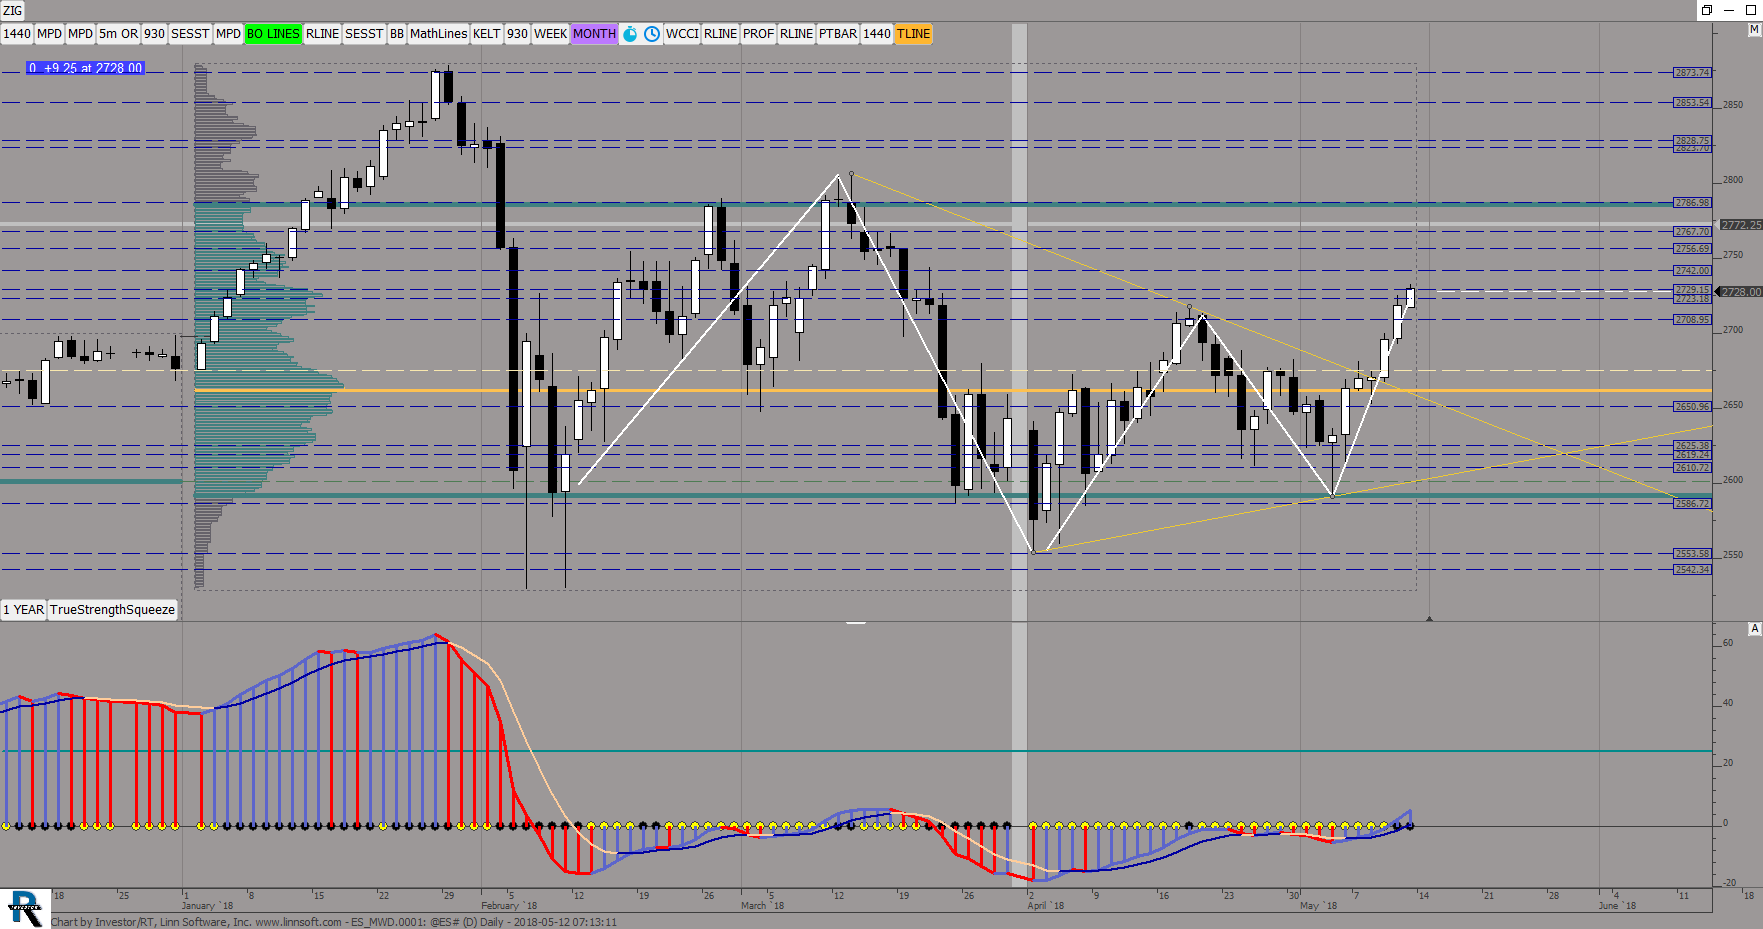
This chart was uploaded by Investor/RT 13.3.3 showing symbol: @ES#.
This chart was uploaded by Investor/RT 13.3.3 showing symbol: @ES#.
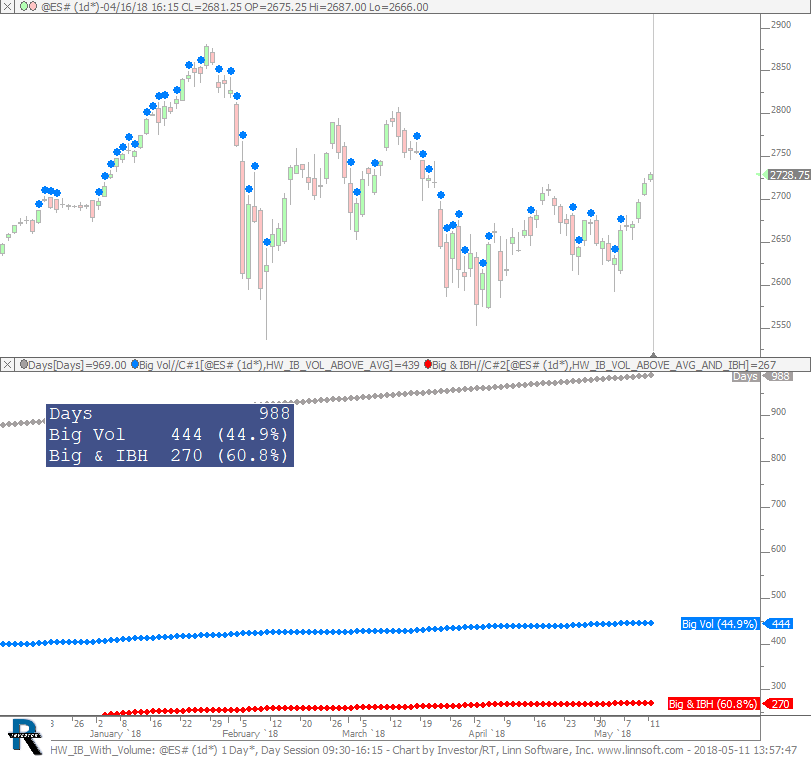
On above average volume IB days, how often does price break above IBH. This chart was uploaded by Investor/RT 13.3.3 showing symbol: @ES#.
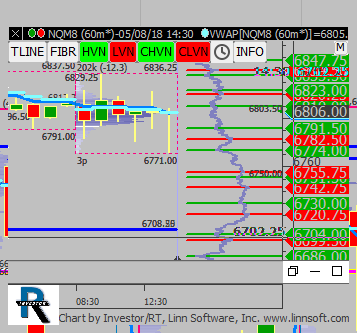
This chart was uploaded by Investor/RT 13.3.1 showing symbol: NQM8.
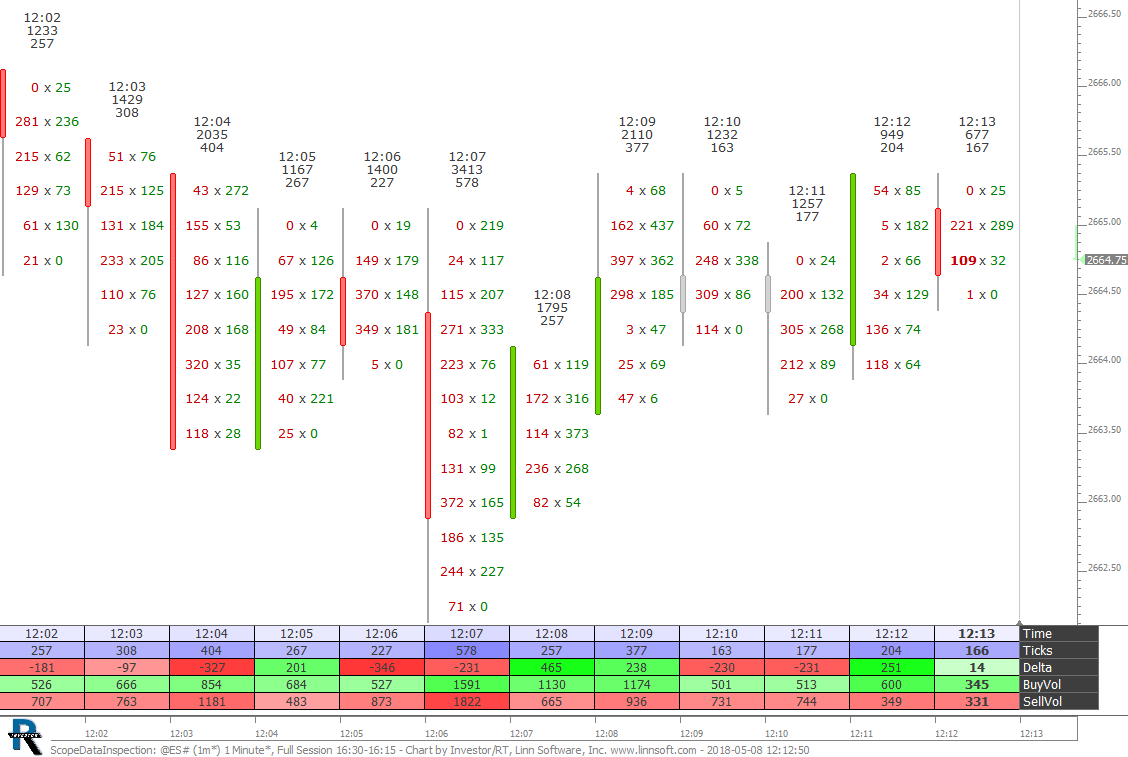
This chart was uploaded by Investor/RT 13.3.1 showing symbol: @ES#.
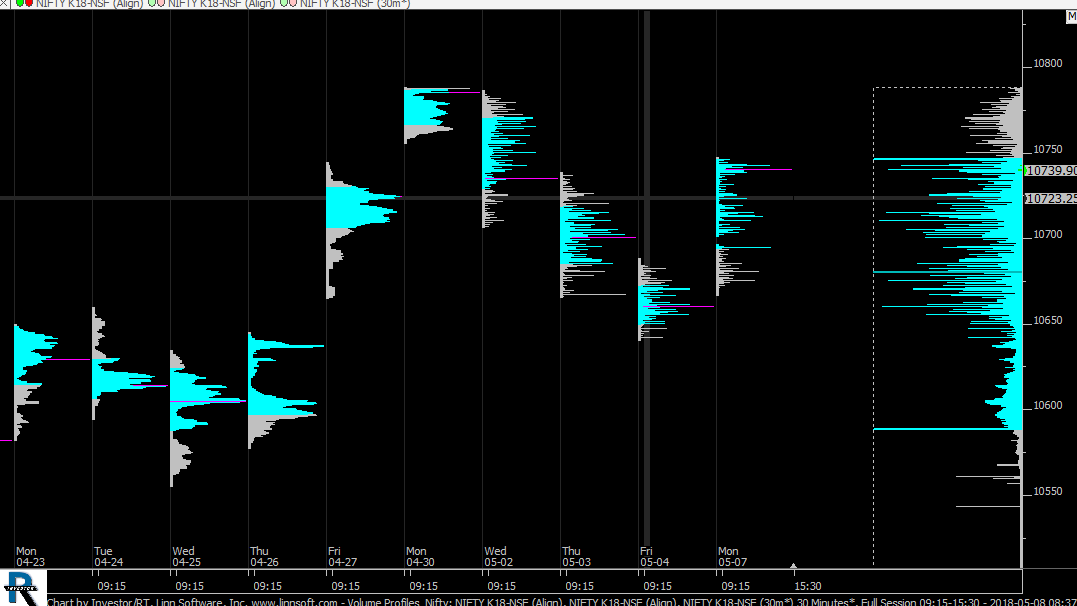
This chart was uploaded by Investor/RT 13.3.1 showing symbol: NIFTY K18-NSF.
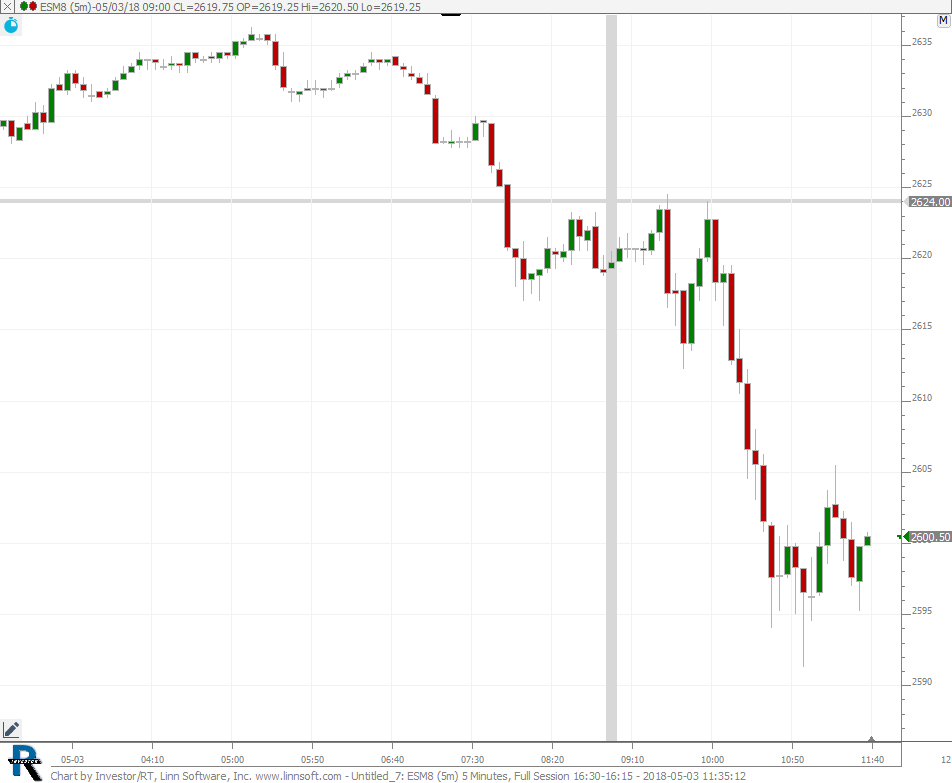
This chart was uploaded by Investor/RT 13.2.8 showing symbol: ESM8.
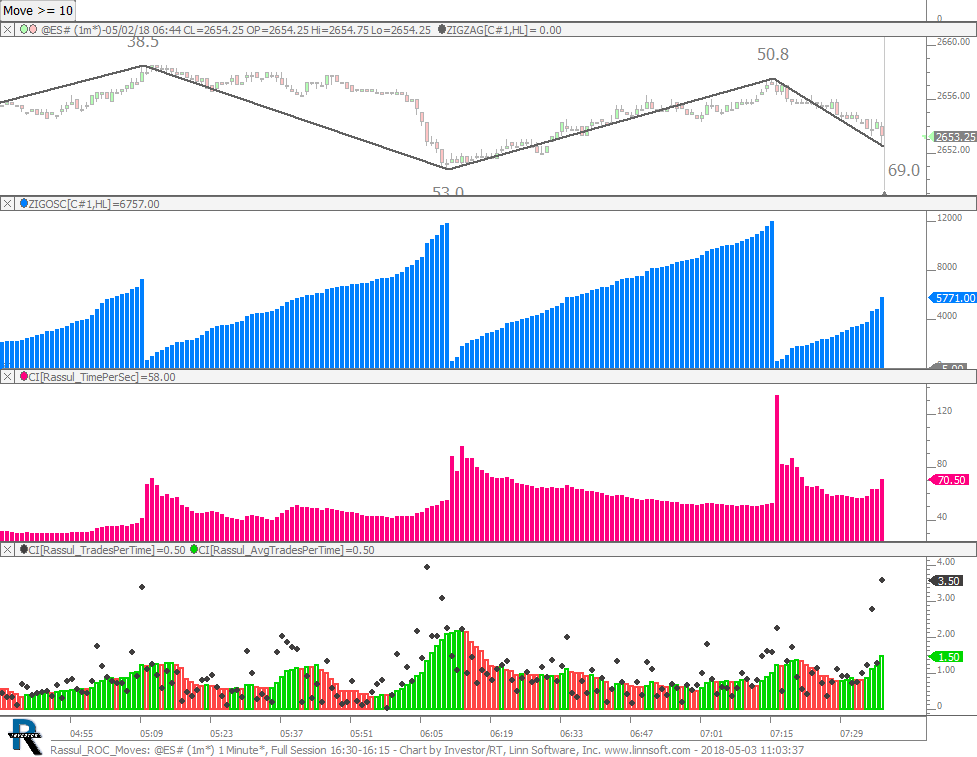
This chart was uploaded by Investor/RT 13.3.1 showing symbol: @ES#.
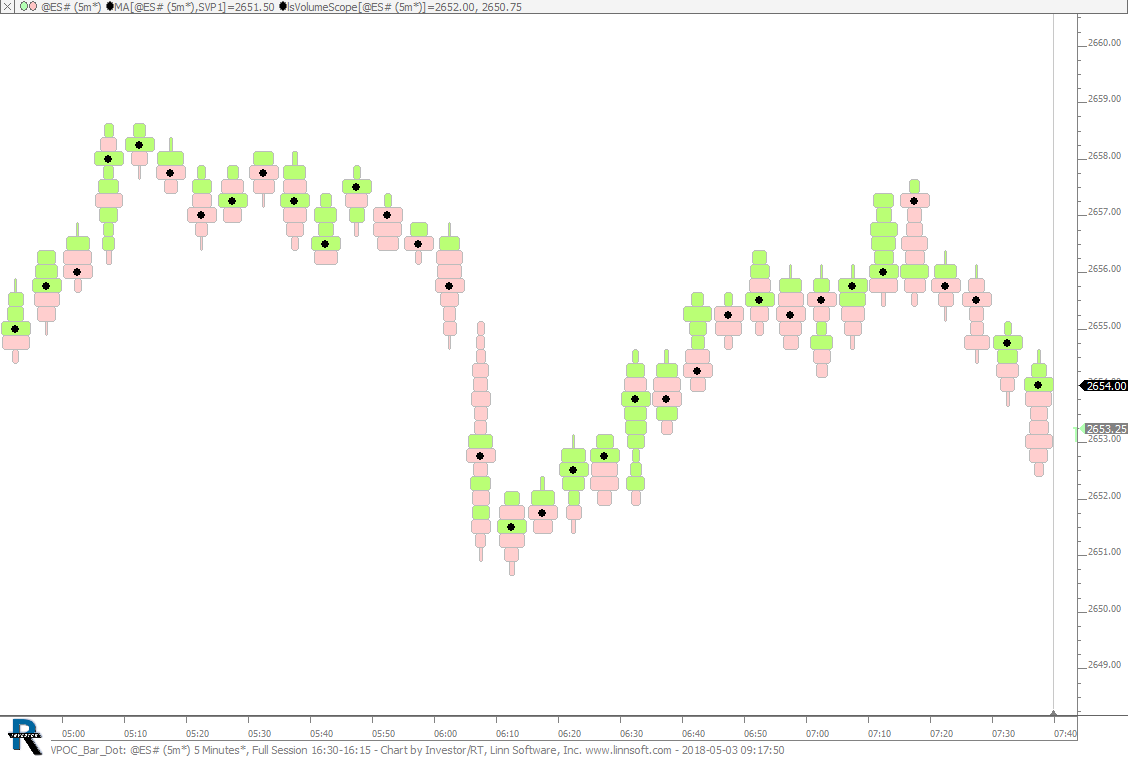
VPOC of Bar is Dot. This chart was uploaded by Investor/RT 13.3.1 showing symbol: @ES#.
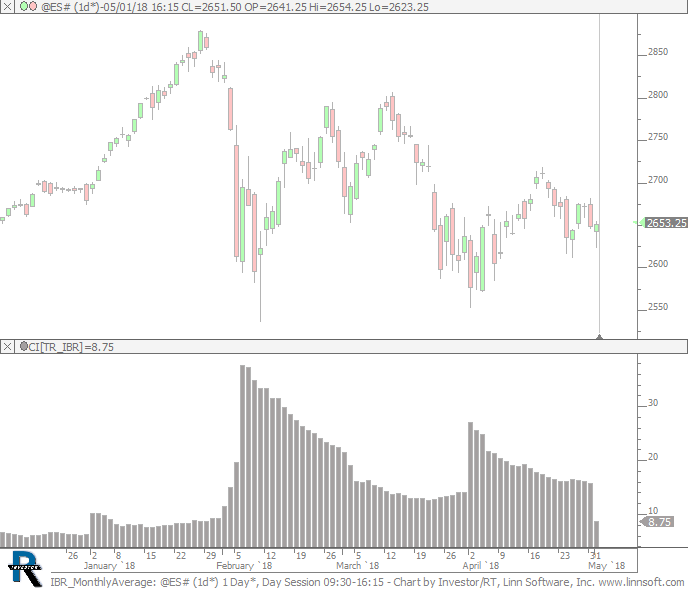
IB Range - Monthly Average. This chart was uploaded by Investor/RT 13.3.1 showing symbol: @ES#.
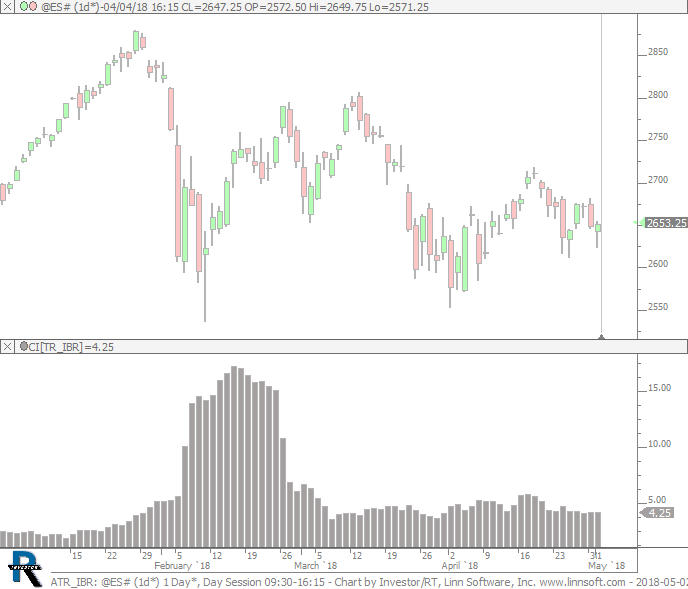
ATR of IB Range. This chart was uploaded by Investor/RT 13.3.1 showing symbol: @ES#.