TPO Profile Charts
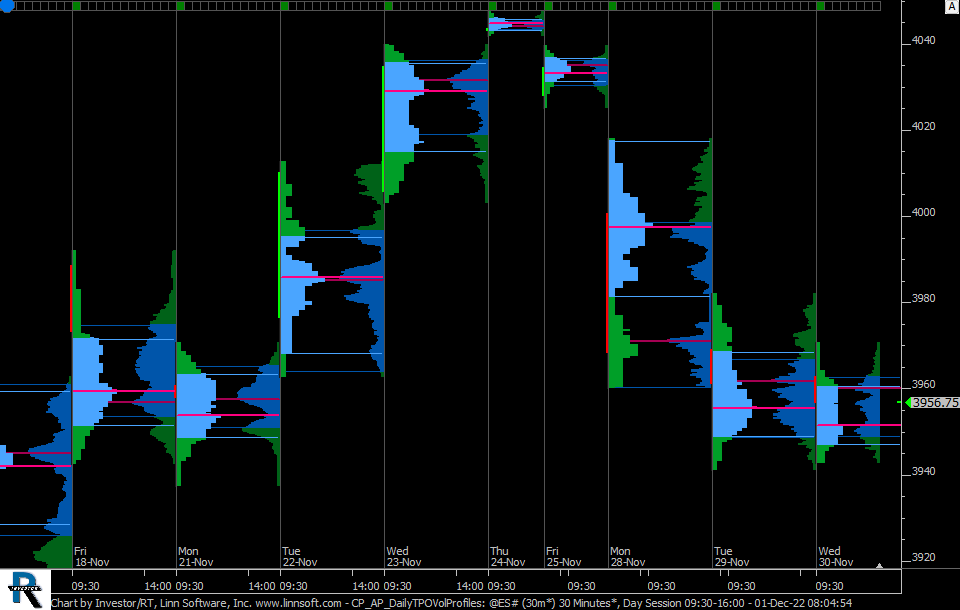
Investor/RT offers a very flexible TPO Profile charting capability. These chart types may be referred to as TPO charts (TPO = "time-price opportunity") or TPO Profile charts by other programs and services. Investor/RT's TPO Profile charts are highlighted by the following features:
- Dynamic
- All TPO Profile charts are dynamic, updating tick by tick (including VA, POC, IB, etc). The current price is highlighted in red in the scale.
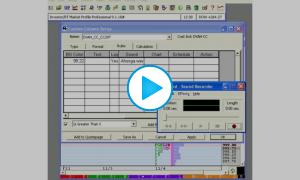
- Playback
- The current session, or prior sessions/days can be played back using a variety of options, such as playing back one letter every 0.5 seconds. A video demonstration of playback is available at the top of this page.
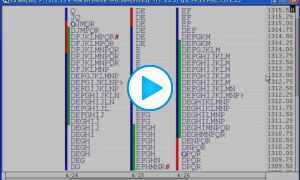
- Multiple Profiles
- Up to 29 Profiles/Days can be shown simultaneously side-by-side in a given chart.
- Intraday Profiles
- Compose profiles of any number of minutes. Build separate profiles for overnight data versus RTH (regular trading hours). Profiles can be split at any letter.
- Multi-Day Profiles
- Any number of days/sessions can be combined (up to 40) into a single profile. Any profile can be merged with the profile to it's right by simply ctrl-clicking on the profile.
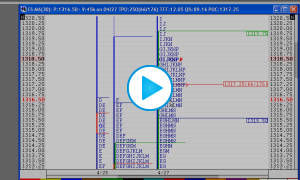
- TPO Chart Info Box and Highlighter
- These two features are linked in that the Highlighter is turned on only when the Info Box is on. The Info Box can be seen along the left edge of the chart above. When the Info Box is on, mouse/cursor movements across the chart drive the new Highlighter, highlighting the cursor's row/price and the cursor's letter. The info box provides feedback on the location of the cursor, including profile-specific, row-specific, and letter-specific information.
- Historical Profiles
- Review profiles up to 58 days into the past.
- Horizontal Scrolling
- The chart can be scrolled back and forth horizontally using a horizontal scrollbar at the bottom of the chart, or by dragging/panning the chart right or left, or by using the left and right arrow keys on keyboard,