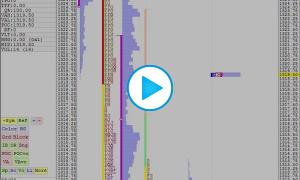
102 - TPO Profile - Composite Profiles
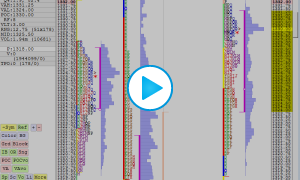
This video demonstrates how to build automated composite profiles (weekly, monthly, quarterly, yearly, etc), as well as how to split or merge daily profiles.
This video demonstrates how to build automated composite profiles (weekly, monthly, quarterly, yearly, etc), as well as how to split or merge daily profiles.
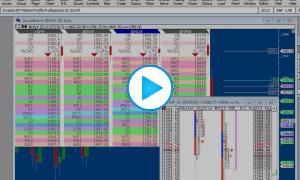
This video demonstrates how to plot TPO Profile Levels (VAH, IBH, etc) in the QuoteBoard. User variables are used to transfer these dynamic prices from the TPO charts to the QuoteBoard.
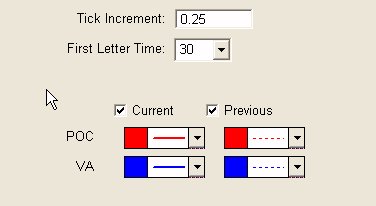
The TPO Indicator computes and displays historical values for TPO Profile price levels: POC, Value Area High (VAH), Value Area Low (VAH), developing POC, VAH, and VAL. It enables review these values historically to see see how price reacted when approaching these levels. While developing POC, VAH, and VAL change throughout the day, traditional TPO Profile charts only show the current values. The TPO Indicator allows the user to look back and see where the levels were at any given historical time. TPO is an acronym for Time/Price Opportunity.
This video demonstrates how to use the TPO Profile playback feature to quickly jump to the current day and play it back at various rates.
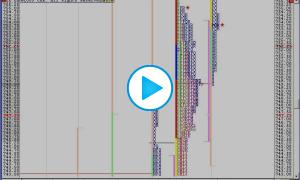
Playback of the day session on ES on March 3, 2011 - using the TPO playback feature. --
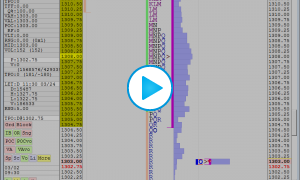
Playback of the day session on ES on February 2, 2011 using the TPO playback feature.