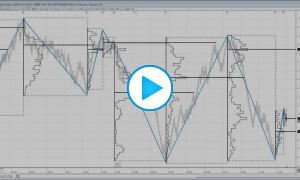
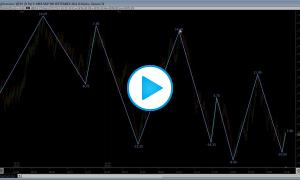
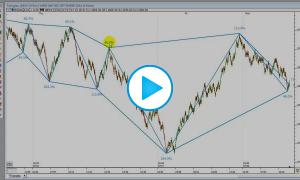
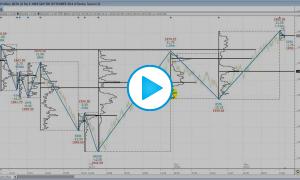
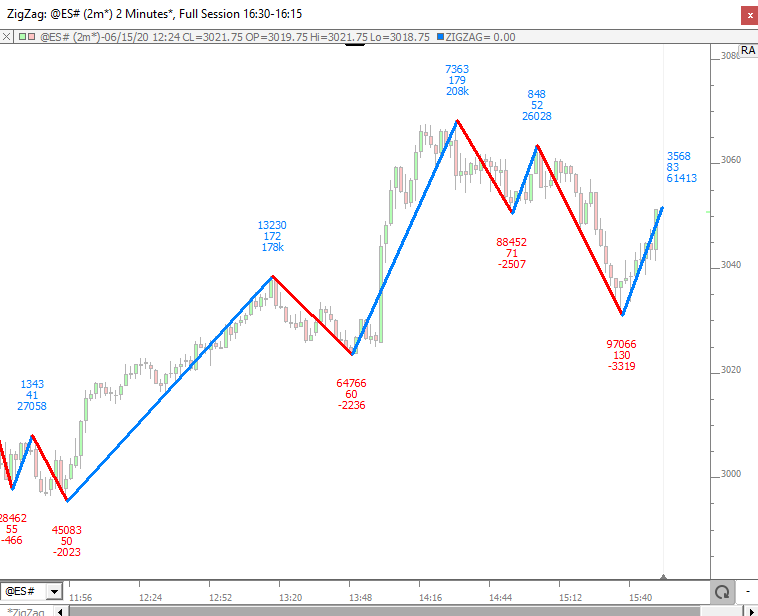
zig zag

Analysis Of A Move

This video demonstrates how to analyze moves by accumulating statistical data from each price move and labeling the end points of those moves with the data values. This analysis is available to both the Zig Zag indicator for automatic identification of moves as well as the Trendline indicator for manual identification of moves.

Profiling Market Moves: Dynamic Zig Zag Profiles

This video demonstrates how to form dynamic volume profiles of market moves identified by the Zig Zag Indicator. In this case, we take moves of $5 or greater on the ES and construct volume at price profiles. Zig Zag based Signals are used to dictate the start and end of each profile, but this dynamic profile concept can be expanded beyond the use of Zig Zags. Any condition that can be represented with a Signal can be used to identify the start and end of Profiles.

Zig Zag Indicator: Simplify, Organize, and Aggregate Market Moves

This video provides an overview of the Zig Zag Indicator. Zig Zag is a very popular and powerful indicator designed to simplify, organize, and aggregate market moves. Zig Zag draws trendlines between key pivot/reversal highs and lows determined by a user specified minimum price move. Each trendline or leg can be labeled with a variety of statistics that involve the volume, delta, bars, price moves, time, or relative retracement of each move. These labels may be stacked vertically to simultaneously view multiple pieces of data on each leg.

Triangles: Using Fibonacci Extension and Zig Zag

This video demonstrates two options for drawing triangles in Investor/RT. First it demonstrates how to draw automated triangles based on price moves using the Zig Zag Indicator. These triangles have the option of being automatically labeled with the retracement of the previous move, among other options. Then the Fibonacci Extensions drawing tool is used to demonstrate how to draw custom individual triangles. These triangles have the option of drawing lines of various retracement levels automatically. These tools can help identify and quantify harmonic patterns.

Zig Zag Profiles - Adjusting Minimum Change Globally

Zig Zag Profiles - Adjusting Minimum Change Globally

This video is a follow up to the video Profiling Market Moves: Dynamic Zig Zag Profiles

In this video, we go a step further and describe how to centrally and globally adjust the minimum price changed used by the multiple instances of Zig Zag within the chart. By specifying a minimum price change as a user variable (V#21), all instances of Zig Zag will share an underlying price change value, and a button indicator can be used to allow the user to quickly change the price change for all Zig Zag instances in the chart. The chart instantly responds by updating to the new minimum change.

Zig Zag Indicator (ZIG)

The Zig Zag Indicator is a series of trendlines that connect significant tops and bottoms on a price chart. The Minimum Price Change parameter specifies the percentage that the price must move to form a new zig or zag leg. It can be used to identify potential chart patterns and Elliot Wave formations.

Zig Zag Oscillator Indicator (ZZO)

The Zig Zag Oscillator indicator provides a way of viewing the Zig Zag Indicator information in a different form. Through the years, the Zigzag oscillator has become one of the most versatile indicators of the whole Investor/RT unique toolkit when it comes to analyse waves and identify market conditions.

Pages