The method described below explains how to plot the Initial Balance High (IBH) and Initial Balance Low (IBL) of the day session, on a chart set to any session and periodicity. Chart definitions are included and once you import the chart, you can easily drag and drop the indicators to your existing charts.
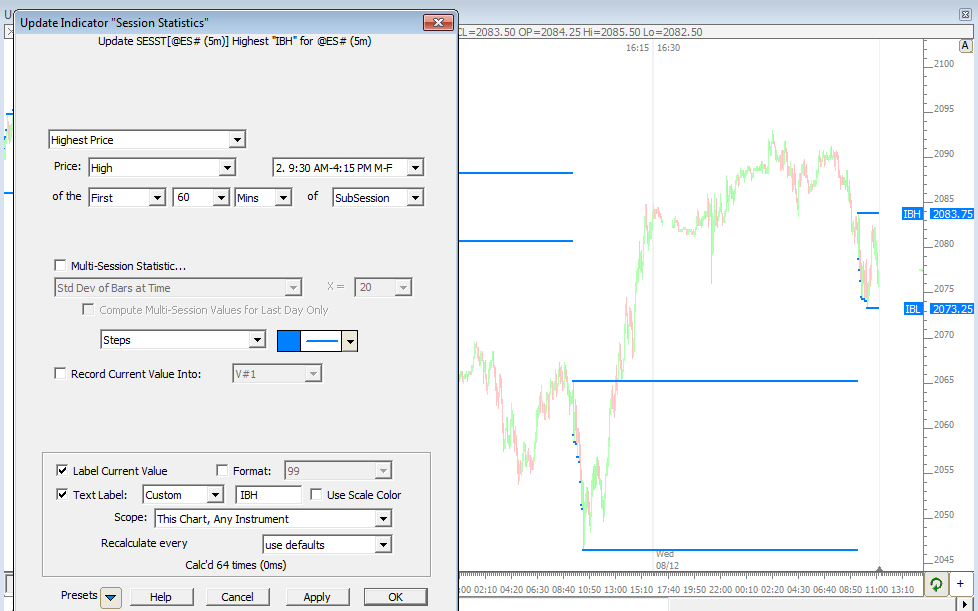
If your chart is time based (1m, 5m, 15m, 30m) then you may use Session Statistics directly to plot the IBH and IBL. The image below shows the SESST settings for IBH. This will work regardless of whether the chart is set to day session (session 2) or the Globes/24hr session (session 31). Notice it's set to "Highest High of First 60 Minutes of the SubSession (Session 2)". To plot the IBL, use the same settings but simply change the Highest Price: High to Lowest Price: Low.
Keep in mind this method will only work on intraday periodicities that are time based. Session Statistics operates on the bars in the chart, so if the bars don't line up properly to the begin and end of the IB period, then Session Statistics won't give you reliable results. However, there is a workaround.
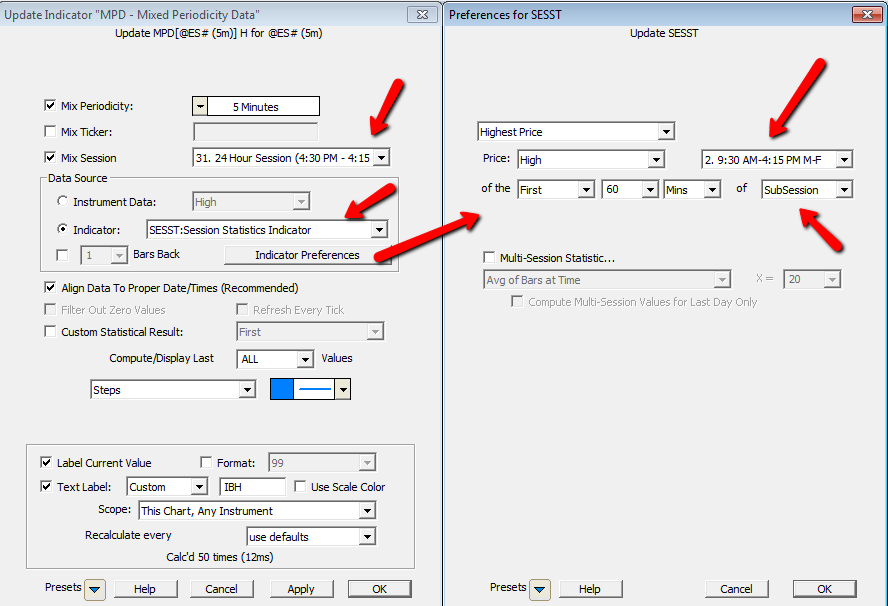
This method not only works on charts of any session, but also charts of any intraday periodicity. Again, Session Statistics is used, but within MPD. See the image below for how to setup the MPD. SESST is used as the data source within the MPD, and the SESST settings are the same as above. By using MPD, we can lock the SESST calculation to a time-based periodicity (in this case we used 5min for the mixed periodicity).