
https://www.linnsoft.com/charts/openbands-es
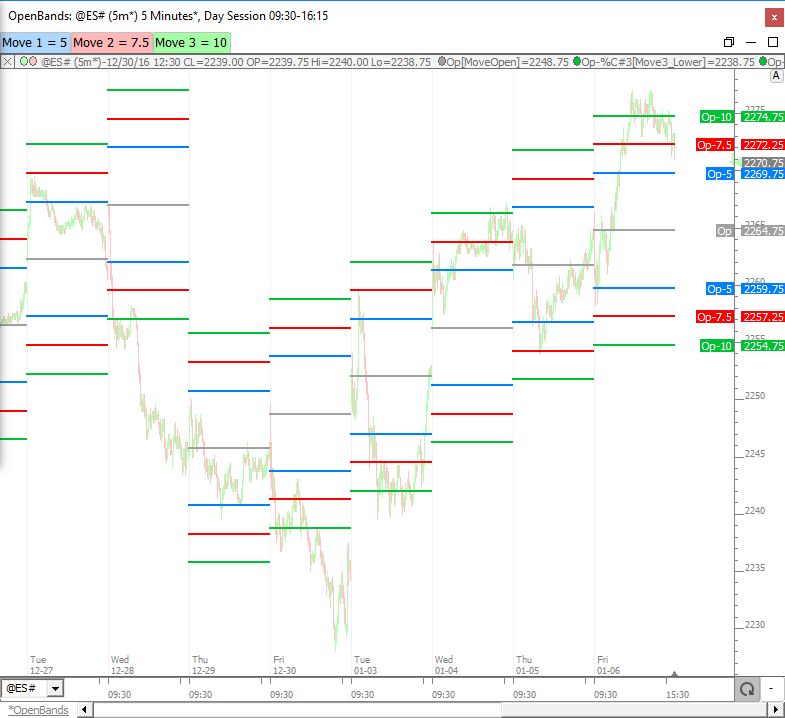
This chart plots 3 sets of bands a user defined distance (in $) from the open of the session. Use the buttons at the top to adjust the distance of each set of bands. Bands are labeled with their offset from open. Opening price is plotted with a gray line. To move to another chart, user must drag and drop each line. Buttons may be moved by right-clicking on button and "Copy" and then click on other chart and paste with Ctrl-v.
https://www.linnsoft.com/charts/openbandrangebased-es
This chart draws bands centered about the session open, with magnitude corresponding to user-specified percent of average daily range. Blue lines are drawn at 100% of average daily range from the open. Orange, Red, and Green line percentages are user controlled by the buttons at top with corresponding color. All 7 lines are driven by a single indicator (The Band Indicator) and therefore can be easily moved to another chart by dragging the 100% lines (blue lines) and dropping in new chart. Buttons should also be moved by right-clicking on button and "Copy" then click on other/new chart and paste (Ctrl-v).
If you have any special requests with respect to opening bands or some derivative of this concept, please respond to this topic and we will make it happen.
The table below was produced using this chart to present how often price moved a certain percent of the average daily range from the open. This table reflects 2000 days of data ending 01/10/2017. As an example, for the 10% row, the Up column tells us how many days we moved up 10% (of daily average range) from the open. The Down column tells us how many days we moved down 10% from the open. The Both column tells us how many days we moved BOTH up and down 10% from the open (price moved either up or down at least 10% and then reversed, moving thru the open, and back to the 10% mark on the other side of the open). The average range used was the 20 period exponential range of the day session which was 12.84 on 01/10/2017. The day where we move down 600% was 05/06/10. The day where we moved both up and down 150% was 08/24/15.
I had to reread the post a couple of times and check the RTL code to fully grasp this :)
For "Both", I now understand this to be that it simply reached both extremes during the entirety of the day session.
When I first read it I mistakenly thought for both it had to reverse and get to the other extreme in the same move rather that at some point during the session.
Yes. If open is at 1800 for instance, and average range is 20, and we are studying the 150% line. 150% of the 20 range is 30. So for a day to qualify for BOTH it simply must have touched both 1830 and 1770 during the session, moving 30 points in both direction from the open at some point during the session. This chart plots the open and open percent bangs on an intraday chart, and the screenshot below shows 08/24/2015 when we moved both up and down 150%.
And here is a closer look at 05/06/2010 where we moved down > 600% from open.